
 2 months ago
35
2 months ago
35
Solana (SOL) price trades near $79.30 on April 3, up 0.6% over the past 24 hours after its spot ETF recorded the first positive net inflow in six trading days.
The $932,850 inflow on April 2 broke a streak of zero and negative activity stretching back to late March. A bullish RSI divergence on the daily chart adds to the bounce case.
However, exchange data shows that participants are already selling into the early strength, a pattern that historically weakened prior rallies. The question is whether institutional flows through the ETF can overpower the selling pressure building on exchanges.
Solana ETF Comeback Meets a Familiar Divergence
Solana ETF flows turned positive on April 2 with $932,850 in net inflows, ending a six-day stretch that included three outflow days totaling roughly $15 million and three days of zero activity. The return of institutional interest, even at a modest level, provides a potential tailwind for the bounce that the daily chart is signaling.
Want more token insights like this? Sign up for Editor Harsh Notariya’s Daily Crypto Newsletter here.
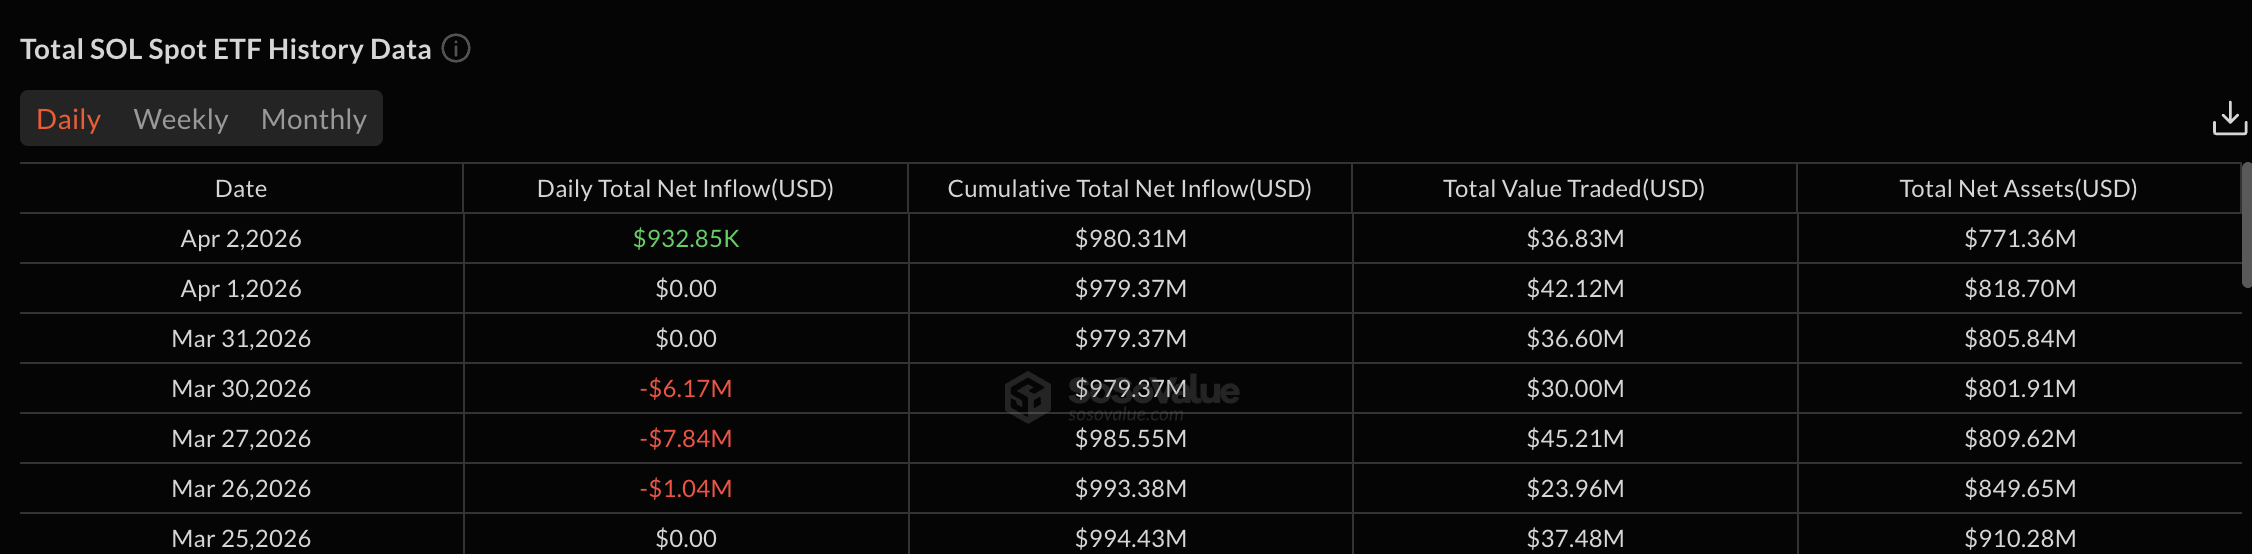 ETF Streak Breaks: SoSo Value
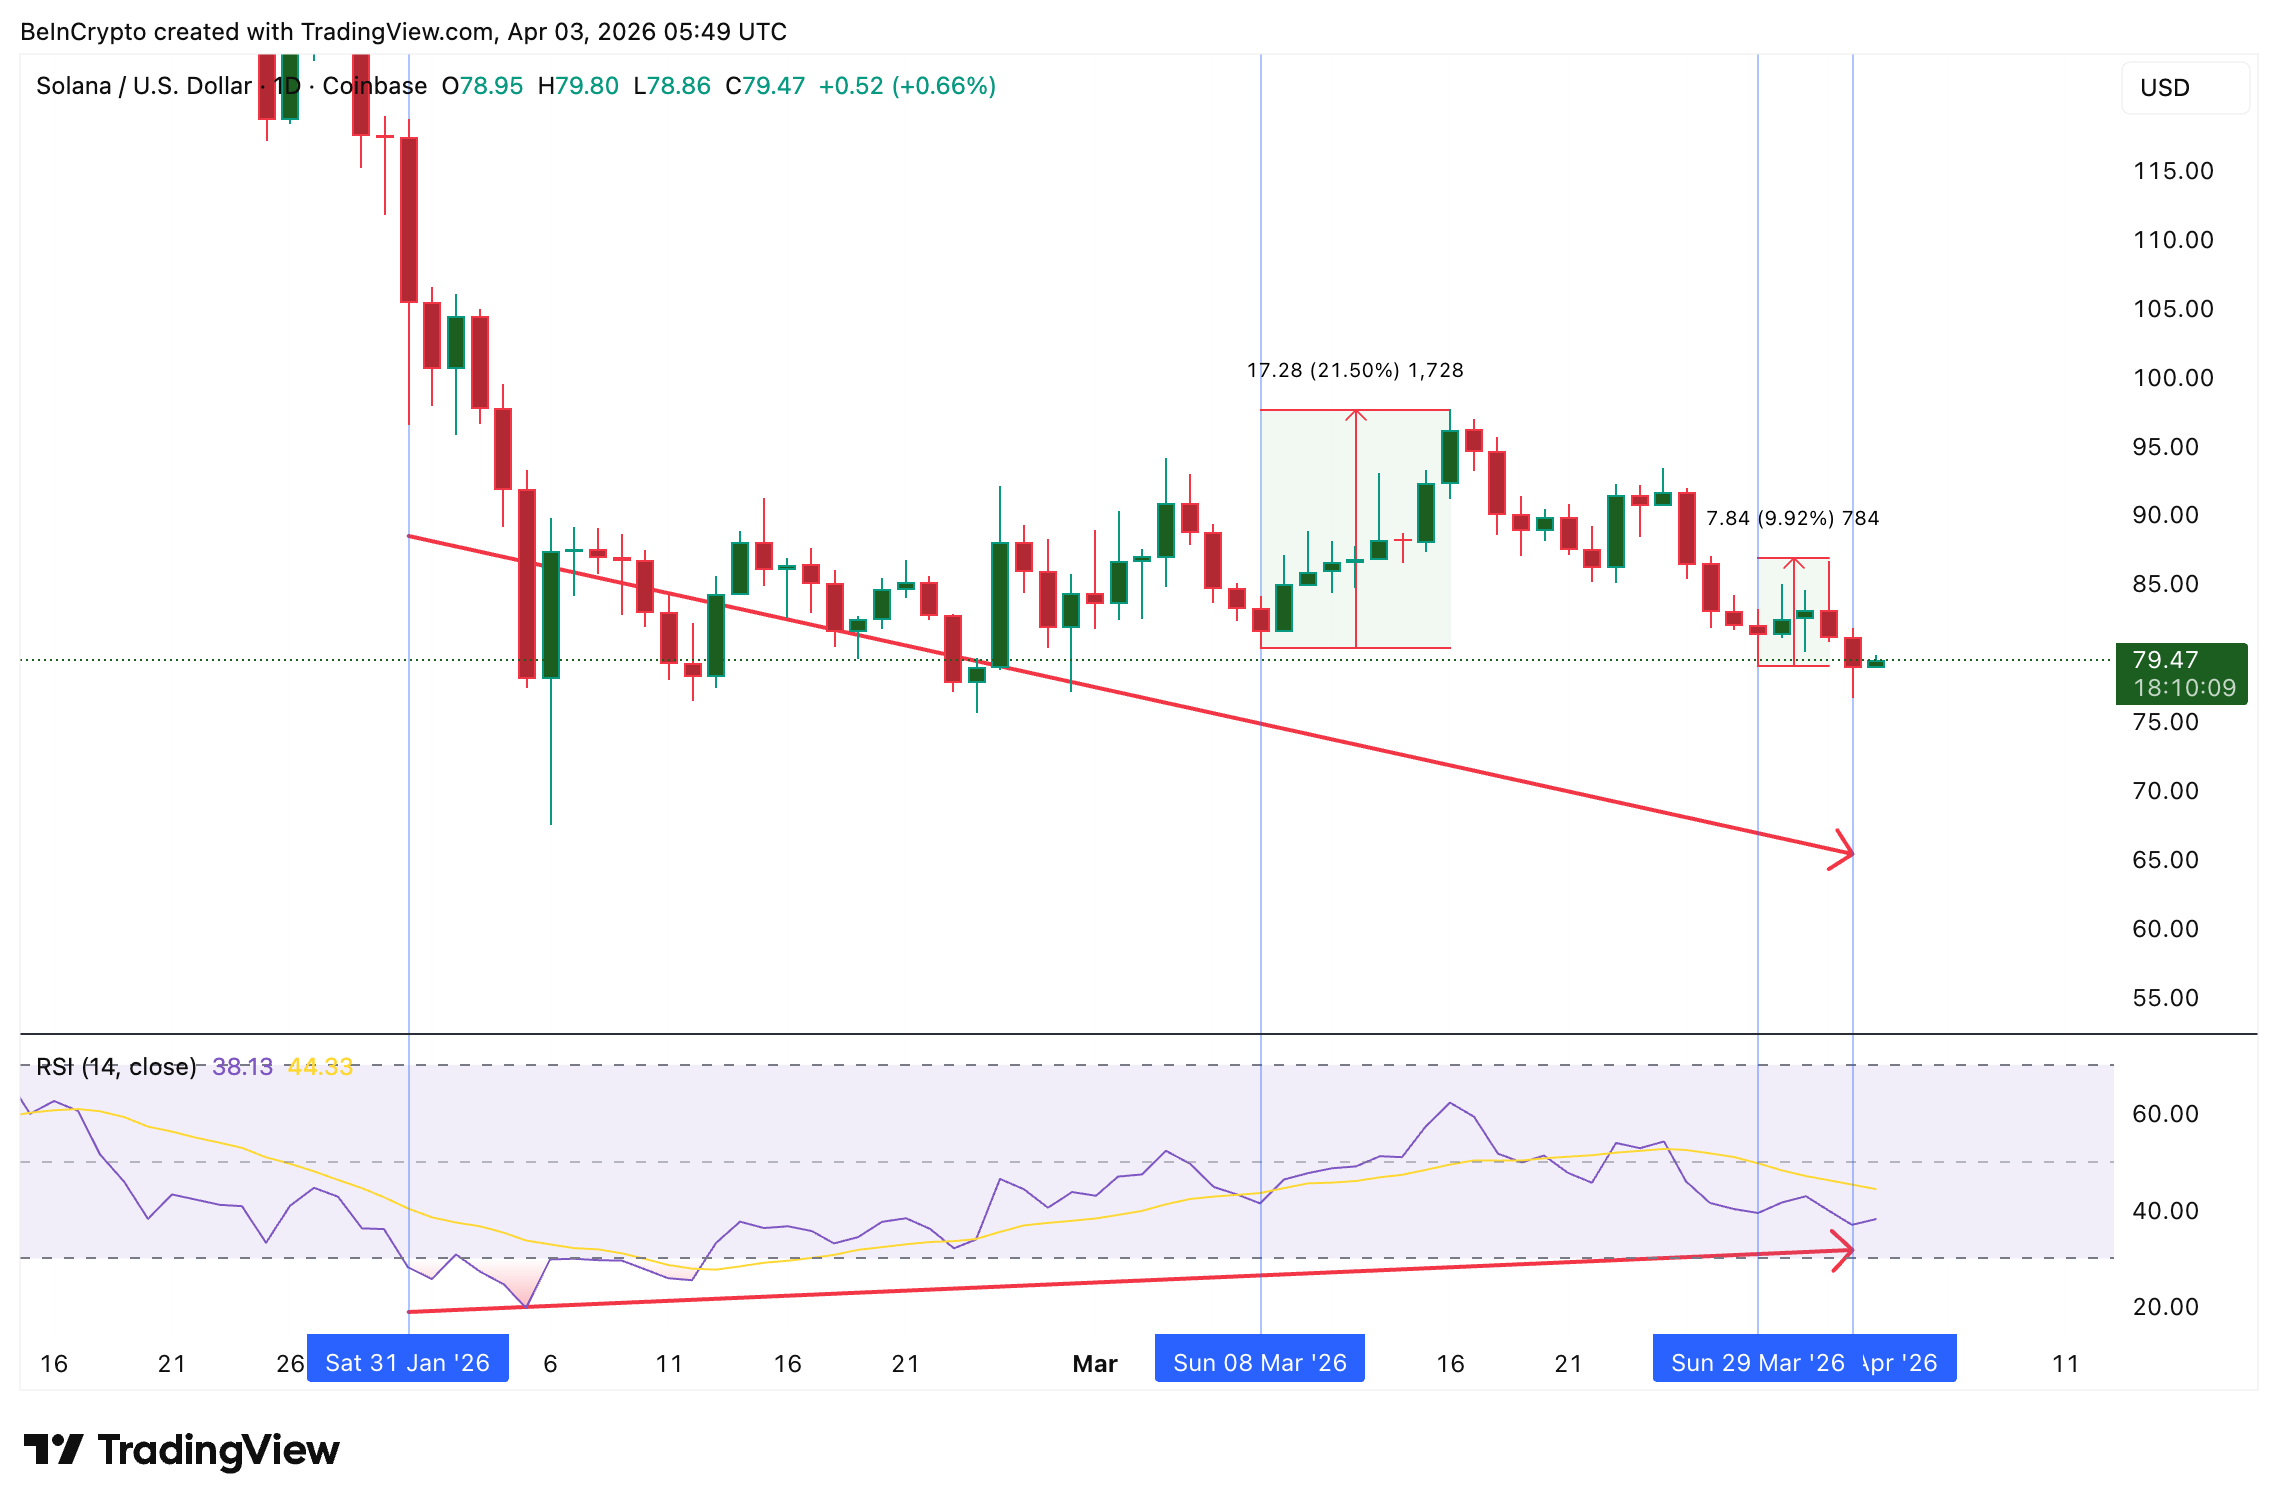
On the daily chart, between January 31 and April 2, Solana price made a lower low while the Relative Strength Index (RSI), a momentum oscillator, made a higher low. That standard bullish divergence signals weakening selling momentum.
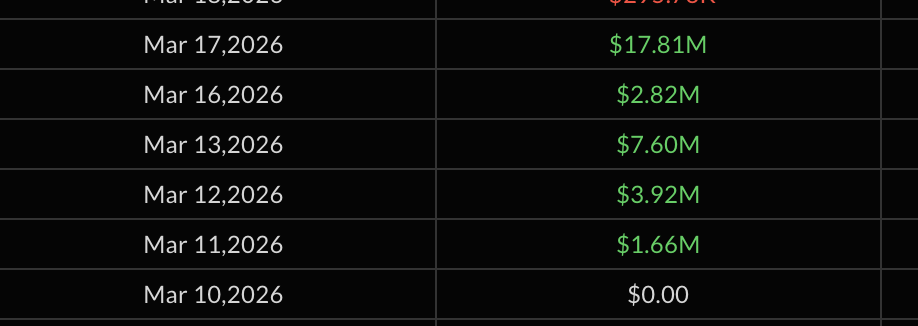
This exact pattern has appeared twice before with different outcomes tied directly to ETF activity. The first divergence, confirmed around March 8, preceded a 21.5% rally between March 8 and March 16.
 RSI Divergence History: TradingView
During that period, SOL ETF inflows were consistently positive, with daily flows of $1.66 million, $3.92 million, $7.60 million, and $2.82 million. The institutional tailwind helped the divergence convert into a sustained move.
 ETF Flow History: SoSoValue
The second divergence, confirmed around March 29, produced only a 10% bounce. Between March 29 and April 1, ETF flows were either flat or negative, offering no institutional support. The divergence technically worked, but lacked the fuel to sustain itself.
The current divergence, confirmed on April 2, now has its first day of positive flow. Whether the ETF streak continues will likely determine if this Solana bounce resembles the 21% rally or something weaker.
Exchange Sellers Are Already Moving
While the Solana ETF sent its first positive signal in nearly a week, on-chain exchange data tells a contrasting story. The exchange net position change, a Glassnode metric that tracks the net flow of tokens into and out of exchange wallets, turned sharply positive on April 2. The reading surged from 160,431 SOL on April 1 to 860,995 SOL on April 2, a more than fivefold increase in a single day.
A positive net position change means more SOL is flowing onto exchanges than leaving, which typically signals selling intent. The timing matters because this spike coincides with the early stages of the RSI divergence bounce.
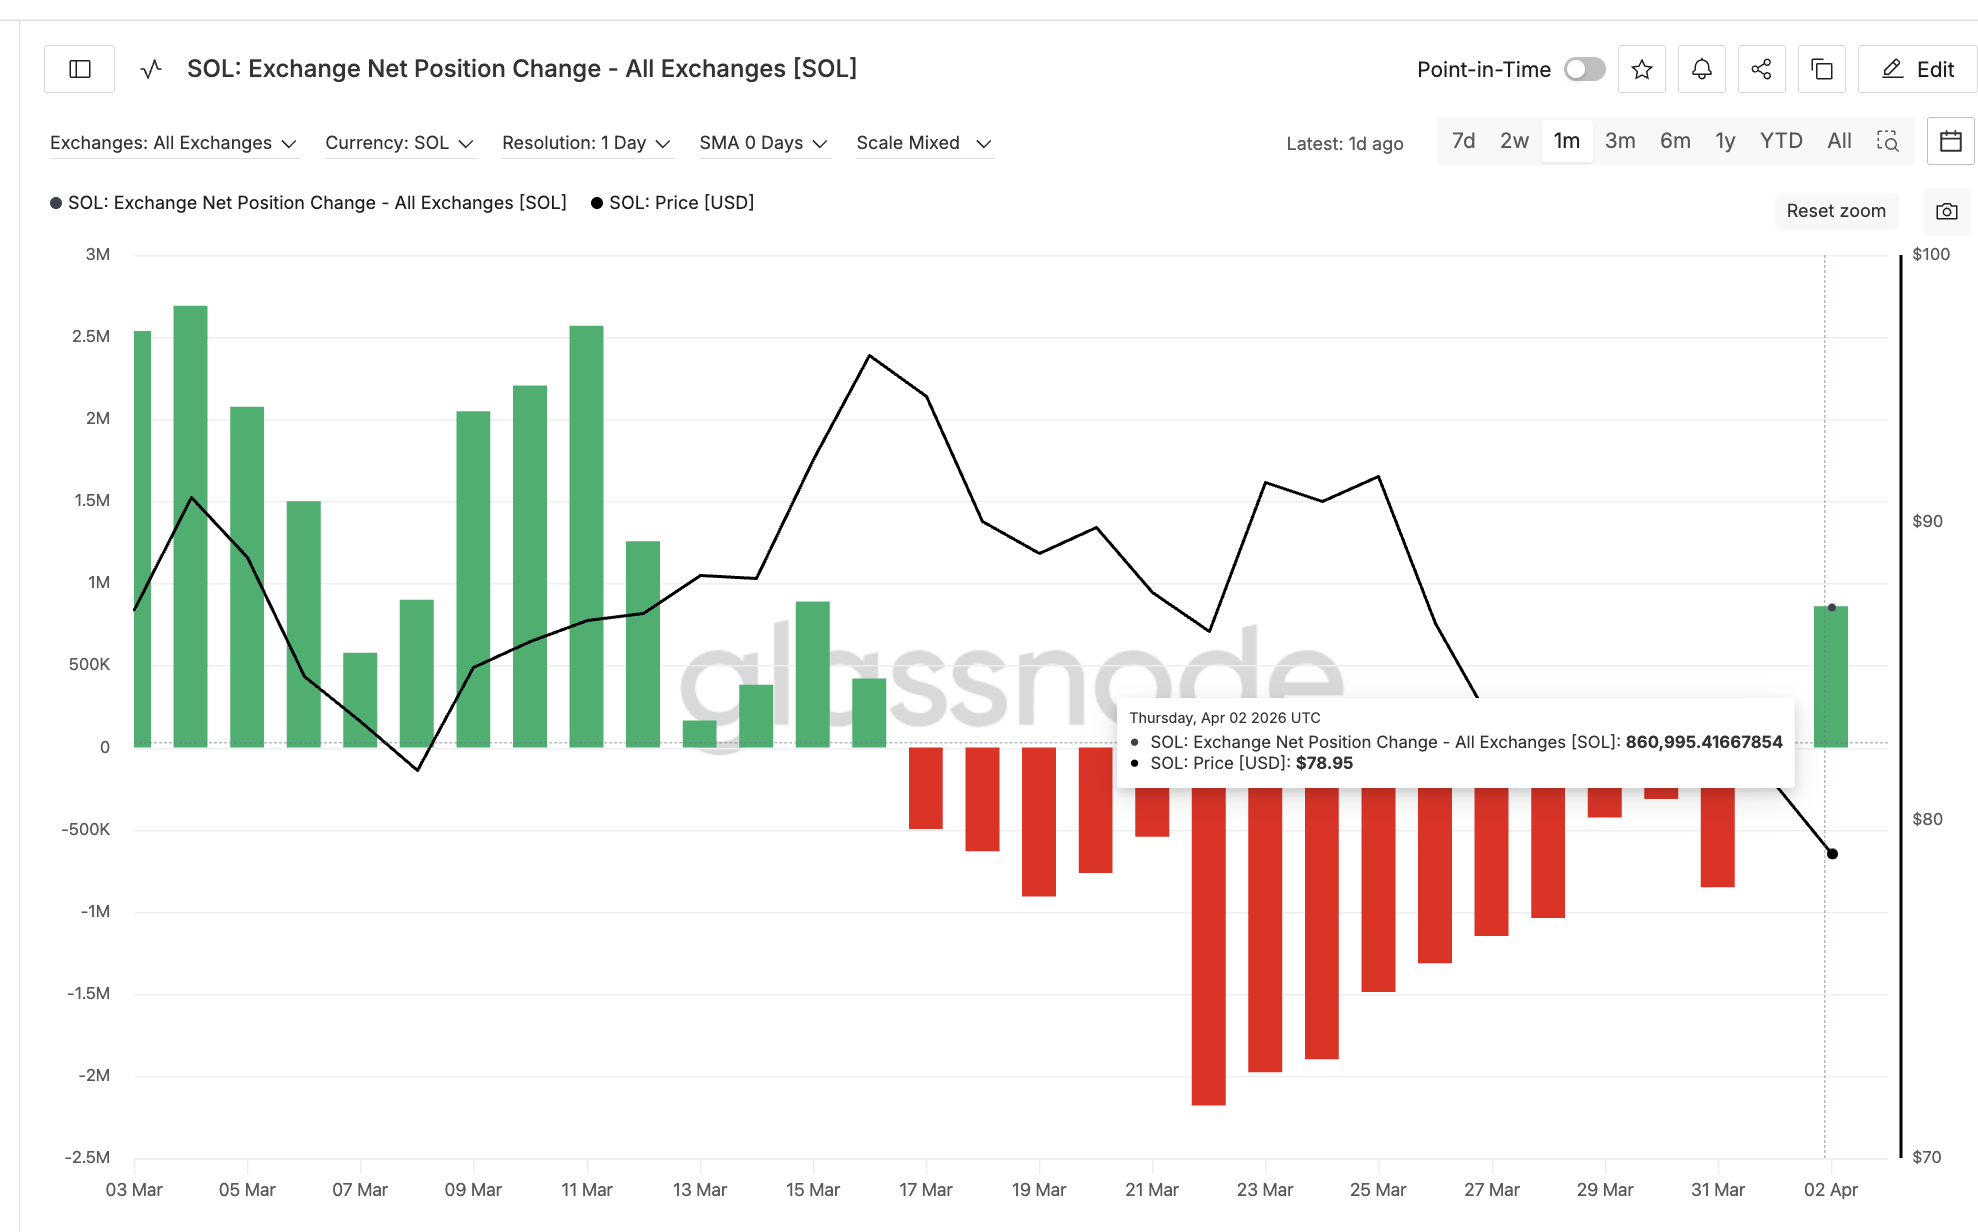 Exchange Net Position Change: Glassnode
A similar dynamic played out during the March 8 to 16 rally. Throughout that entire 21% move, the exchange net position change remained in green, meaning sellers were active the whole time.
Despite that selling pressure, the ETF tailwind was strong enough to absorb it and push prices higher. When the rally ended and prices began correcting, the exchange metric flipped negative as participants started buying, effectively buying the top.
The current pattern suggests that exchange participants are once again selling into a bounce rather than accumulating ahead of it. This could also mean selling into strength to minimize losses.
If ETF inflows remain modest, this selling pressure may be enough to cap the move early. However, if institutional flows accelerate as they did in mid-March, the selling could be absorbed.
Solana Price and the $79 Floor
The daily chart frames every critical Solana price level from here. SOL currently trades at $79.30, sitting directly on the 0.618 Fib at $79.06. This level has historically acted as a strong support zone across multiple asset classes, and for Solana, it represents the most important floor in the current structure.
A daily close below $79 would weaken the bounce thesis and open the path toward $73.99, the 0.786 Fib. Below that, $67.53 becomes the next major support.
For the divergence to convert into a meaningful rally, Solana price needs to reclaim $82.62, the 0.5 Fib, followed by $86.18 at the 0.382 level. A move above $86 would confirm that the ETF tailwind is outweighing exchange selling and could target $90, representing approximately 14% upside from current levels. A push toward $97.71 would bring back the March 16 high.
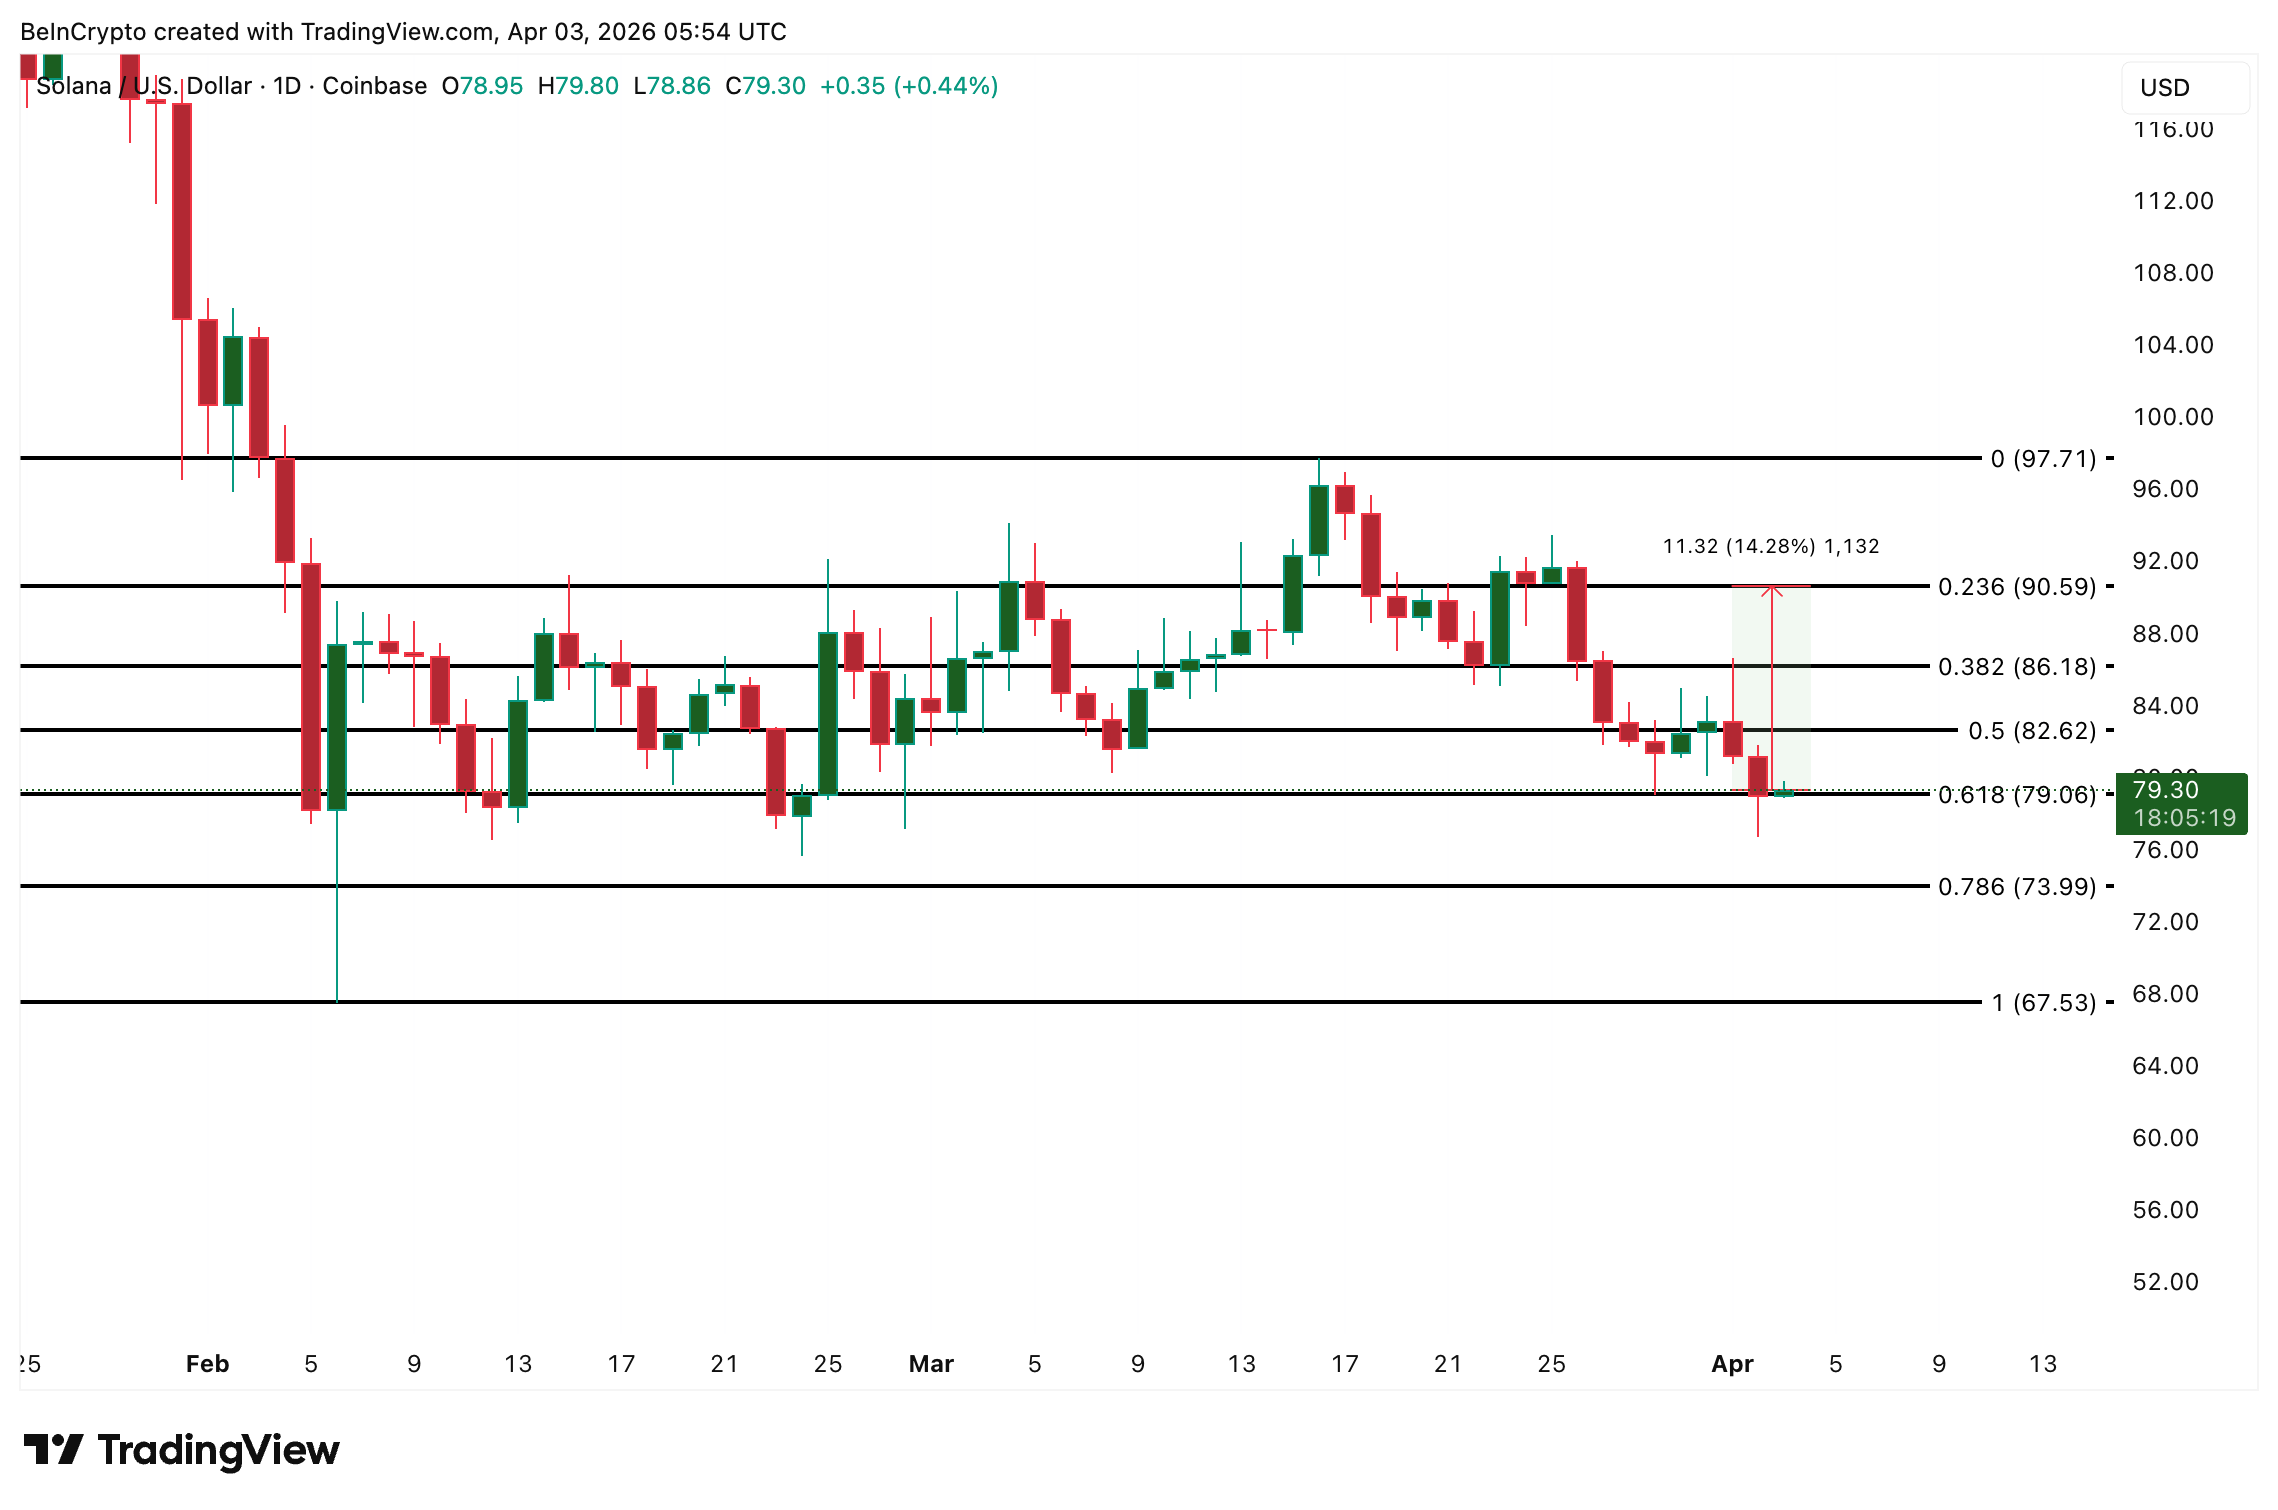 Solana Price Analysis: TradingView
The divergence provides the technical signal, the ETF provides the institutional catalyst, and the exchange selling provides the headwind. The March precedent shows that when ETF flows are strong enough, the bounce survives despite active selling. When they are not, the bounce fades quickly.
A daily close below $79 separates a divergence-driven bounce from a deeper correction toward $73.99, while reclaiming $82.62 with sustained ETF inflows would confirm the rally has institutional backing.
The post A 6-Day Solana ETF Drought Just Ended, but Price Bounce Faces an Immediate Problem appeared first on BeInCrypto.


 English (US) ·