
 3 hours ago
18
3 hours ago
18

Advanced Micro Devices, Inc. stock closed at $500.94 on July 16, hovering just above its daily lower Bollinger Band. The stock sits at a pivotal technical juncture where short-term momentum has deteriorated, yet the long-term uptrend remains structurally intact. The near-term bias is neutral to cautiously bearish.
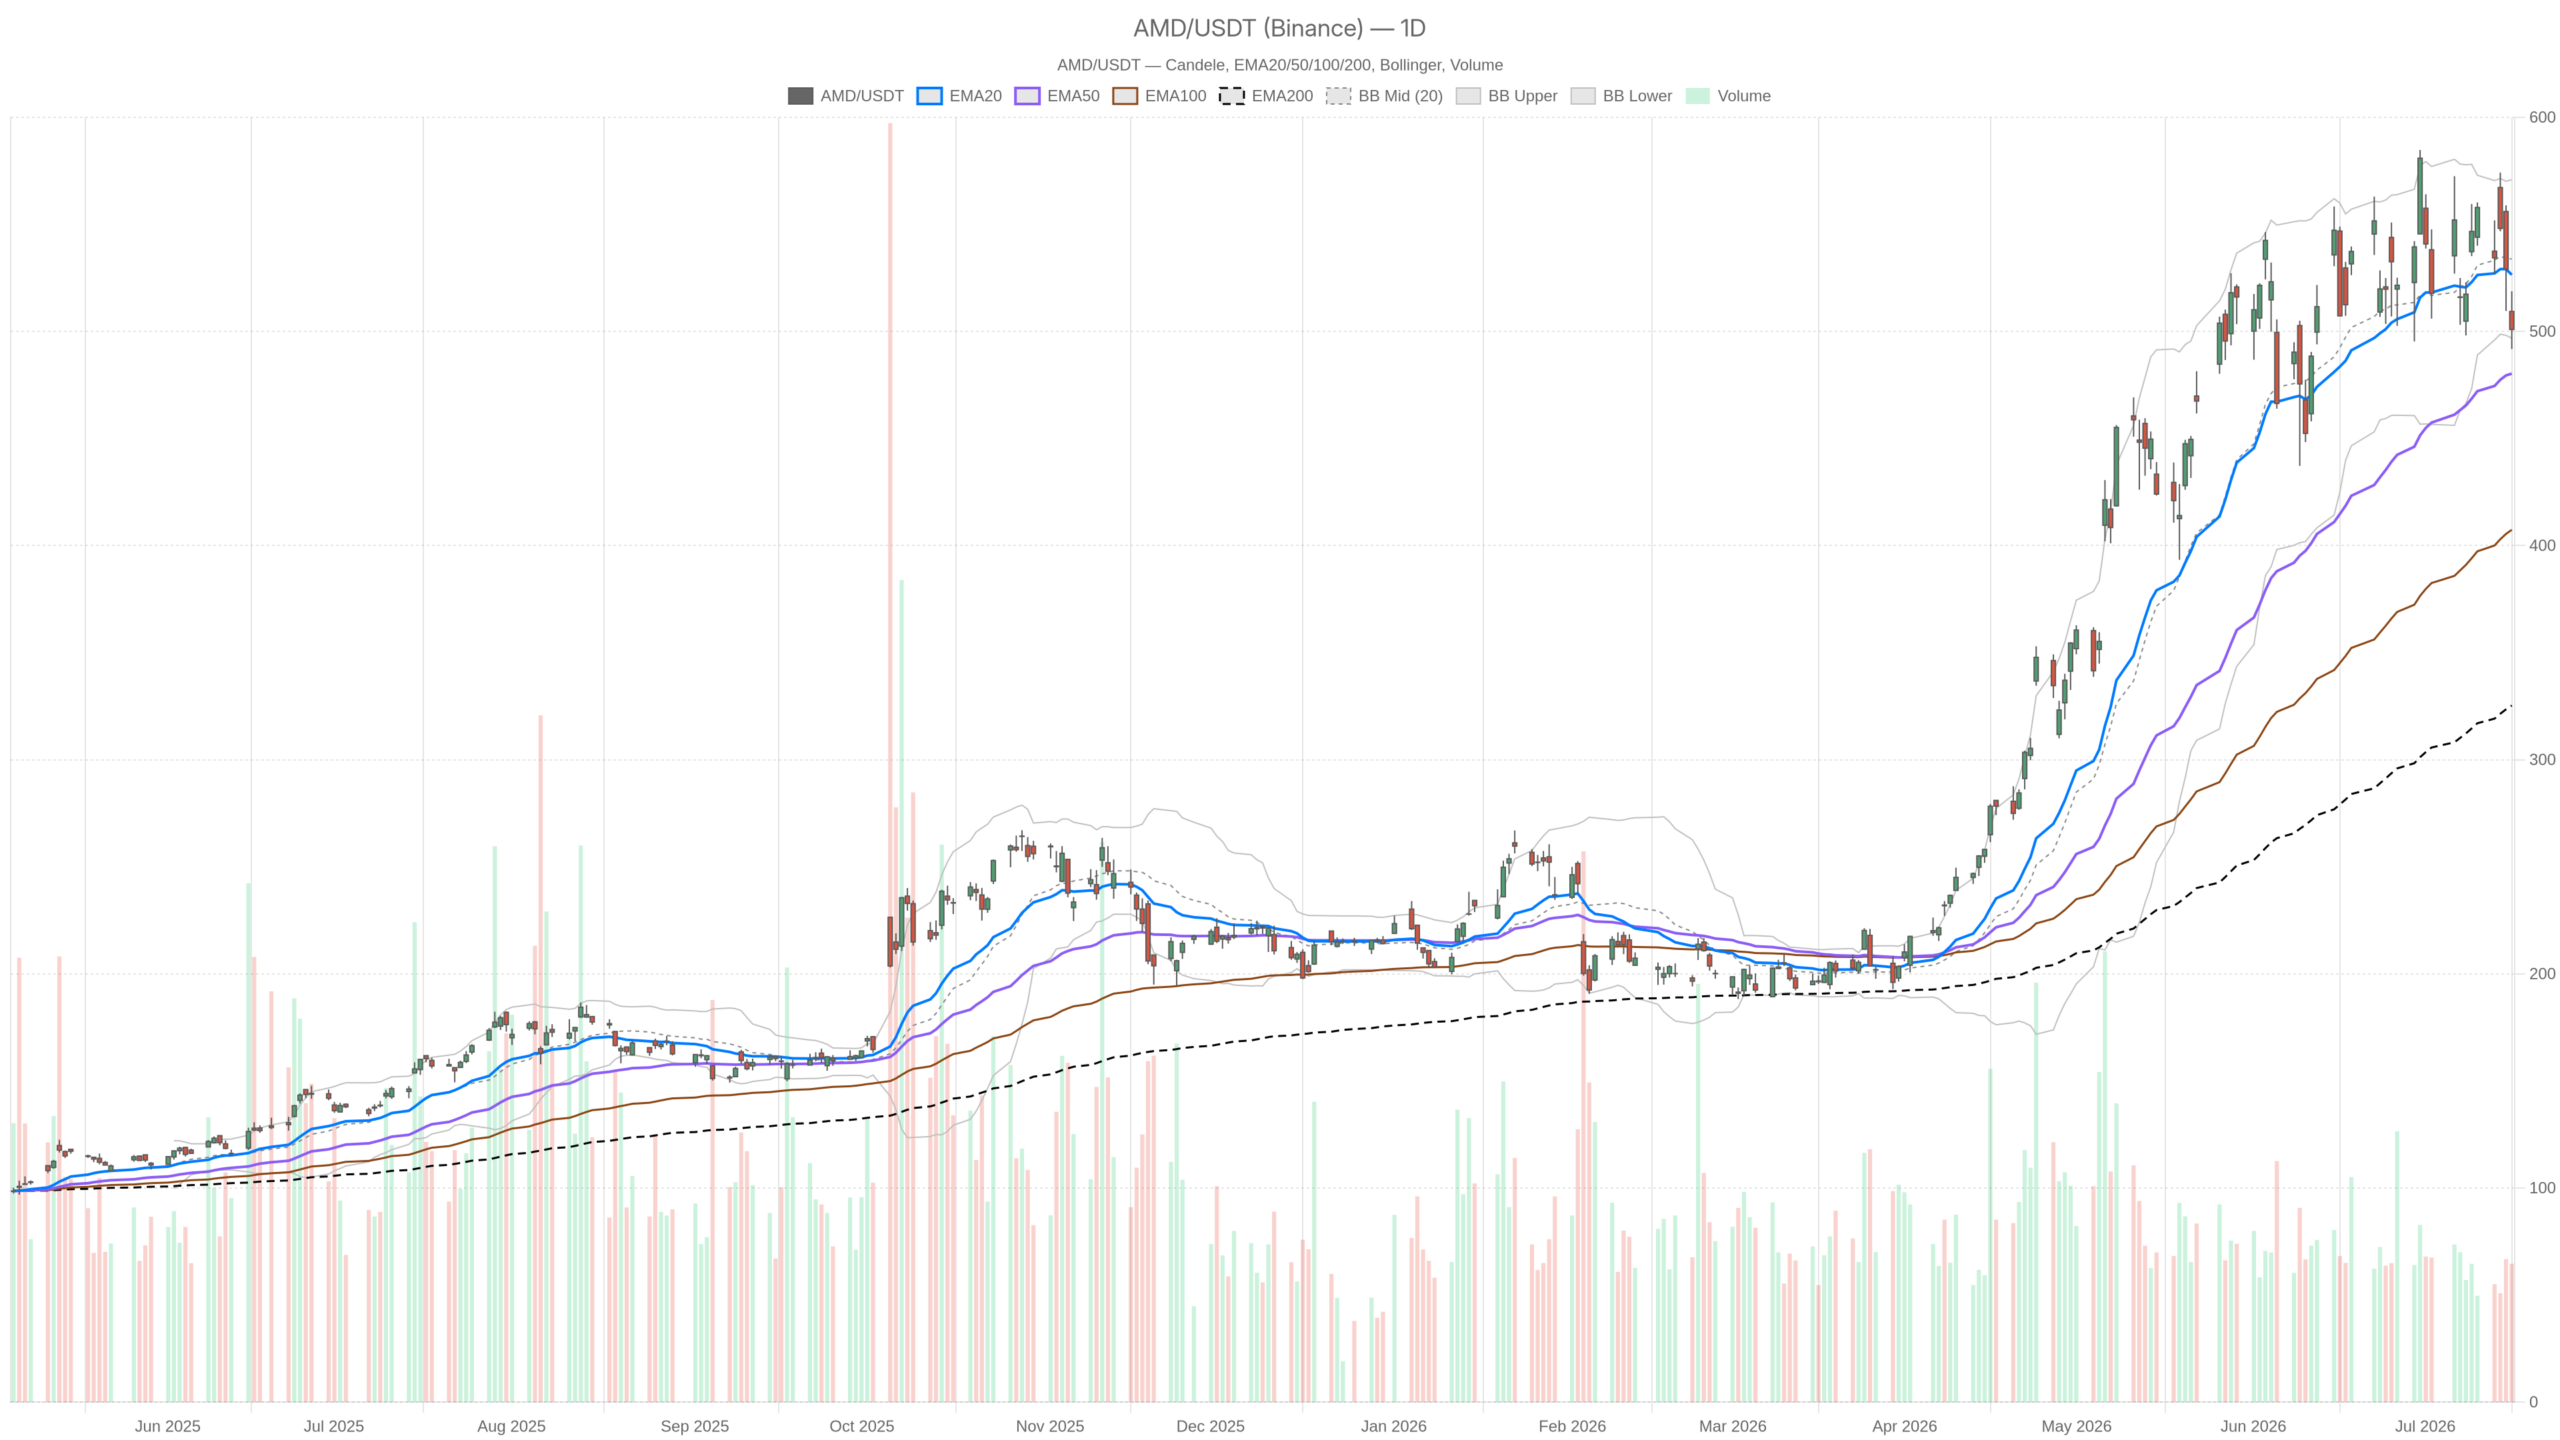 AMD — daily chart with candlesticks, EMA20/EMA50 and volume.
Key takeaways
- AMD closed at $500.94 on July 16, sitting just above its daily lower Bollinger Band at $496.83.
- The daily MACD histogram is negative at -6.3, signaling fading — not collapsing — momentum.
- Hourly EMAs are fully inverted, with price below the EMA20, EMA50, and EMA200.
- The daily ATR of $39.57 reflects elevated volatility, with a July 16 intraday swing of $26.94.
- The $496–$504 zone is the critical battleground for determining the next directional move.
Daily Structure: Strength Below the Surface, But Momentum Has Stalled
The daily chart confirms AMD’s long-term uptrend remains intact, but short-term momentum has clearly deteriorated. AMD trades well above its EMA200 at $325.31, confirming structural strength. However, the stock has slipped beneath its EMA20 at $526.45. Price closing at $500.94 — under the EMA20 — signals that short-to-medium-term momentum has weakened.
Meanwhile, MACD readings reinforce the concern. The MACD line sits at $10.98 while the signal line is at $17.28. This produces a negative histogram of -6.3. The line has not crossed below zero, but the divergence from the signal is widening. This is not a collapsing trend — it is a fading one.
At the same time, the daily RSI at 46.92 reflects exactly this ambiguity. It has retreated from overbought territory without entering oversold levels. There is no capitulation here, but there is also no buying conviction. The indicator sits in a no-man’s-land that typically precedes either a mean-reversion bounce or continued grinding lower.
Notably, Bollinger Band positioning adds further nuance. The daily close at $500.94 is flirting with the lower band at $496.83. The midline stands at $533.85. A sustained break below the lower band would be a bearish signal. At the same time, proximity to that band often acts as a short-term elastic floor.
AMD Stock Price Under Pressure: The Hourly Timeframe Weakens the Case
In contrast, the hourly chart paints a more bearish picture, with Advanced Micro Devices, Inc. stock trading below all three key exponential moving averages. Price at $500.93 sits well below the hourly EMA20 at $519.12, the EMA50 at $529.78, and the EMA200 at $521.60. This full EMA stack inversion is a meaningful red flag for intraday bulls. It confirms that recent selling has been sustained, not merely a single-session event.
At the same time, the hourly RSI at 34.36 is approaching oversold territory. That level alone does not signal an automatic reversal. However, it does suggest sellers have exerted significant pressure. A bounce from here would be technically credible, even if the broader setup remains weak.
On the hourly MACD, the line at -11.79 runs well below the signal at -8.52. The histogram sits at -3.27. Selling momentum on the hourly chart is not decelerating meaningfully. Notably, the hourly is clearly in negative trend territory, while the daily line remains positive. This divergence between timeframes is the central tension in the AMD setup right now.
Additionally, the hourly pivot structure shows the price hovering near its pivot point of $499.25. R1 at $503.41 acts as immediate resistance. S1 at $496.77 serves as the next support floor. A break below $496.77 on an hourly close would likely accelerate selling pressure toward the daily support cluster near $488–$491.
15-Minute Execution Context: A Brief Lift, But Regime Remains Bearish
The 15-minute chart shows tentative stabilization within a still-bearish regime, not a genuine reversal. The 15-minute timeframe is registered as a bearish regime, though some early stabilization is visible. The 15m MACD histogram has turned marginally positive at $1.24. This represents a minor uptick after a sustained negative run. The RSI on this timeframe sits at 44.48, suggesting neither extreme. Together, these readings hint at short-term stabilization rather than a genuine directional shift.
Notably, price on the 15m chart sits above its EMA20 at $501.18. However, it remains well below the EMA50 at $512.73 and the EMA200 at $532.78. Any near-term bounce attempt faces a layered overhead of declining exponential averages. The 15m ATR of $4.07 points to contained intraday volatility. Moves are unlikely to be explosive without a catalyst.
Volatility and Sentiment: High Daily ATR, Strong Macro Narrative
Advanced Micro Devices, Inc. stock carries elevated daily volatility, while analyst sentiment provides a supportive long-term backdrop. The daily ATR of $39.57 reflects a meaningfully volatile stock. AMD’s daily range on July 16 ran from $491.80 to $518.74 — a $26.94 swing. That kind of intraday range highlights the execution risk on both sides. Tight stop placement is challenging in this environment.
On the sentiment front, recent coverage frames AMD positively. The stock’s market cap has reportedly more than doubled this year to around $840 billion. This has fueled speculation about a path toward the $1 trillion club alongside Micron and Broadcom. Analysts increasingly position AMD as a key AI inference play, with demand drivers described as fundamentally strong. Recent pullbacks have been attributed to sector-wide sentiment rather than AMD-specific deterioration. That narrative provides a meaningful floor under long-term conviction, even if short-term price action is messy.
Bullish Scenario: What Would Validate Recovery
A bullish recovery requires AMD to hold above the daily Bollinger lower band at $496.83 and reclaim the $503–$515 zone. The bullish case rests on two key technical milestones. First, AMD must maintain support above $496.83 — the daily lower Bollinger Band. A daily close back above the EMA20 at $526.45 would meaningfully shift momentum toward the upside. If the hourly RSI bounces from the 34–35 area and the MACD histogram begins narrowing, that would provide intraday confirmation.
Overall, the underlying thesis supports the bull case over a multi-week horizon. Strong AI demand, a fundamentally intact business, and a structurally bullish long-term trend — defined by the EMA200 well below price — all favor recovery. However, near-term price action remains fragile and requires confirmation.
Bearish Scenario: What Would Invalidate the Bull Case
A daily close below $496.83 would invalidate the bullish thesis and open the door to a deeper correction. A breakdown below the daily lower Bollinger Band would shift focus to pivot support S1 at $488.91. Below that, the $480 area — where the EMA50 resides — becomes the critical test. A failure there would signal that the correction has more legs than initially expected.
The hourly EMA stack is already fully inverted, reinforcing bearish momentum on shorter timeframes. Sector-wide chip selling pressure, cited in recent news flow, could amplify any breakdown. In this scenario, the neutral-to-bearish daily bias would shift decisively bearish. Advanced Micro Devices, Inc. stock would then face a more prolonged corrective phase.
Positioning and Outlook
Advanced Micro Devices, Inc. stock is in a technically fragile but not structurally broken position, with the $496–$504 range as the decisive battleground. The daily regime is neutral, the hourly leans bearish, and the 15-minute offers only tentative stabilization. How AMD responds to this zone over the next sessions will define the next directional move. Either this is a buyable pullback within a broader uptrend — or the beginning of a deeper corrective phase.
Given the elevated ATR and cross-timeframe conflict, forcing a directional trade here carries meaningful risk. Patience near key levels is warranted. The long-term structural uptrend remains intact, but short-term momentum has not yet signaled a recovery.
FAQ
What is the key support level for Advanced Micro Devices, Inc. stock right now?
The immediate support is the daily lower Bollinger Band at $496.83. Below that, pivot support S1 sits at $488.91, and the EMA50 near $480 represents the next critical floor.
Is AMD’s long-term uptrend still intact?
Yes. AMD trades well above its EMA200 at $325.31, confirming the long-term structural uptrend remains firmly in place despite short-term momentum deterioration.
What would signal a bullish recovery for AMD stock?
A daily close back above the EMA20 at $526.45 would meaningfully shift momentum. Before that, reclaiming the $503–$515 zone and holding above $496.83 are necessary first steps.
Why is the hourly chart more bearish than the daily?
The hourly EMA stack is fully inverted — price sits below the EMA20, EMA50, and EMA200. Meanwhile, the hourly MACD is deeply negative, while the daily MACD line remains positive. This timeframe divergence is the central tension in AMD’s current setup.
Disclaimer: This article is for informational purposes only and does not constitute financial advice, an investment recommendation, or a solicitation to buy or sell any financial instrument or cryptocurrency. The analysis provided is not indicative of future results. Investing in crypto assets and financial markets carries a high risk of capital loss. Always do your own research (DYOR) and consult a qualified financial advisor before making any decision.
Article produced with the assistance of artificial intelligence and reviewed by the editorial team.









 English (US) ·