
 1 month ago
54
1 month ago
54

As of August 2, 2026, Aerodrome Finance crypto trades at $0.39, resting directly on its daily S1 support after persistent selling pushed every major moving average above current price. Sellers remain in control, and buyers have yet to step in with conviction.
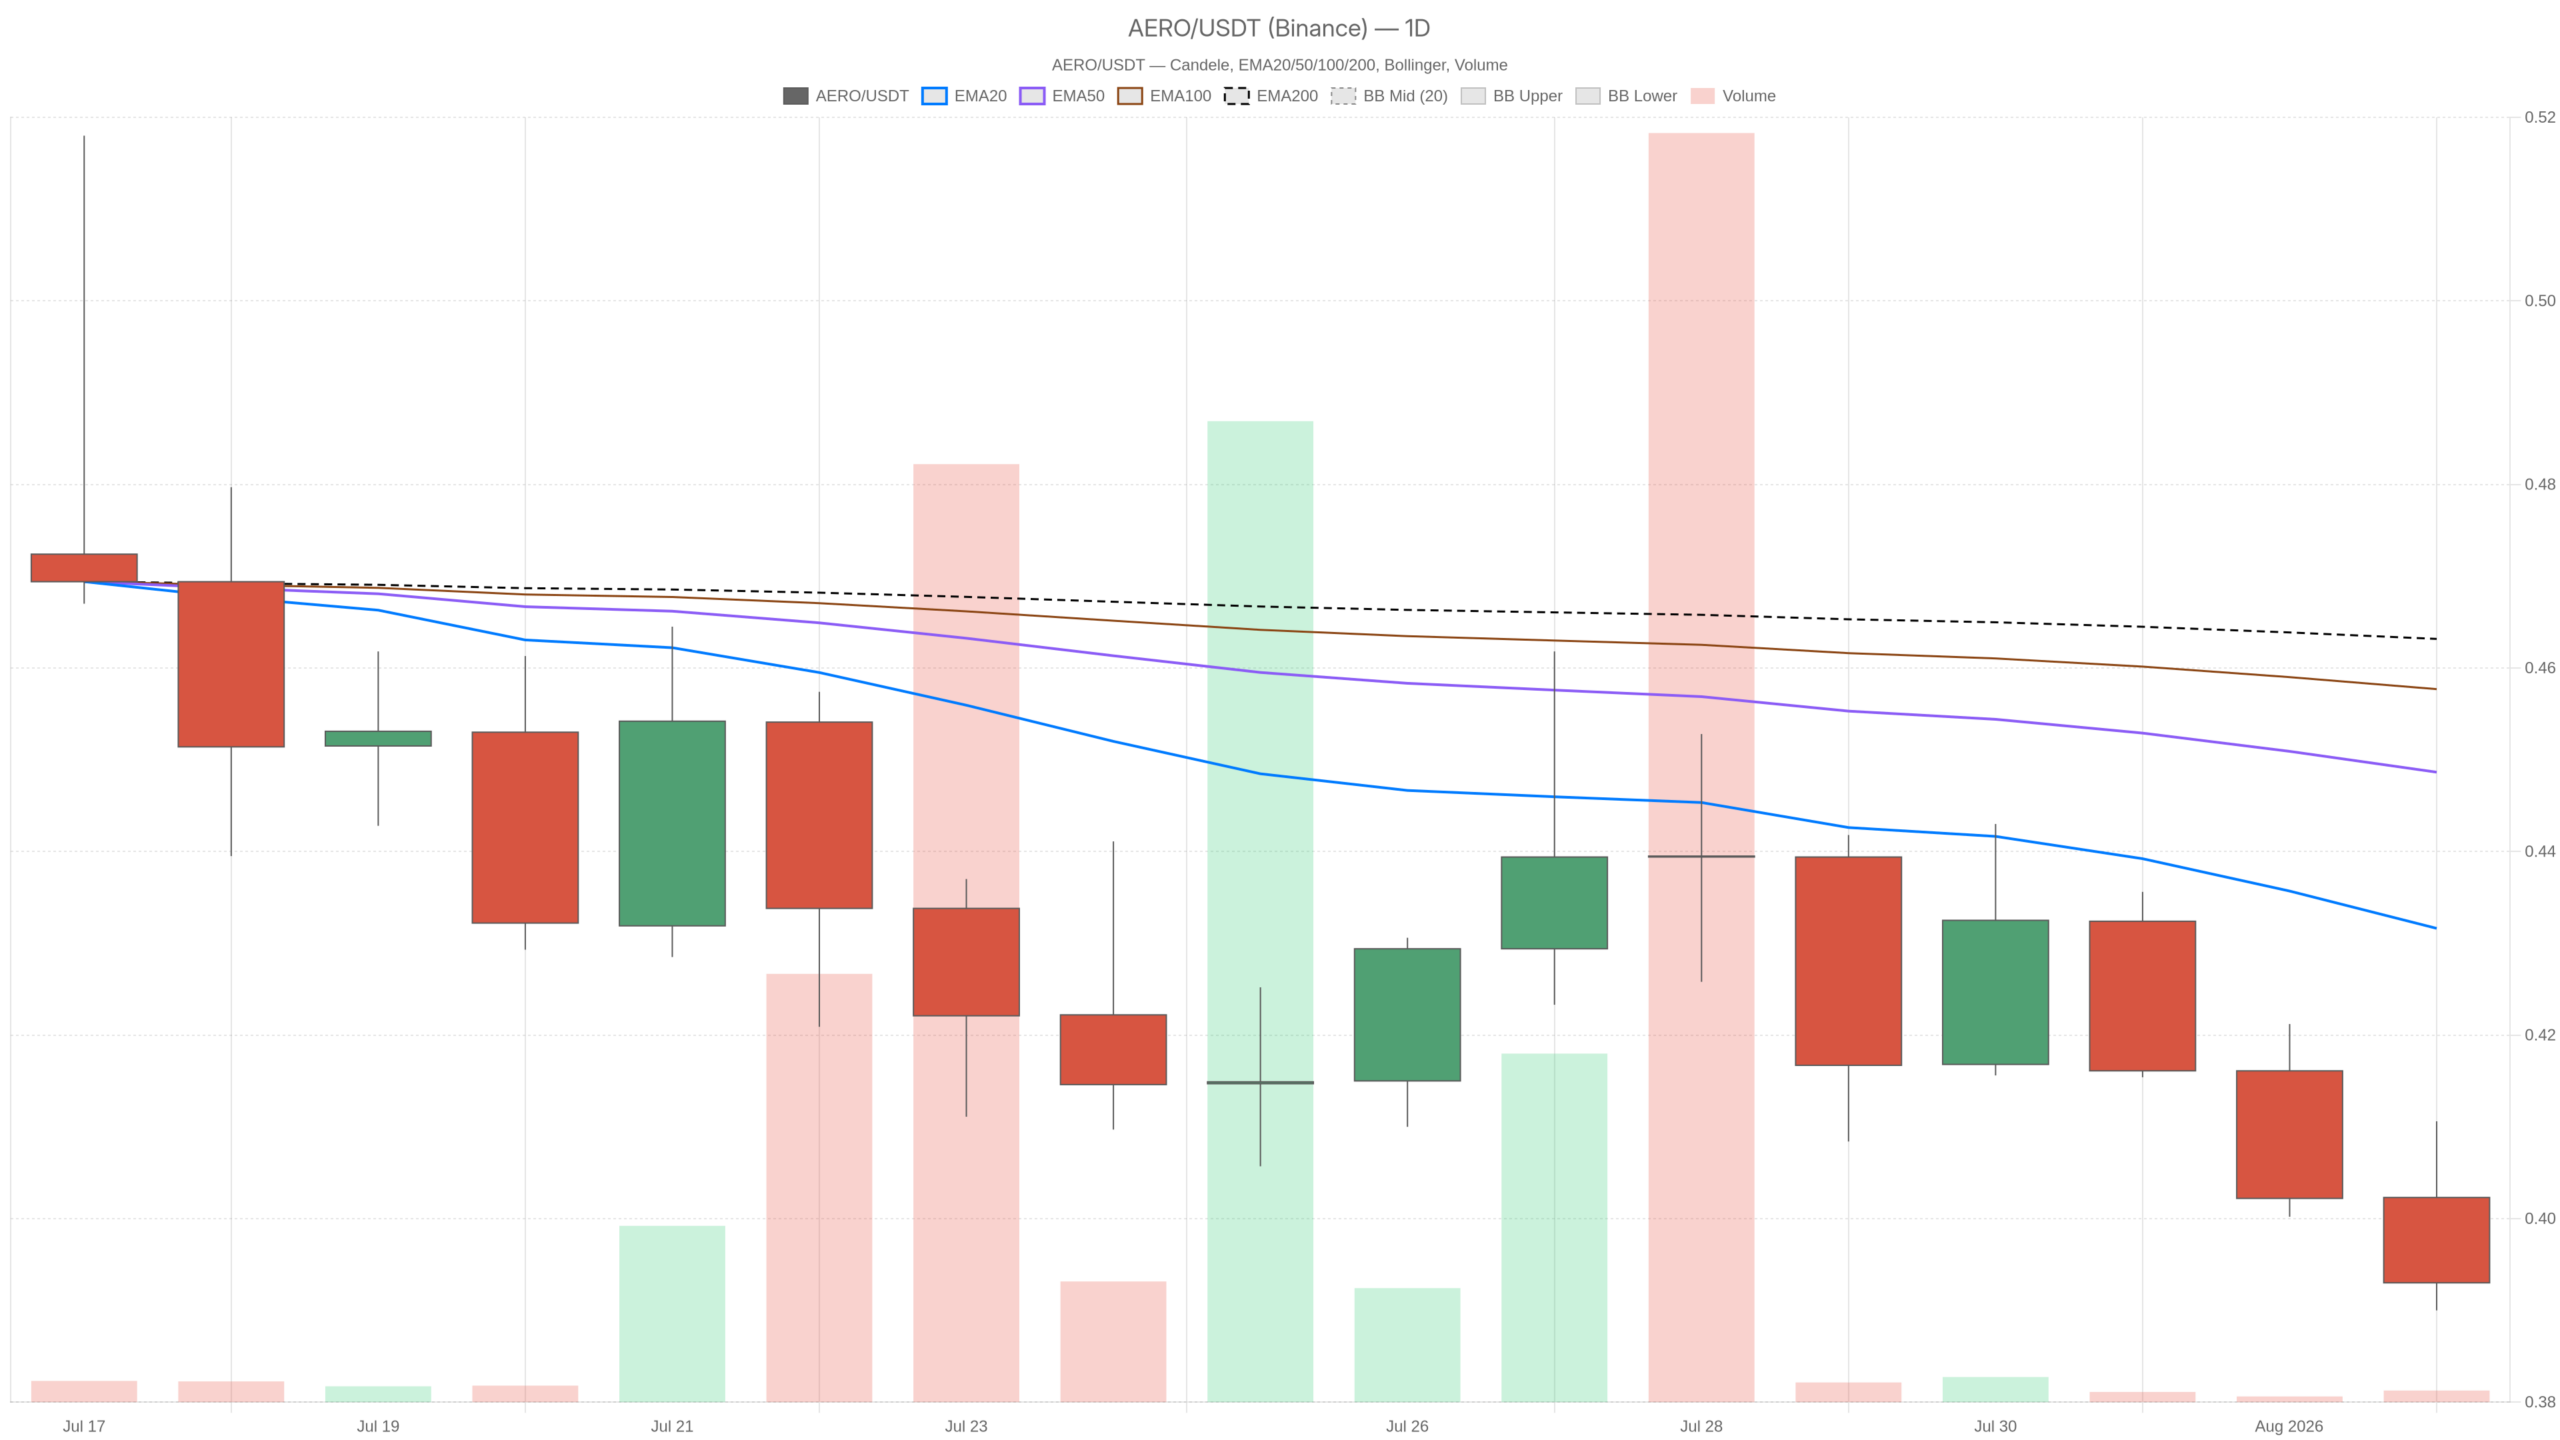 AERO/USDT — daily chart with candlesticks, EMA20/EMA50 and volume.
Key takeaways
- AERO trades at $0.39, resting on daily S1 support with every major EMA stacked above current price.
- Daily RSI14 at 28.3 signals oversold conditions, though this alone does not constitute a buy signal in a downtrend.
- The Fear & Greed Index sits at 27, while Bitcoin dominance remains elevated at 56.28%, draining risk appetite from mid-cap DeFi tokens.
- Total crypto market capitalization hovers near $2.26 trillion, up a modest 0.83% over the past 24 hours.
- A decisive break below $0.39 or above $0.41 will likely determine the next directional move, given compressed volatility across timeframes.
Daily Chart: The Trend Is Bearish, and RSI Confirms It
The daily chart shows a clear bearish trend with AERO trading below all three major moving averages. Price closed at $0.39 against an EMA20 of $0.43, EMA50 of $0.45, and EMA200 of $0.46. With the shorter EMAs stacked beneath the longer ones, this is about as clean a bearish alignment as one can find. There is no ambiguity here — this is a downtrend, not a pullback within an uptrend.
RSI14 on the daily sits at 28.3, edging into oversold territory. That does not mean a bounce is guaranteed, but it does mean sellers have pushed price far enough that momentum is stretched. In a genuine downtrend, oversold readings can persist for some time before any real relief appears — so this serves as a caution flag for late shorts rather than a standalone buy signal.
MACD on the daily is essentially flat-negative, with the line at -0.01 and the signal also at -0.01, producing a near-zero histogram. That reflects a market where downside momentum has stopped accelerating but has not reversed either. Moreover, the daily ATR14 of $0.03 mirrors the reduced volatility that typically accompanies this kind of directional pause after a decline.
The daily pivot structure adds further context: pivot point at $0.40, resistance at $0.41, support at $0.39. Price sitting right at S1 means this level is the immediate battleground. A daily close below $0.39 opens the door to further downside; however, reclaiming $0.40 would be the first sign that the bears are losing their grip.
1H Timeframe: Confirmation, Not Contradiction
The hourly chart confirms the bearish bias without offering any contradiction. Price at $0.39 remains below the EMA20 of $0.40, EMA50 of $0.41, and EMA200 of $0.42, and the regime is labeled bearish here as well. RSI14 has ticked up slightly to 34.3, still well below the neutral 50 line, suggesting short-term momentum is trying to stabilize but has not flipped positive.
Bollinger Bands on the 1H are notably tight — mid at $0.40, upper at $0.41, lower at $0.39 — which signals that volatility has compressed. Compression like this after a decline often precedes an expansion move. That said, the direction of that move is unclear from the bands alone; it confirms a decision point is near, not which way it breaks.
MACD on the hourly is flat at zero across line, signal, and histogram — essentially no momentum in either direction right now. Combined with the hourly pivot cluster, where pp, r1, and s1 all bunch near $0.39, this is a market in a holding pattern, waiting for a catalyst.
15-Minute View: Execution Context Only
The 15-minute chart offers execution context only, with no directional signal of its own. AERO trades at $0.39, right between its EMA20 of $0.39 and EMA50 of $0.40, with EMA200 at $0.41. RSI14 reads 42.71 — closer to neutral than the higher timeframes, which is typical noise at this granularity and should not be read as a trend signal.
The Bollinger Bands are extremely narrow, with the mid at $0.39, upper at $0.40, and lower at $0.39, again pointing to compressed short-term volatility. This timeframe is useful only for timing entries or exits around levels defined by the daily and hourly charts — it carries no directional weight of its own.
Bullish Scenario: What Would Need to Change
For a bullish reversal to take shape, AERO must reclaim the daily pivot at $0.40 and hold above it, ideally pushing through the $0.41 resistance — which lines up with both the daily R1 and the hourly Bollinger upper band. A daily RSI moving back above 40 alongside that reclaim would suggest the oversold bounce has legs rather than fading immediately. However, until EMA20 on the daily is retaken, this remains a countertrend move rather than a trend change — the burden of proof is on the bulls.
Bearish Scenario: What Keeps the Pressure On
The bearish path is the more straightforward one. A daily close below the $0.39 support would confirm sellers are still in control, especially with EMAs on every timeframe stacked bearishly overhead. If RSI on the daily pushes deeper below 28 without stabilizing, that signals momentum sellers remain active rather than exhausted. In this scenario, the flat MACD histogram could simply be the pause before another leg down, particularly if broader market conditions — reflected in that Fear & Greed reading of 27 — stay defensive.
Positioning and Risk
Right now, Aerodrome Finance crypto sits at a genuine inflection point on the daily chart, but the surrounding signals do not scream urgency in either direction. The daily trend is bearish and unambiguous. The hourly chart confirms that bias without adding new information. The 15-minute chart is just noise for execution timing.
What stands out is the volatility compression across both the 1H and 15m Bollinger Bands — markets do not stay this quiet for long, and whichever way AERO breaks from this $0.39–$0.41 range is likely to move with some force given the current ATR readings.
With Bitcoin dominance elevated above 56% and broader sentiment reading Fear, the macro backdrop is not doing Aerodrome any favors. That does not mean a bounce is impossible — oversold daily RSI readings can and do resolve upward. However, anyone watching this chart should treat the $0.39 support and the $0.40–$0.41 resistance zone as the levels that actually matter, rather than getting distracted by short-term noise on lower timeframes. Volatility compression plus a stretched RSI is a combination that tends to resolve with a decisive move, and traders should size their expectations around that uncertainty rather than assume either outcome is settled.
FAQ
What is the current price of AERO?
As of August 2, 2026, AERO is trading at $0.39, sitting directly on its daily S1 support level after a prolonged period of selling pressure. Every major moving average — EMA20 at $0.43, EMA50 at $0.45, and EMA200 at $0.46 — now sits above the current price.
Is AERO in oversold territory?
The daily RSI14 reads 28.3, which places it in oversold territory. However, in a genuine downtrend, oversold readings can persist for some time before any meaningful bounce materializes. The reading should be treated as a warning for late shorts rather than an automatic buy signal.
What are the key support and resistance levels for AERO?
The critical support sits at $0.39, which aligns with the daily S1 pivot. Resistance stands at $0.40–$0.41, corresponding to the daily pivot point and R1 level respectively. A daily close below $0.39 would confirm continued bearish pressure, while reclaiming $0.40 would signal a potential shift in momentum.
How does broader market sentiment affect AERO?
With the Fear & Greed Index at 27 and Bitcoin dominance at 56.28%, capital tends to flow toward safer, larger-cap assets rather than mid-cap DeFi tokens like AERO. This macro backdrop adds headwinds to any recovery attempt and helps explain why the token has underperformed even as total crypto market capitalization posted a modest gain.
Disclaimer: This article is for informational purposes only and does not constitute financial advice, an investment recommendation, or a solicitation to buy or sell any financial instrument or cryptocurrency. The analysis provided is not indicative of future results. Investing in crypto assets and financial markets carries a high risk of capital loss. Always do your own research (DYOR) and consult a qualified financial advisor before making any decision.
Article produced with the assistance of artificial intelligence and reviewed by the editorial team.






 English (US) ·