
 1 month ago
64
1 month ago
64

Alibaba stock surged up to 9% intraday after unveiling Qwen3.8-Max, a 2.4 trillion-parameter AI model. Yet the daily chart flags overbought risk near key resistance, creating tension between the bullish catalyst and an incomplete trend structure.
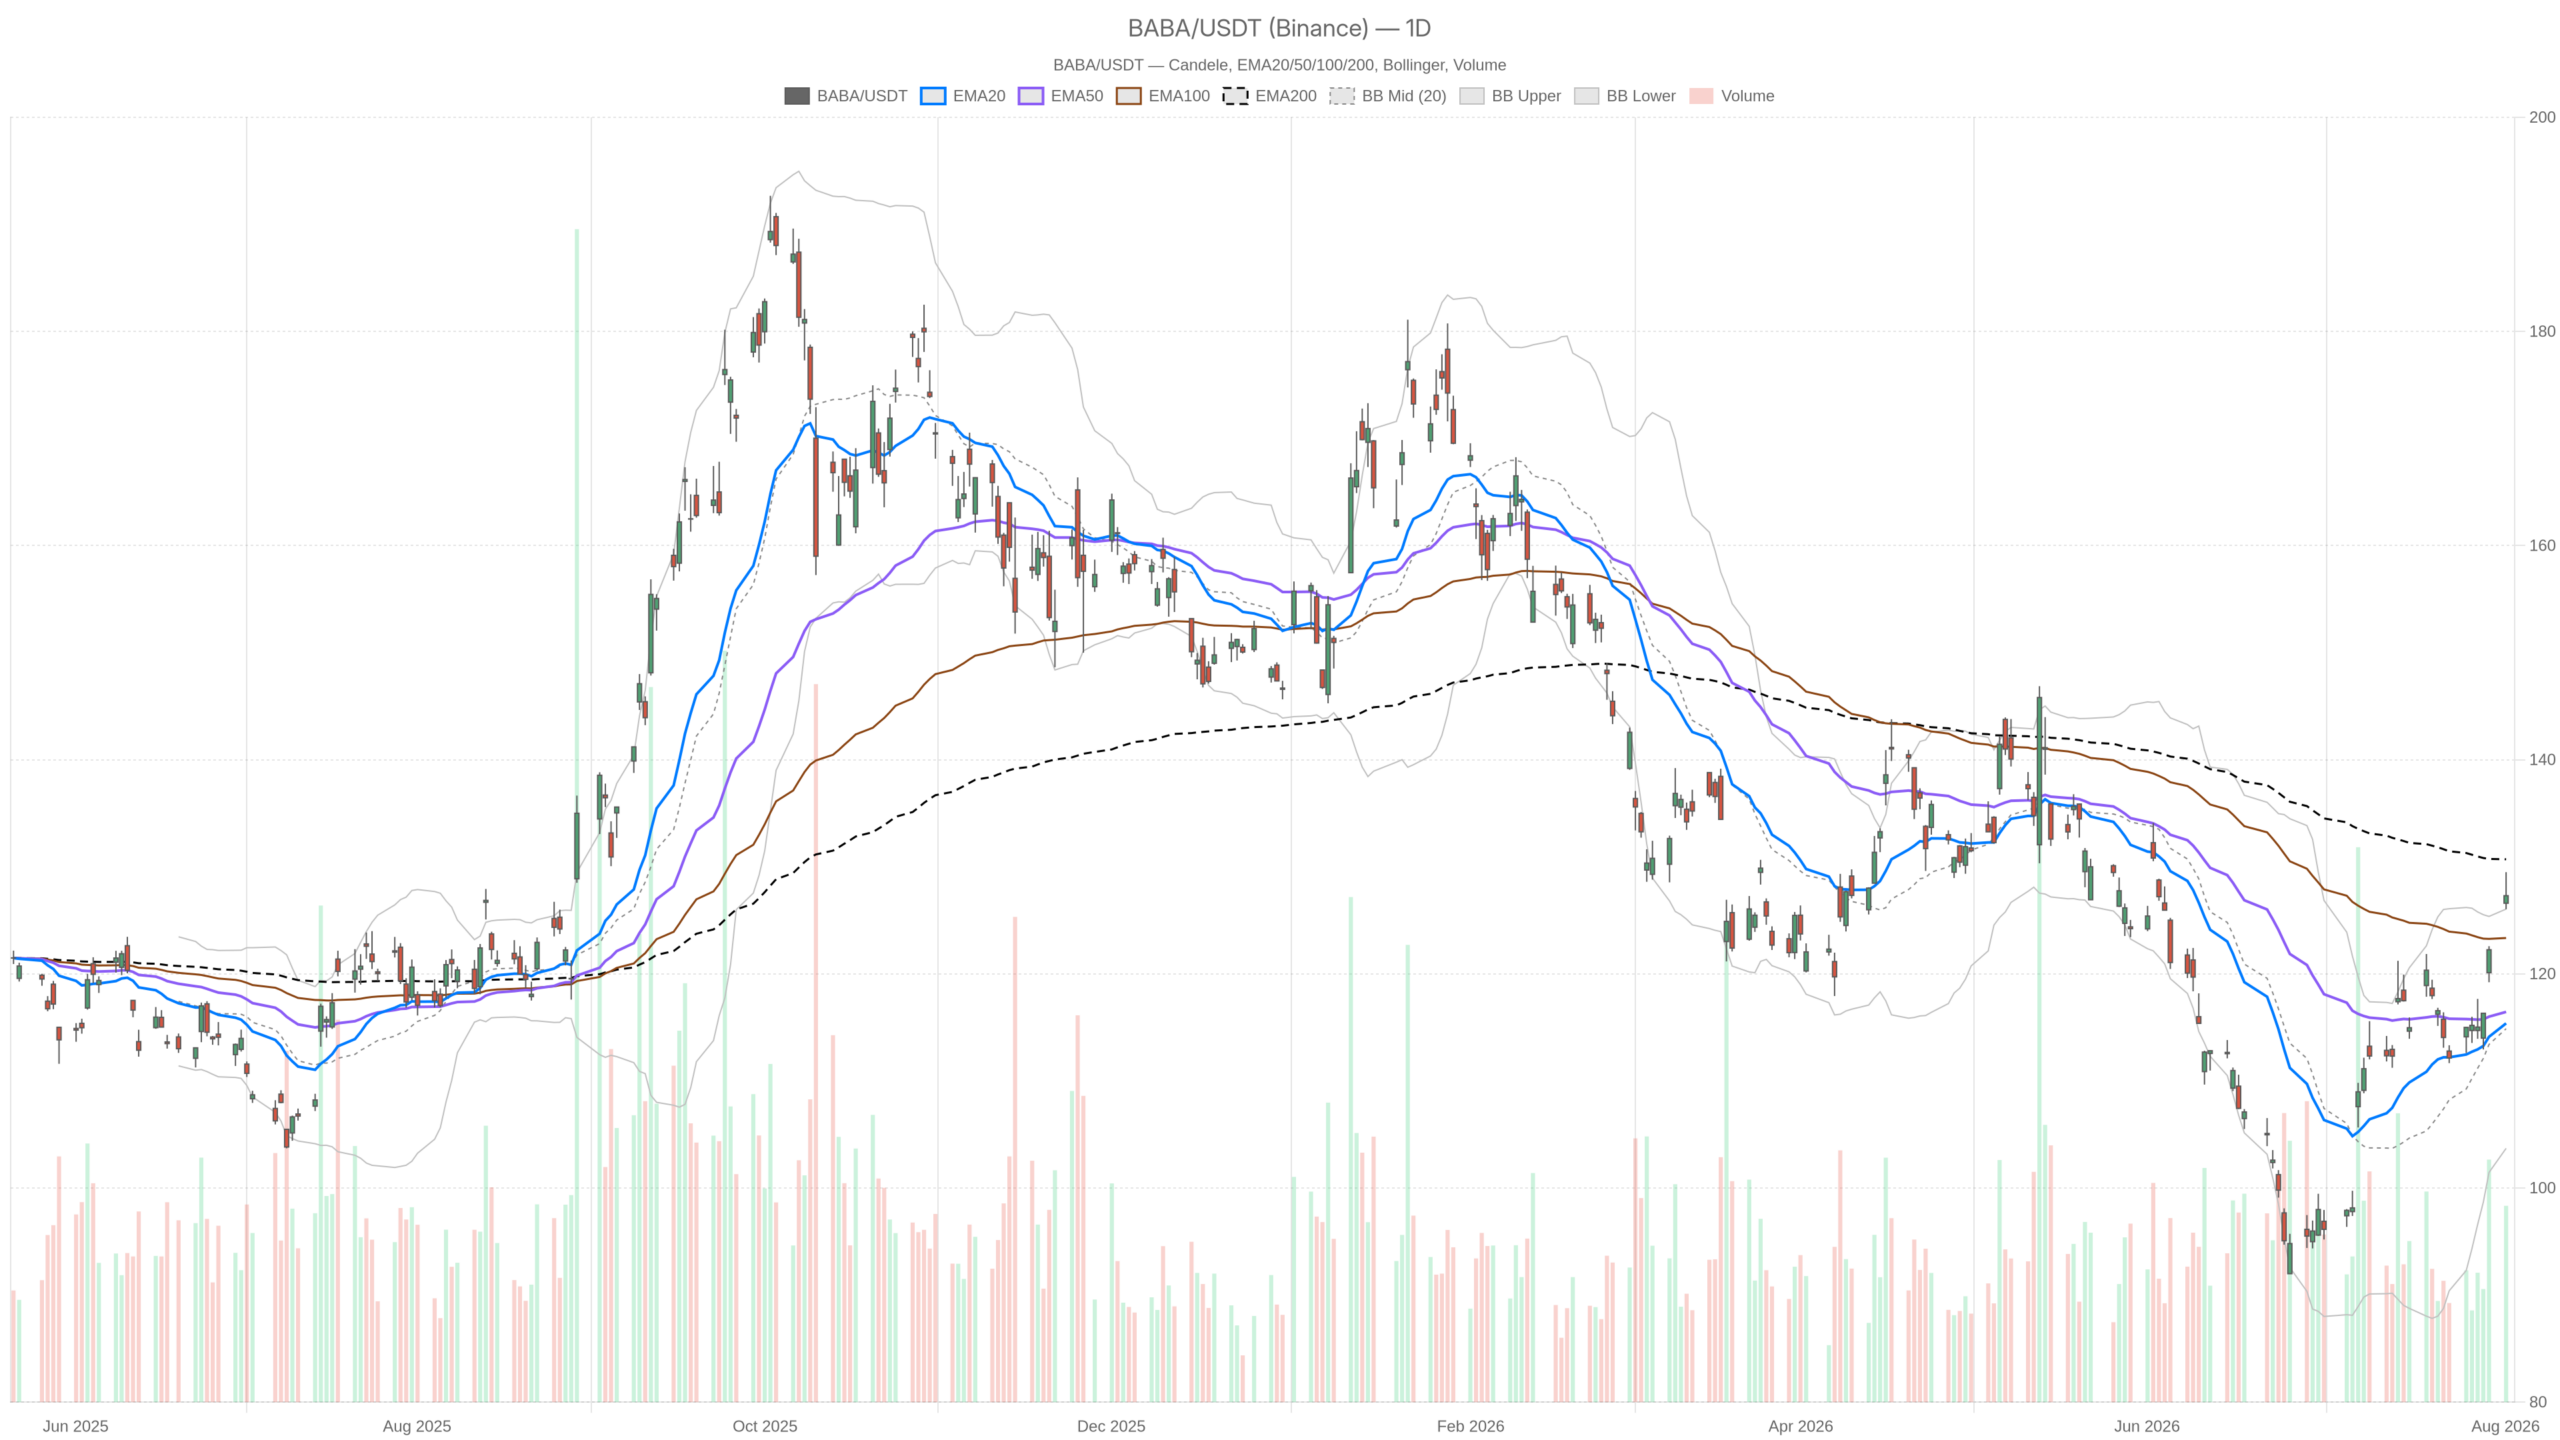 BABA — daily chart with candlesticks, EMA20/EMA50 and volume.
Key takeaways
- BABA closed at 127.30, above the 20-day and 50-day EMAs but still below the 200-day EMA at 130.70.
- Daily RSI14 at 69.41 flirts with overbought territory while hourly RSI14 sits firmly overbought at 76.96.
- Price closed above the daily upper Bollinger Band at 126.05, signaling a breakout attempt but also raising mean-reversion risk.
- The hourly regime is outright bullish; the daily trend structure remains neutral.
- The 200-day EMA at 130.70 is the pivotal structural line defining the trend.
Daily Timeframe: Momentum Strong, But Trend Structure Incomplete
The daily chart for Alibaba stock shows strong momentum but an incomplete trend structure. Price remains below the 200-day EMA at 130.70, keeping the regime neutral despite the sharp rally.
Momentum Indicators Flash Constructive but Stretched
BABA closed the daily session at 127.30, trading between 126.04 and 129.50. The candle sits above both the 20-day EMA at 115.38 and the 50-day EMA at 116.45. This confirms that the market has recently accelerated to the upside. However, the longer-term trend has not yet flipped bullish.
Meanwhile, daily RSI14 sits at 69.41, close to overbought territory but not yet extreme. MACD is constructive. The MACD line at 2.61 sits above the signal at 1.23, and the positive histogram of 1.37 confirms active upside momentum.
Bollinger Breakout and Key Levels to Watch
The Bollinger setup offers the most telling evidence. Price at 127.30 is trading above the upper band at 126.05. A close outside the upper band after a strong catalyst typically signals a genuine breakout attempt. At the same time, it raises the odds of a near-term mean-reversion move back toward the band.
Daily ATR14 stands at 4.23, reflecting clear volatility expansion following the AI news.
Pivot levels for the session place the pivot point at 127.61. Resistance sits at R1 at 129.19 and support at S1 at 125.73. Notably, despite bullish momentum readings, the system classifies the daily regime as neutral. This classification aligns with price remaining under the 200-day EMA, meaning the structural trend has not fully turned.
1H Timeframe: Bullish Regime Confirmed, Overbought Warnings Intact
The hourly chart tells a cleaner bullish story with the system labeling the 1H regime outright bullish. This contrasts with the daily chart’s neutral classification. However, overbought RSI readings suggest the move is stretched.
EMA Stack Confirms Short-Term Uptrend
Price on the hourly closed at 127.25. It sits above the 20-EMA at 123.33, the 50-EMA at 119.52, and the 200-EMA at 114.93. This full stack alignment is a textbook short-term uptrend.
MACD remains positive. The MACD line at 3.24 sits above the signal at 2.78, though the histogram has narrowed to 0.46. This hints that the pace of the rally is slowing slightly, even as direction stays intact.
Overbought RSI and Tight Pivot Levels
Hourly RSI14 is at 76.96, firmly overbought. Overbought readings at this level often precede a pause or shallow pullback, even within an intact uptrend.
Hourly Bollinger Bands show price at 127.25 comfortably inside the range. The upper band sits at 132.13 and the lower at 112.20. Unlike the daily chart, there is no immediate band-breakout stress here.
ATR14 on the hourly is 1.60. Pivot levels are tight. The pivot sits at 127.53, with R1 at 127.84 and S1 at 126.94. Price is essentially pinned between pivot and support.
15-Minute Timeframe: Consolidation After the Rally Spike
Meanwhile, the 15-minute chart shows short-term momentum cooling after the initial spike. This provides useful execution context without undermining the broader bullish picture.
Price closed at 127.25, just under its 20-EMA of 127.41, while remaining above the 50-EMA at 125.02 and the 200-EMA at 119.33. RSI14 has cooled to a neutral 54.21. MACD has flipped slightly negative, with the line at 0.71 below the signal at 1.03 and a histogram of -0.32. This signals short-term momentum easing after the rally.
Bollinger Bands show price sitting near the lower band at 127.12. The mid band is at 128.04 and the upper at 128.95. In other words, the short-term move has pulled back toward the lower edge of its recent range.
ATR14 here is just 0.36, indicating low-volatility consolidation rather than aggressive selling. Pivot levels are equally tight. The pivot sits at 127.49, with R1 at 127.76 and S1 at 126.98. Price is hovering around the pivot, effectively pausing before its next directional decision.
Bullish Scenario: Reclaiming the 200-Day EMA
The bullish case for Alibaba stock hinges on continuation of the AI-driven narrative combined with a decisive reclaim of the 200-day EMA at 130.70.
If daily price can hold above the upper Bollinger Band near 126.05 and push through daily R1 at 129.19, that would suggest real follow-through beyond a one-day news spike. A sustained move above 130.70 would flip the daily regime from neutral to convincingly bullish. This would align the daily trend with the already-bullish hourly picture.
In that scenario, the hourly uptrend would serve as the engine. It is supported by price staying above the 20/50/200 EMA stack. Meanwhile, the 15-minute chart would be watched for renewed MACD strength as confirmation of fresh buying interest.
Bearish Scenario: Overbought Signals and Mean-Reversion Risk
On the other hand, the bearish case centers on the overbought signals flagged across timeframes. Both daily RSI at 69.41 and hourly RSI at 76.96 leave room for a pullback.
Price is trading above the daily upper Bollinger Band, a condition that often resolves with a retracement back toward the band near 126.05. Should BABA fail to clear the 200-day EMA at 130.70, a rollover below the daily pivot at 127.61 would expose S1 at 125.73.
A deeper move toward the 20-day EMA at 115.38 becomes possible if the AI-driven enthusiasm fades. A break below hourly S1 at 126.94, paired with the already-negative 15-minute MACD histogram, would be an early warning. It would signal that the short-term rally is losing steam and a broader mean-reversion move is underway.
FAQ
What is driving Alibaba stock higher?
Alibaba stock surged after the company unveiled Qwen3.8-Max, a 2.4 trillion-parameter open-weight AI model designed to match leading global systems. The news pushed BABA up as much as 9% intraday.
Is Alibaba stock overbought right now?
The daily RSI14 at 69.41 is near overbought but not extreme. However, the hourly RSI14 at 76.96 is firmly overbought, suggesting the short-term rally is stretched and a pause or shallow pullback is possible.
What is the key resistance level for Alibaba stock?
The 200-day EMA at 130.70 is the pivotal structural resistance. A sustained break above this level would flip the daily trend from neutral to bullish and confirm the breakout attempt.
What are the main downside risks for BABA?
Price trading above the daily upper Bollinger Band raises mean-reversion risk. A failure to clear the 200-day EMA could trigger a pullback toward daily S1 at 125.73 and potentially the 20-day EMA at 115.38 if AI-driven enthusiasm fades.
Disclaimer: This article is for informational purposes only and does not constitute financial advice, an investment recommendation, or a solicitation to buy or sell any financial instrument or cryptocurrency. The analysis provided is not indicative of future results. Investing in crypto assets and financial markets carries a high risk of capital loss. Always do your own research (DYOR) and consult a qualified financial advisor before making any decision.
Article produced with the assistance of artificial intelligence and reviewed by the editorial team.





 English (US) ·