Aug 15, 2025 at 11:58 // Price
The price of Binance Coin (BNB) has continued to recover above the moving average lines after retreating above the low of $729.
BNB long-term price forecast: bullish
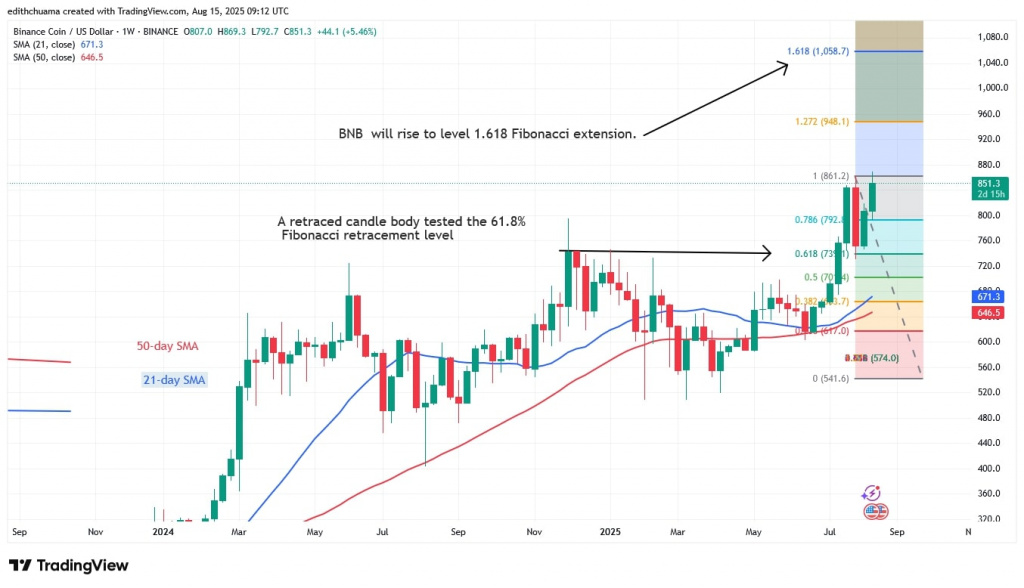
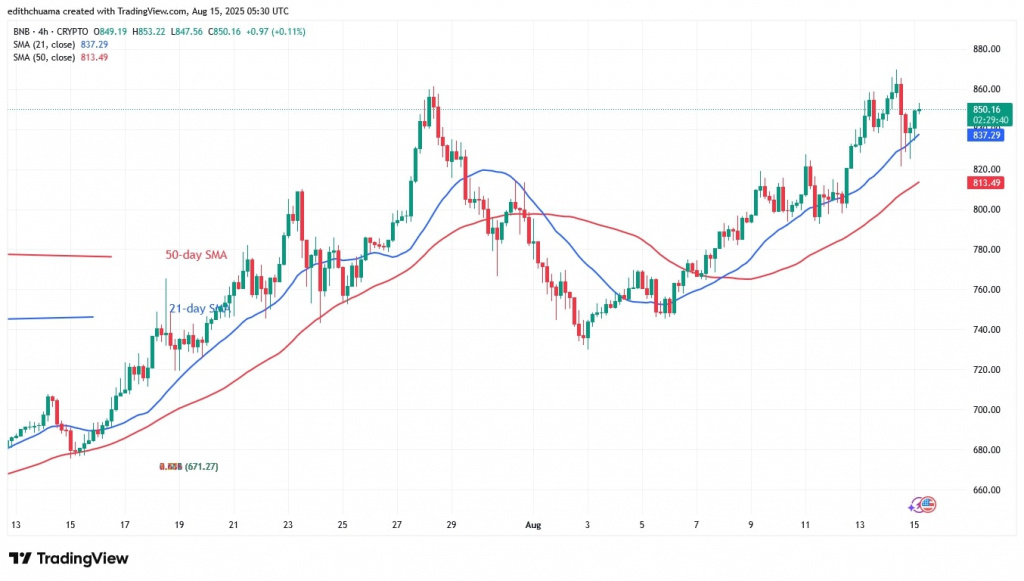
The cryptocurrency had risen to a high of $860 but was beaten back twice. The altcoin is oscillating in a small range below $860 in anticipation of an uptrend. If buyers break through the $860 mark, BNB is likely to rise to a high of $1,100.
On July 28, as reported previously by Coinidol.com, a bearish candlestick body tested the 61.8 Fibonacci retracement level. The correction suggests that BNB will rise to the Fibonacci extension of $1.618 or to a high of $1,058.70. The currency is currently trading at $843.30.
BNB price indicator reading
The price bars are higher than the horizontal moving average lines, which are sloping upwards. The 21-day SMA is above the 50-day SMA, indicating an uptrend. On the 4-hour chart, the moving average lines are sloping northwards, indicating an uptrend.
Technical indicators:
Key Resistance Levels – $800, $850, $900
Key Support Levels – $600, $550, $500

What is the next direction for BNB/USD?
The BNB price continues to rise and continue its uptrend. Currently, the asset is trading in a narrow range above the 21-day SMA support and below the $860 resistance level. The cryptocurrency asset remains above the 21-day SMA support as it prepares to retest the $860 level. BNB will continue to rise above the $860 level.

Disclaimer. This analysis and forecast are the personal opinions of the author. They are not a recommendation to buy or sell cryptocurrency and should not be viewed as an endorsement by CoinIdol.com. Readers should do their research before investing in funds.

 1 month ago
64


 English (US) ·