
 2 months ago
39
2 months ago
39
Key Takeaways
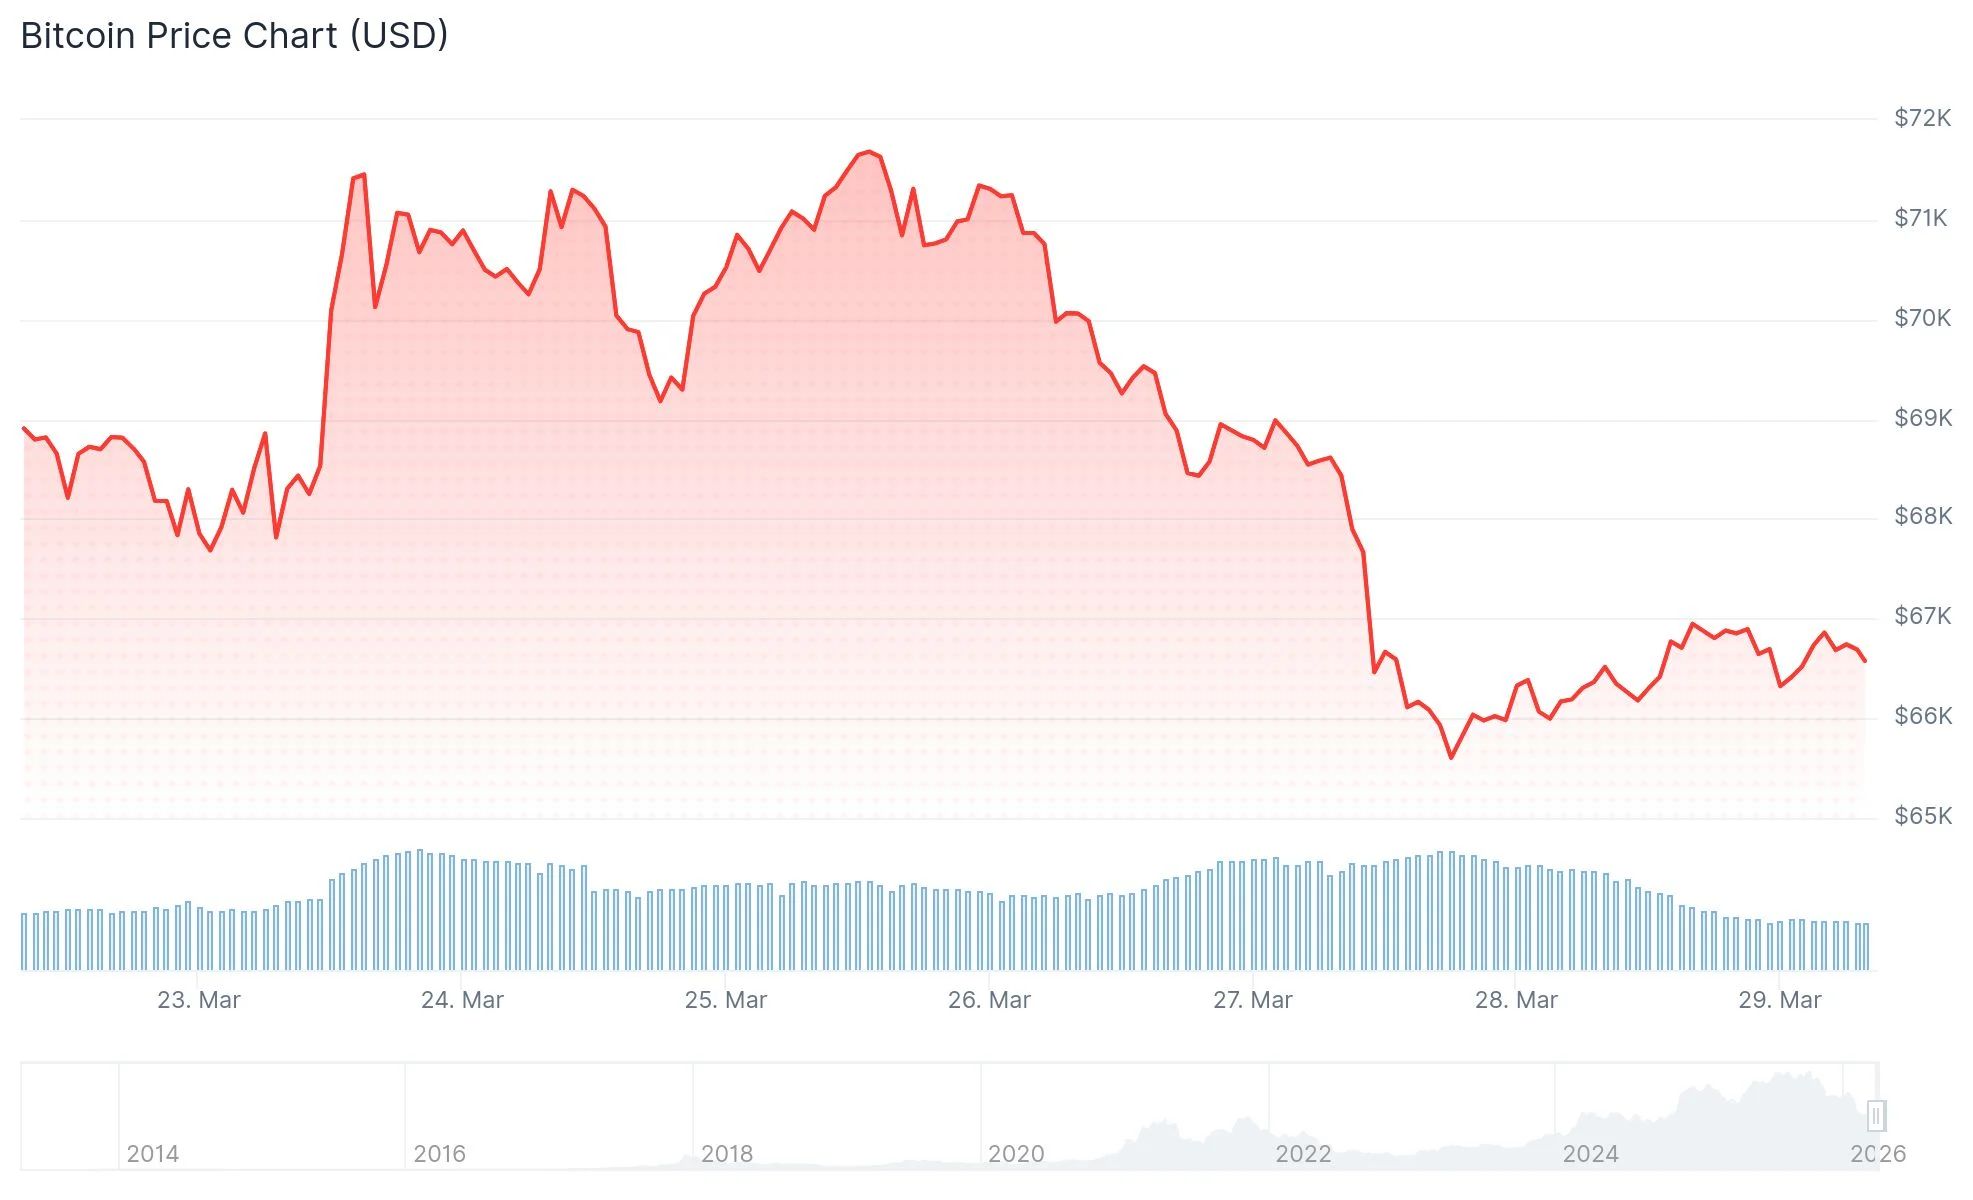
- BTC is hovering around $66,126, potentially marking its sixth straight monthly decline if March closes in the red.
- The U.S. 10-year Treasury yield is nearing the psychologically significant 5% threshold, a level historically correlated with Bitcoin downturns.
- Weekly outflows from spot Bitcoin ETFs reached $296 million, ending a four-week streak of positive inflows.
- Brent crude oil prices have rocketed from approximately $75 to roughly $106 this month, intensifying inflation worries.
- BTC remains trapped in a consolidation range between $65,000 and $72,000 as investors show reluctance toward directional bets.
Bitcoin faces mounting headwinds as a confluence of macro factors—climbing U.S. bond yields, soaring oil prices, and shifting ETF sentiment—apply downward pressure on price action. At press time, BTC was changing hands near $66,126, setting up for what could be another negative monthly performance.
 Bitcoin (BTC) Price
The leading cryptocurrency kicked off March with bullish energy, briefly touching $76,000 during the early days of the month. That upward push was partially attributed to positive sentiment surrounding geopolitical developments involving the United States, Iran, and Gulf region nations. However, macroeconomic forces have subsequently dominated the narrative.
Traders are now closely monitoring the U.S. 10-year Treasury yield, which appears to be forming a bullish flag consolidation pattern—a technical setup that typically precedes additional gains. Should this pattern confirm with a breakout, yields could advance toward the 5% mark or beyond, levels not witnessed since 2023.
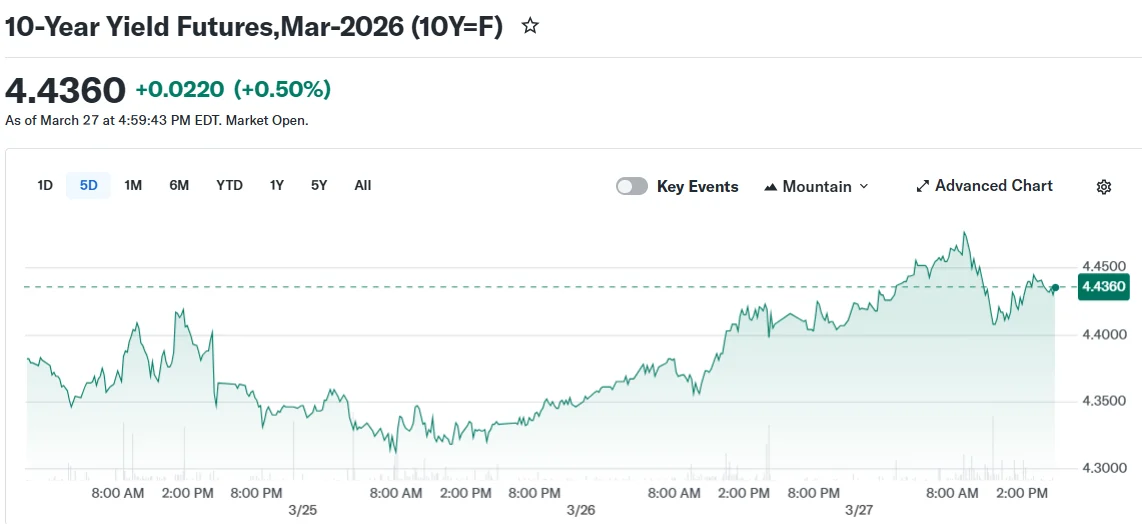 10-Year Yield Futures,Mar-2026 (10Y=F)
Elevated yields enhance the attractiveness of fixed-income instruments, siphoning capital away from higher-risk assets such as Bitcoin. Historical precedent supports this inverse relationship. During the period spanning October 2021 through December 2022, yields climbed from 1.45% to 3.90% while BTC plummeted from $67,000 to $16,256.
Should yields break above 5%, market analysts anticipate Bitcoin could retreat toward a support zone ranging between $58,632 and $55,302.
Bitcoin ETF Flows Turn Negative
Spot Bitcoin exchange-traded funds experienced a sentiment reversal, recording net outflows totaling $296.18 million during the week concluding Friday. This marked an end to four consecutive weeks of inflows that had collectively brought in over $2.2 billion.
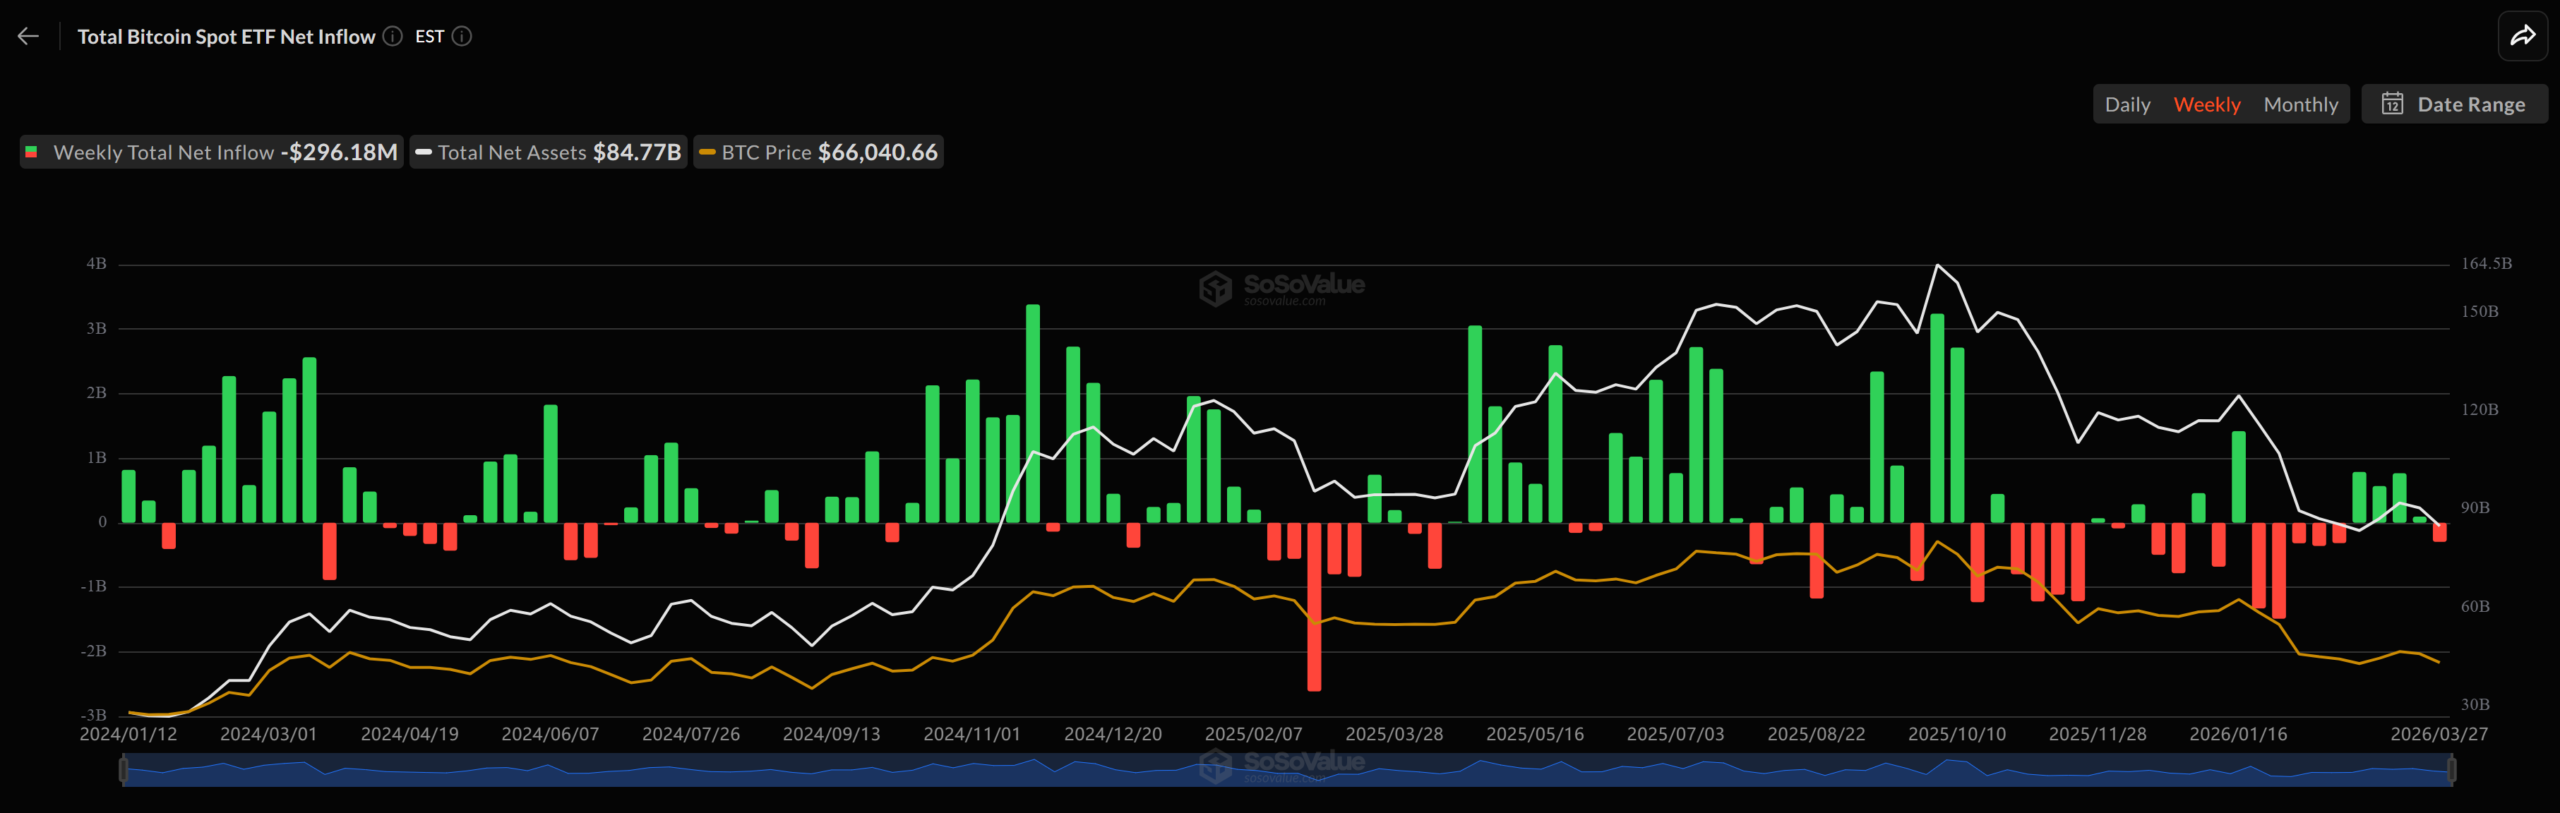 Source: SoSoValue
The final two trading sessions of the week proved particularly challenging, with withdrawals exceeding $396 million combined. Friday’s single-day exodus of $225.48 million represented the most significant outflow since March 3.
Aggregate net assets held within spot Bitcoin ETFs declined to $84.77 billion from above $90 billion just one week prior. Weekly trading volumes simultaneously contracted to $14.26 billion, a notable decrease from the $25.87 billion recorded earlier in March.
According to a Bitunix analyst, the current market environment reflects “surface stability, internal imbalance.” The analyst observed that Bitcoin is exhibiting characteristics more aligned with prevailing liquidity conditions rather than acting as a breakout asset. “Capital is not exiting the market, but neither is it willing to take directional risk,” the analyst commented.
Energy Prices Complicate the Picture
Crude oil markets have experienced dramatic appreciation throughout March. Brent crude has surged from approximately $75 at the month’s outset to roughly $106 currently. WTI crude was trading near $101 at the time of this writing.
This rally stems from supply chain disruptions and escalating geopolitical tensions, including heightened concerns surrounding the Strait of Hormuz. Rising energy costs diminish the likelihood of imminent interest rate reductions, maintaining restrictive financial conditions.
Spot Ethereum ETFs similarly experienced capital withdrawals for a consecutive second week, posting $206.58 million in net outflows.
Cryptocurrency analyst Ash Crypto highlighted on X that should BTC conclude March with negative performance, it would represent six consecutive monthly declines—a streak that has occurred only once previously in Bitcoin’s entire history, during 2018.
Despite recent outflows, cumulative net inflows into spot Bitcoin ETFs stand at $55.93 billion according to the most recent available data.
The post Bitcoin (BTC) Price: Macro Pressures Mount as Treasury Yields and Oil Rally—Can Support Hold? appeared first on Blockonomi.


 English (US) ·