
 3 months ago
43
3 months ago
43
- Bitcoin climbed above $69,000 even as traditional markets reacted to geopolitical tensions.
- Prediction markets remain divided, with traders slightly favoring a downside scenario.
- Key resistance near $73,000–$75,000 must break before a bullish trend can be confirmed.
Traditional markets have been looking nervous lately. Geopolitical tensions pushed energy markets higher, with oil briefly jumping toward $120 per barrel after U.S. and Israeli strikes on Iran. The reaction across global markets was immediate — stocks slipped, gold dropped as well, and several assets that usually act as safe havens didn’t really hold up.
Then Bitcoin did what it often does… something slightly different.
Instead of following the broader panic, Bitcoin climbed. Most of the top 10 cryptocurrencies opened the day in positive territory, with Tron being the only notable exception. BTC itself pushed above $69,000, gaining a little over 4% on the day. On the surface that looks encouraging, although the bigger picture is a bit more complicated.

Traders Split on Bitcoin’s Next Direction
In prediction markets, sentiment remains divided. On Myriad, a forecasting platform connected to Decrypt’s parent company Dastan, traders are essentially split between two outcomes — Bitcoin rallying toward $84,000 or falling closer to $55,000.
Right now the odds lean slightly bearish. Traders are assigning about a 57% probability to the downside scenario, which suggests that despite today’s bounce, many still see risks ahead.
Part of that uncertainty comes from the broader macro environment. With oil markets swinging wildly and global tensions rising, investors are debating which market could face deeper pressure first — equities or crypto.
Bitcoin’s own volatility index, known as BVIV, already spiked above 96 earlier this year when BTC dropped near $60,000. Meanwhile, the Crypto Fear and Greed Index has spent most of 2026 sitting in the fear zone.
Bitcoin Still Stuck Inside a Technical Compression Zone
Macro conditions matter here because Bitcoin is currently trading inside a compression structure. If traditional markets continue to weaken, risk assets — including crypto — could face additional pressure regardless of short-term rallies.
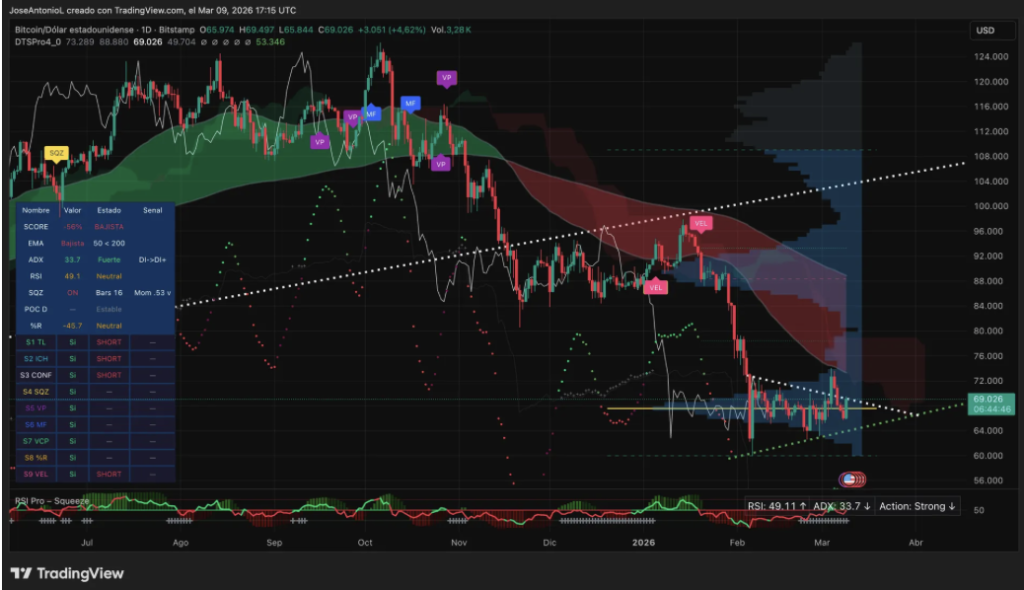
Bitcoin opened the latest session around $65,974 and climbed to roughly $69,128 during the day, marking an increase of about 4.78%. The intraday high reached $69,497. Those numbers sound bullish at first glance.
But technical charts tell a more nuanced story.
Last week Bitcoin briefly broke above a descending triangle that has been shaping its price movement since February. For a moment it looked like a clean breakout. However, by the end of the week the price had slipped back inside the pattern.
Instead of a true breakout, the move appeared more like a long wick on the chart — something similar to an inverted doji candle. That usually indicates buyers tried pushing the price higher but were quickly overwhelmed by sellers.
Indicators Show Uncertain Momentum
Technical indicators are reflecting this uncertainty.
The Average Directional Index currently sits near 33.7. Since ADX readings above 25 typically signal a strong trend, this number suggests Bitcoin still has meaningful trend momentum. However, the ADX is actually declining compared to earlier readings during the recent bearish phase.
That shift doesn’t necessarily mean bulls are in control yet. It simply shows the battle between buyers and sellers is tightening.
The Relative Strength Index sits around 49.3. Because RSI ranges from 0 to 100 — with 50 marking the neutral midpoint — that reading basically places Bitcoin right in the middle of the momentum scale. Neither bullish nor clearly bearish.
Traders usually want to see RSI move firmly above 50 before calling a real shift in momentum. For now, it’s just hovering there.
Key Resistance Still Blocking a Breakout
Moving averages may tell the clearest story. The 50-day exponential moving average remains below the 200-day EMA, and the gap between them is actually widening. When the shorter-term average sits below the long-term one, it typically signals that recent price action is weaker than the broader trend.
For the market structure to improve meaningfully, Bitcoin would need to break above the descending trendline currently sitting near the $73,000 to $75,000 range. That area also lines up closely with the 50-day EMA around $73,293.
If bulls can push through that level and hold it, the structure could shift toward a more constructive trend. Ideally, traders would also want to see the ADX rise again to confirm that momentum supports the move.
Support Levels Could Decide the Next Move
For now, Bitcoin’s latest rally mainly gives short-term traders something to work with. Longer-term investors are still watching key levels carefully.
If BTC can hold above the $73,000–$75,000 zone in coming sessions, the current consolidation could eventually resolve to the upside.
But if the price drops back toward the heavy trading area between $65,000 and $66,000 — sometimes called the volume shelf — the outlook changes quickly. Losing that level would remove a major layer of support, potentially opening the path toward $60,000 again.
So at the moment, Bitcoin sits in a familiar spot. A bounce has appeared, yes… but confirmation hasn’t arrived yet.
Disclaimer: BlockNews provides independent reporting on crypto, blockchain, and digital finance. All content is for informational purposes only and does not constitute financial advice. Readers should do their own research before making investment decisions. Some articles may use AI tools to assist in drafting, but every piece is reviewed and edited by our editorial team of experienced crypto writers and analysts before publication.


 English (US) ·