
 1 hour ago
10
1 hour ago
10
TLDR:
- Bitcoin ETF inflows reached about $853.5 million across five positive sessions. That marked the strongest weekly total for the products since mid-April.
- BlackRock’s IBIT drew $693.7 million, representing more than 80% of Bitcoin fund inflows. Fidelity’s FBTC attracted another $116.4 million.
- Ether ETF inflows totaled roughly $244.9 million and extended their winning streak to five weeks. The Coldcard exploit only affected Bitcoin wallets.
- Bitcoin ETF volume fell 9% to about $8.19 billion. Meanwhile, Bitcoin tested $65,000 with resistance near the $67,523 short-term holder cost basis.
U.S. crypto funds posted their strongest combined weekly intake since April, with Bitcoin ETF inflows leading a $1.1 billion surge. Spot Bitcoin products attracted about $853.5 million across five straight positive sessions. Ether funds added roughly $244.9 million during the same week.
BlackRock’s IBIT captured most Bitcoin demand, while Fidelity’s FBTC ranked second. The inflows arrived even as weekly trading activity stayed near multi-year lows. Bitcoin traded near $65,000 after recovering from early-August weakness. However, resistance still remains clustered between $65,250 and $67,523. Technical levels and short-term holder costs could limit further gains during the latest week.
Bitcoin ETF Inflows Accelerate as IBIT Dominates Weekly Buying
Bitcoin ETF inflows reached about $853.5 million last week, marking their best result since mid-April. The funds recorded net additions during five trading sessions. Wednesday led with $244.4 million, followed by Tuesday at $211.5 million. Thursday added $128.7 million, while Friday contributed another $98.9 million.
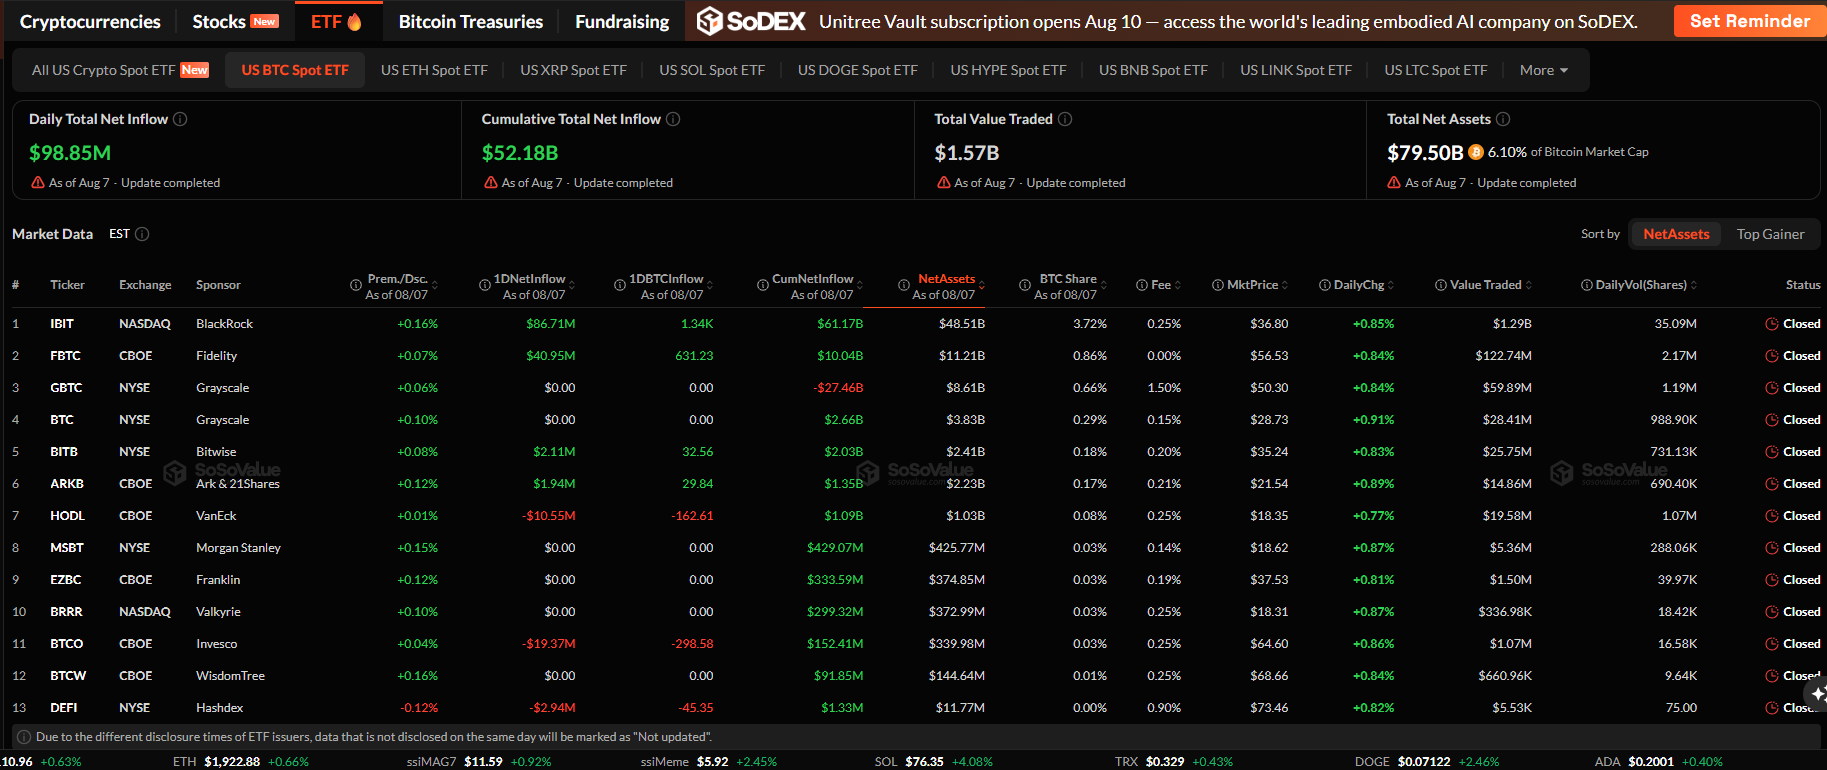 Source: SosoValue
BlackRock’s IBIT absorbed $693.7 million, representing more than 80% of weekly Bitcoin ETF inflows. Fidelity’s FBTC added $116.4 million, equal to roughly 13% of total inflows. Together, the two largest funds captured most of the fresh capital driving Bitcoin ETF inflows.
Bloomberg analyst Eric Balchunas linked part of the buying to the Coldcard wallet exploit. Several major funds recorded inflows every day after the vulnerability surfaced. The exploit affected certain Bitcoin cold-storage wallets, with reported thefts exceeding $111 million.
However, the timing does not fully explain broader crypto fund demand. Ether ETF inflows also posted their best week since April. Ether holders had no exposure to the Bitcoin-only hardware wallet issue. This weakens a direct link between the exploit and institutional inflows.
Bitcoin rose about 3% during the week and moved above $65,300 on Friday. U.S. payrolls fell by 23,000 in July, missing forecasts for an 80,000 increase. Traders reduced expectations for a September Federal Reserve rate hike after the report.
Most Bitcoin ETF inflows arrived before Friday’s labor data. Thursday and Friday recorded the weakest inflow totals of the five-session streak. That pattern shows institutional buying was already active before the macroeconomic surprise.
Ether ETF Inflows Extend Run as Trading Volumes Stay Low
Ether ETF inflows reached about $244.9 million for the week, extending their positive run to five weeks. That marks their longest 2026 weekly winning streak. Thursday produced the strongest daily intake at $92.2 million.
The funds held $10.74 billion in net assets by Friday. Their cumulative net inflows stood near $11.46 billion. The difference leaves the products roughly $711 million below aggregate contributed capital on a mark-to-market basis.
Large Ether holders have also increased their balances. Wallets holding between 10,000 and 100,000 ETH control about 19.6 million ETH. That figure has climbed from roughly 14 million ETH in mid-2025.
Trading volume stayed subdued despite the stronger fund flows. Bitcoin ETF volume totaled about $8.19 billion, down 9% from the prior week. That was the second-lowest full trading week since October 2024. Ether ETF turnover fell about 21% to roughly $2.38 billion.
Bitcoin traded near $65,015 while repeatedly testing the $65,000 area. The daily price remained above its 20-day and 50-day simple moving averages. Those averages sit near $64,461 and $63,363, creating an immediate support zone.
Resistance remains visible above current levels. Bitcoin trades below its 100-day average near $68,052 and 200-day average near $70,295. Short-term holder realized price stands near $67,523, leaving many recent buyers close to breakeven.
A four-hour close above $65,257 could expose $65,600 and then $66,000. Liquidation data also shows concentrated short positions near $65,500 to $65,700. Meanwhile, downside liquidity sits near $63,700 and $63,000 if Bitcoin loses $64,000 support.
The post Bitcoin ETF Inflows Lead $1.1B Weekly Surge Despite Low Volume appeared first on Blockonomi.





 English (US) ·