
 1 hour ago
11
1 hour ago
11
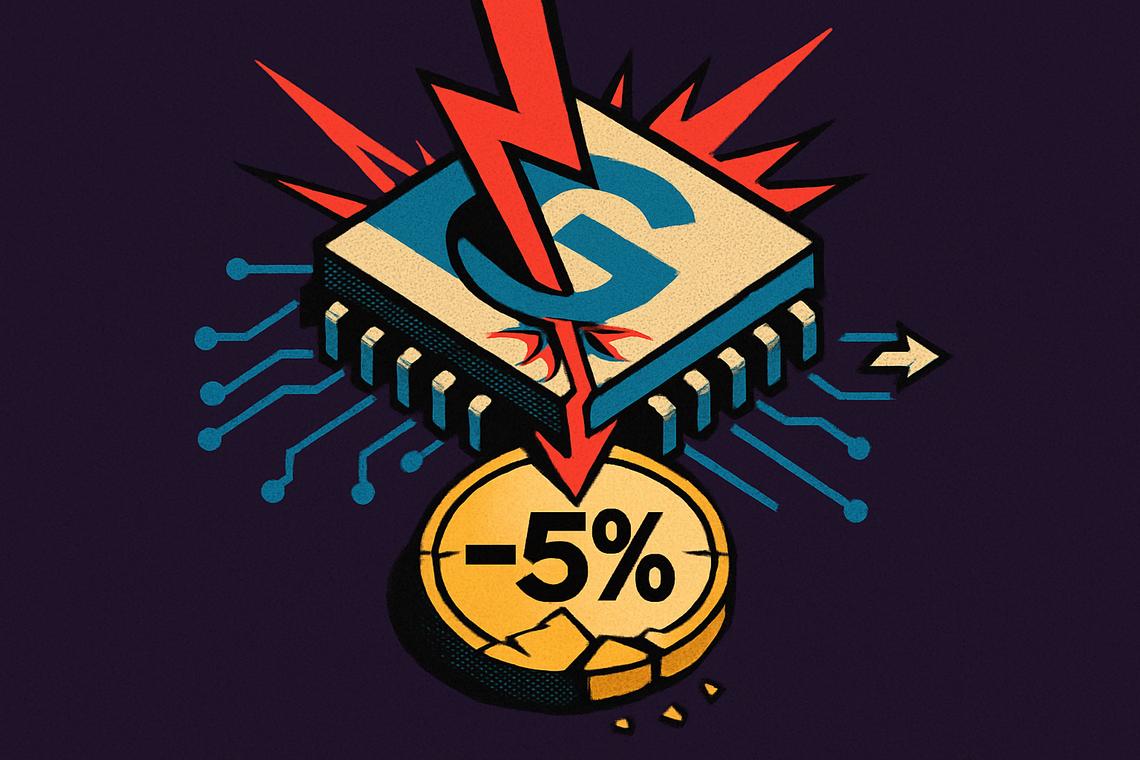
Bitcoin is stuck in a holding pattern below $65K, and the culprit isn’t some crypto-native drama. It’s the oldest macro villain in the book: stagflation.
The S&P Global US Manufacturing PMI for July 2026 came in at 53.9, marking 12 consecutive months of expansion in factory activity. That sounds like good news until you dig into the details. New orders and output growth both hit four-month lows, while input costs remained stubbornly elevated thanks to tariffs and energy prices. Growth slowing down while inflation refuses to budge. That’s the stagflation playbook.
A tale of three assets diverging
Throughout 2026, BTC’s correlation with the S&P 500 has been steadily declining. Its relationship with gold, the traditional stagflation hedge, has similarly weakened.
That range has held firm since the PMI data dropped on August 3, with price action as of August 5-6 showing little appetite for a breakout in either direction.
ETF outflows tell the real story
Bitcoin ETFs experienced hundreds of millions in outflows during early August 2026, reinforcing a pattern of short-term selling pressure that has coincided with stagflation-adjacent data releases throughout the year. This isn’t the first time PMI prints have spooked ETF holders. Similar outflow episodes occurred earlier in 2026 when manufacturing data sent mixed signals about the economy’s direction.
The structural case hasn’t changed
ETF adoption continues to expand the addressable market for BTC. Supply dynamics, particularly the ongoing effects of the 2024 halving, continue to constrain new issuance.
The July 2026 PMI reading of 53.9 echoed patterns from the previous year, when similar data points created temporary headwinds for Bitcoin before broader adoption trends reasserted themselves.
What this means for investors
The declining correlation between Bitcoin and traditional financial indicators means the asset is increasingly driven by its own market dynamics, which right now are dominated by ETF flows and macro sentiment rather than on-chain fundamentals.
Traders watching the $63,000 to $65,000 range should pay close attention to upcoming inflation data and any Fed commentary on the growth-inflation tradeoff. If the stagflation narrative intensifies, the floor at $63,000 could face a real test. A break below that level would likely trigger additional ETF outflows, creating a negative feedback loop.
Disclosure: This article was edited by Editorial Team. For more information on how we create and review content, see our Editorial Policy.







 English (US) ·