
 2 hours ago
15
2 hours ago
15
The Bitcoin price stopped short of the $66K horizontal resistance level and may be rolling over. Will one of the support structures below stop the slide, or is this rally now over, with much lower prices to come?
Rejection from $65,600 - down from here?
Source: TradingView
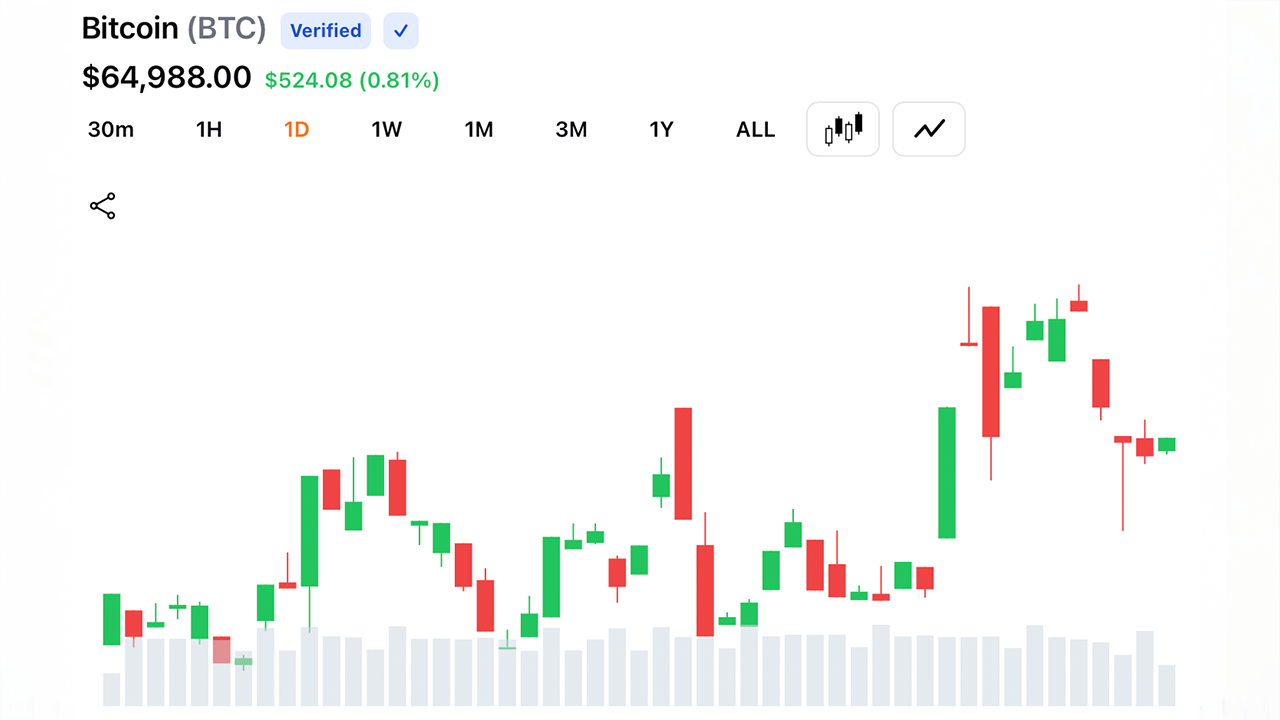
Analysing the $BTC price on Thursday morning it can be seen that it just touched the horizontal resistance at $65,600. This really is the level to break, given the decent amount of support it provided from February through to May this year.
However, the $BTC price may have reached this critical level in the dying embers of its rally. Shorter term momentum indicators are currently turning down, and unless there is a last surge out of the blue, the path of least resistance would appear to be to the downside.
As observed in the chart above, the first support is the top of the falling wedge. This is important for the bulls to hold, as a confirmed descent back into the wedge would mean that the upside price action since Tuesday would have been nothing more than a fakeout. Below this is the $63K horizontal level, and then the bull market trendline - all important supports for this rally to stay alive.
Possible bounce first
Source: TradingView
The daily chart demonstrates that there is actually some firm support at the top of the wedge. This is provided by a horizontal level and the 50-day simple moving average (SMA), therefore, a bounce may occur from here. Nevertheless, it might be expected that at the very least, the bull market trendline could be called into action as support at some stage.
Could a falling wedge be the last bear market pattern?
Source: TradingView
The $BTC price is moving into the back half of the week and is still tantalising bulls and bears alike. It’s true that there is no bear flag this time around. With the first two bear flags it was relatively easy to guess that more downside was on the way.
Here, the pattern has not yet been resolved, but a falling wedge could be the more bullish outcome. If this is the case, the price could come back down, perhaps dipping beneath the bull market trendline again, before breaking back to the upside. There are already three touches to the bottom of the wedge, so another one is not really necessary.
Even if the price does break to the upside relatively quickly, the resistance at $66K could continue to force the price sideways, perhaps into the back end of August or later. If this bear market matches the previous ones, it would come to an end sometime in Q4, with October being the probable month this occurs.
Disclaimer: This article is provided for informational purposes only. It is not offered or intended to be used as legal, tax, investment, financial, or other advice.








 English (US) ·