
 2 months ago
36
2 months ago
36

Traders face an unfriendly tape in Bitcoin crypto today, with fear high, volatility elevated, and the broader market bleeding while BTC holds relative dominance.
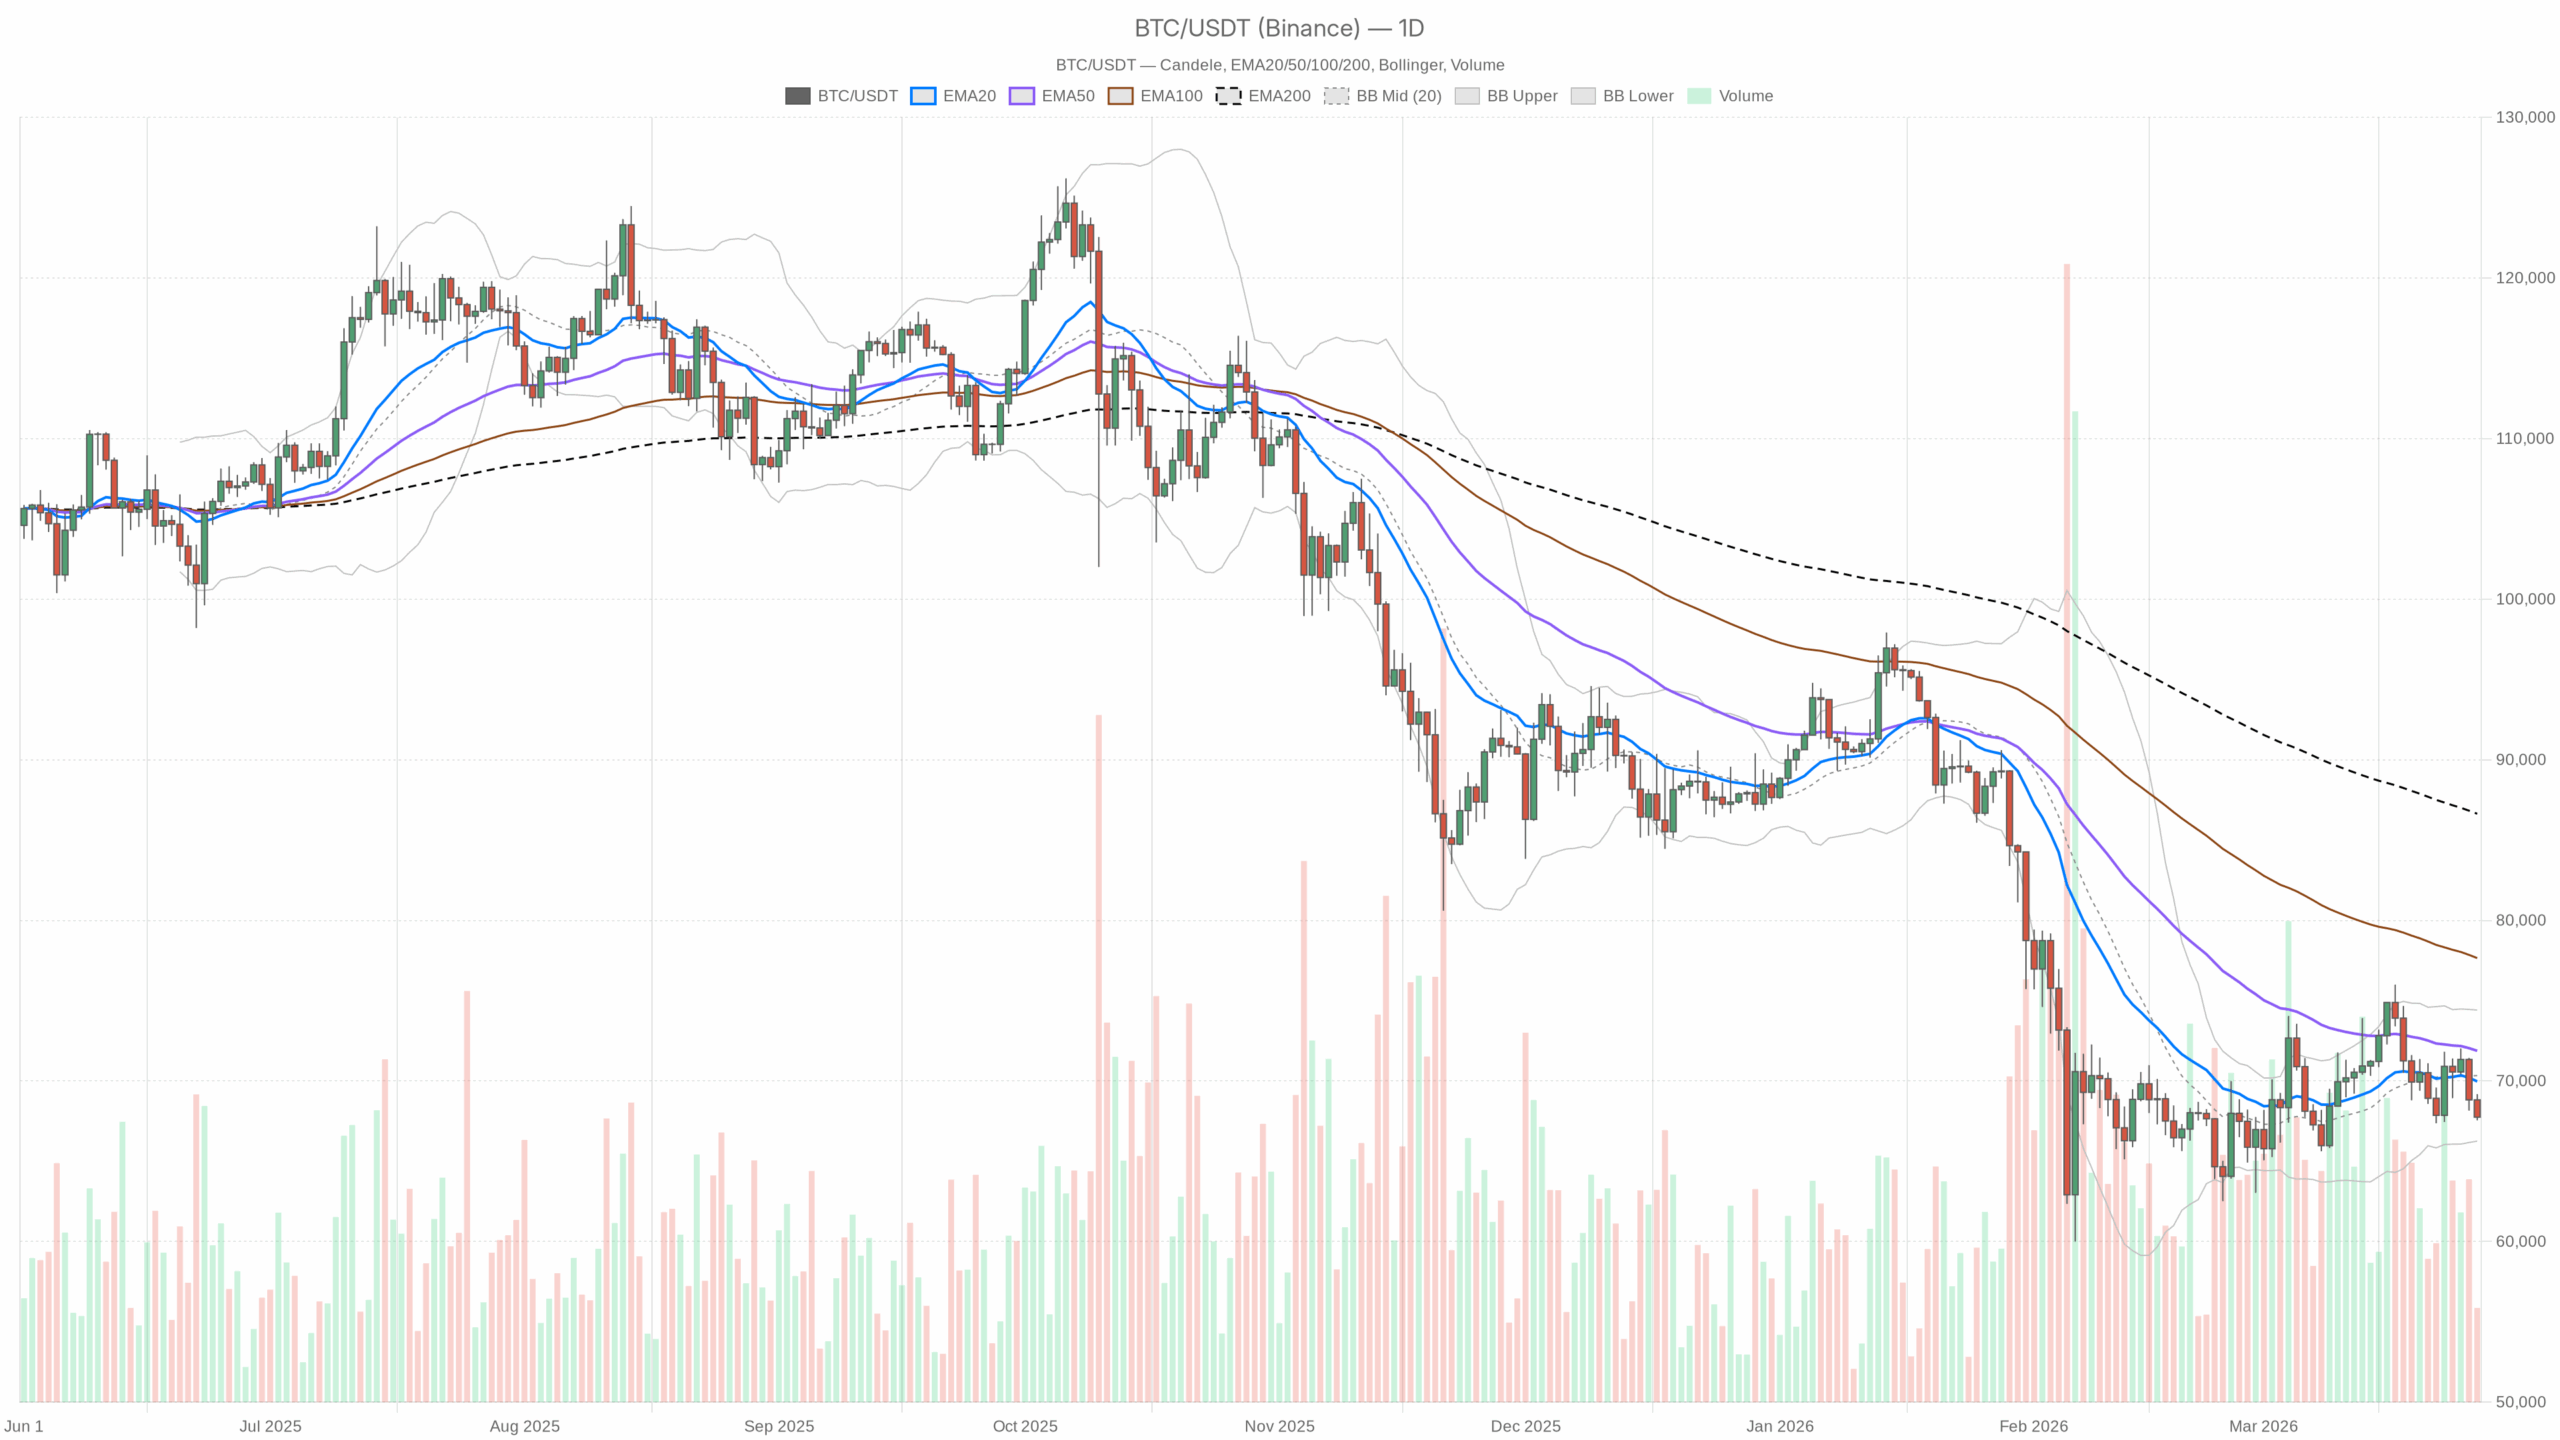 BTC/USDT — daily chart with candlesticks, EMA20/EMA50 and volume.
Market thesis: controlled bleed, fear peaking
Bitcoin against USDT is trading around $67,700, with the daily trend clearly pointing lower. Price sits below all the key daily moving averages and under the Bollinger mid-band, while market-wide crypto capitalization is down about 2.1% in 24 hours. At the same time, BTC dominance around 56% shows capital hiding in Bitcoin while the rest of the market bleeds harder.
The dominant force right now is risk-off positioning driven by fear. The Fear & Greed Index is stuck in Extreme Fear at 13, and DeFi fee activity is sharply lower across major DEXs over the last month. Moreover, liquidity is pulling back and volatility is up, so BTC is being treated more like a defensive asset inside crypto than a high-beta risk play. The big question for traders is whether we are in the late phase of a corrective dump that is close to exhaustion, or the early innings of a deeper trend breakdown.
Daily timeframe (D1): macro bias is bearish
The daily chart sets the tone: the system tags the regime as bearish, and the evidence is broadly aligned with that call.
Trend structure: EMAs
Data:
Price: $67,743.99
EMA 20: $69,969.14
EMA 50: $71,872.77
EMA 200: $86,636.70
Interpretation: Price is below the 20, 50, and 200-day EMAs, with a clear downside stack (price < EMA20 < EMA50 < EMA200). That is a classic downtrend alignment, not a sideways market. Bulls have lost control of the short- and medium-term trend, and even the long-term trend (200 EMA) is far above, underscoring how extended the prior bull phase was and how much room a deeper correction could still have.
Momentum: RSI
Data:
RSI 14 (D1): 43.68
Interpretation: Daily RSI is below the midline but not oversold. That fits a controlled downtrend: sellers are in charge, but we are not yet at the kind of capitulation levels often seen near major swing lows. There is room for more selling before a textbook oversold bounce is forced by momentum conditions.
Momentum & trend confirmation: MACD
Data:
MACD line: -219.55
Signal line: 13.89
Histogram: -233.44
Interpretation: The MACD line is deeply negative and below the signal line, with a sizeable negative histogram. That is a strong downside momentum reading rather than a gentle drift. Bears are pressing, and there is no meaningful daily bullish crossover building yet. Any bullish scenario has to respect that the daily momentum trend is still down.
Volatility & positioning: Bollinger Bands
Data:
BB mid: $70,333.24
Upper band: $74,411.88
Lower band: $66,254.60
Price: $67,743.99
Interpretation: Price is trading in the lower half of the band, closer to the lower band than the mid. That confirms a downside bias but not an outright volatility spike yet. We are leaning on the lower side of the range, which favors short-side trades on bounces rather than aggressive bottom-fishing. However, if price starts to tag or pierce the lower band repeatedly and then hold, that can signal a short-term exhaustion low.
Range & intraday risk: ATR and pivots
Data:
ATR 14 (D1): $2,548.65
Pivot point (PP): $68,157.24
R1: $68,765.80
S1: $67,135.42
Interpretation: A daily ATR above $2.5k says volatility is elevated. The market can easily swing 3–4% in a day without breaking character. Price is currently just under the daily pivot point, tilting the day’s balance slightly to the bearish side. S1 near $67.1k is the first local line in the sand; if BTC spends time below there, it confirms sellers are willing to push the daily range lower.
Daily bias summary: The main scenario on the daily chart is bearish. Trend, momentum, and volatility structure all lean to the downside, with fear high but not yet at a classical capitulation in price.
1-hour timeframe (H1): short-term selling pressure is stretched
On the 1-hour chart, the system also marks the regime as bearish, but here we start to see signs that the latest leg lower is getting heavy and tired rather than freshly aggressive.
Trend: EMAs on H1
Data:
Price: $67,777.99
EMA 20: $68,789.78
EMA 50: $69,464.92
EMA 200: $70,219.84
Interpretation: Price is below the 20, 50, and 200 EMA on the hourly chart, keeping the intraday trend bearish. The downward alignment is intact, which means any bounce that fails below the EMA20–EMA50 band is just another lower high in the short-term downtrend.
Momentum: RSI on H1
Data:
RSI 14 (H1): 24.44
Interpretation: Hourly RSI is oversold. This is where the picture starts to diverge from the daily: intraday, sellers have pushed hard enough that a reflex bounce or at least a pause is statistically likely. It does not change the daily bear trend by itself, but it does inject short-term mean-reversion potential. Shorts opened into this oversold zone are chasing, not leading.
Momentum: MACD on H1
Data:
MACD line: -456.85
Signal line: -422.91
Histogram: -33.95
Interpretation: Both MACD and signal are deeply negative, but the histogram is only mildly negative. That often marks a phase where downside momentum is still there but not accelerating. Bears are in control, yet follow-through is less explosive, which again fits the idea of a market due for a corrective bounce rather than fresh breakdown every hour.
Volatility & intraday ranges: Bollinger Bands and ATR on H1
Data:
BB mid: $68,713.21
Upper band: $69,460.77
Lower band: $67,965.64
Price: $67,777.99
ATR 14 (H1): $473.12
Interpretation: Price is trading right near or slightly below the lower hourly band, while ATR points to almost $500 typical hourly swings. That combination signals an aggressive push to the downside inside a wide intraday range. Strong moves beyond the lower band can be continuation in a trend day. However, when paired with oversold RSI, the probabilities lean more toward whipsaws and snapback rallies if shorts get crowded.
Intraday balance: hourly pivots
Data:
Pivot point (PP): $67,758.89
R1: $67,969.11
S1: $67,567.77
Interpretation: Price is hovering around the hourly pivot. That tells you the market is wrestling over direction at this level even if the broader structure is down. A sustained hold below S1 would open another intraday leg lower; a reclaim of R1 and hold above it would confirm a short-covering bounce is underway.
15-minute timeframe (M15): execution layer, not a trend call
The 15-minute regime is also marked bearish, but this timeframe is mainly useful for entry and exit context rather than call-the-trend decisions.
Trend: EMAs on M15
Data:
Price: $67,776.04
EMA 20: $68,443.39
EMA 50: $68,693.93
EMA 200: $69,571.26
Interpretation: Price trades below all intraday EMAs on the 15-minute chart, keeping micro-structure in a series of lower highs and lower lows. Any quick pops into the $68.4k–$68.7k zone are likely to meet selling pressure from short-term traders unless the market is transitioning into a more forceful bounce.
Momentum: RSI on M15
Data:
RSI 14 (M15): 28.93
Interpretation: Short-term RSI is also in oversold territory. Combined with the hourly oversold reading, this reinforces the risk of near-term short squeezes or at least consolidation instead of a straight-line dump.
Momentum & volatility: MACD, Bollinger Bands, ATR on M15
Data:
MACD line: -209.09
Signal line: -111.76
Histogram: -97.33
BB mid: $68,522.07
Upper band: $69,165.52
Lower band: $67,878.61
ATR 14 (M15): $253.22
Interpretation: MACD is negative with a wide gap to the signal line, confirming the local downmove has been sharp. Price is pinned near the lower Bollinger band with a quarter-thousand-dollar average 15-minute range. That is fertile ground for fast reversals: scalpers will be fading extremes, while trend traders will be wary of initiating new positions in the hole.
Very short-term balance: M15 pivots
Data:
Pivot point (PP): $67,758.24
R1: $67,967.81
S1: $67,566.47
Interpretation: Similar to the hourly, price is dancing around the 15-minute pivot. That is exactly what you expect when the market is deciding between continuation and a counter-trend bounce. Breaks below S1 that get bought quickly would signal absorption; steady trading below S1 would support the bear continuation case.
Market context: fear, dominance, and liquidity
BTC dominance at 56.2% with a -2.1% daily drop in total crypto market cap paints a picture of capital rotating defensively into Bitcoin even as the whole space is under pressure. This is classic BTC as relative safe haven inside crypto behavior. Altcoins are likely to be suffering deeper drawdowns relative to BTC.
At the same time, DeFi activity is cooling sharply: 30-day fee changes are deeply negative for Uniswap V3, Curve, Fluid, and others. That speaks to thinning on-chain volumes and a broader liquidity contraction. In such an environment, moves can overshoot in both directions as order books get thinner and slippage worsens.
The Extreme Fear reading at 13 is an important sentiment signal. It aligns with a bearish trend, but from a contrarian standpoint, it also says a lot of pain is already priced in emotionally. Historically, extended periods in this zone precede powerful squeezes and recovery rallies. That said, timing those inflection points purely from sentiment is risky.
Bullish scenario: oversold bounce evolving into a trend repair
The constructive path for Bitcoin from here starts with short-term oversold conditions on H1 and M15 and then builds upward through the higher timeframes.
First step: bulls need to force an intraday reversal above the immediate pivot levels. On the micro side, holding above $67.8k and flipping $67.97k (M15/H1 R1) into support would confirm a short-covering rally is underway. Once that is secured, the focus shifts to the hourly EMAs. Reclaiming and holding above the H1 EMA20 around $68.8k would be the first sign that sellers are losing their grip intraday.
From there, the bigger fight sits on the daily chart. A genuine bullish repair requires BTC to trade back above the daily pivot at $68,157 and then challenge the daily EMA20 near $70k. Sustained closes above the 20-day EMA, with daily RSI pushing back over 50 and the MACD histogram shrinking toward zero, would mark a transition from downtrend to neutral. That would open the door toward $72k (EMA50) and the Bollinger mid-band region.
What invalidates the bullish scenario? A clean daily close below the Bollinger lower band and S1 area, roughly a decisive break under $66k–$66.2k, without swift recovery would say the supposed oversold conditions were just the start of a stronger liquidation wave. In that case, the idea of a near-term trend repair is off the table until a new, lower base forms.
Bearish scenario: trend continuation and deeper correction
The dominant scenario from the daily chart perspective is still downside continuation.
In this path, the current intraday oversold readings lead only to shallow or failed bounces. Price would struggle beneath hourly resistance, with sellers reloading around the $68.5k–$69k band (H1 EMA20 and EMA50 area) and pushing new lows from there. If BTC repeatedly fails to hold above the $68.1k daily pivot and stalls under the $70k region, it confirms that rallies are being used to distribute, not accumulate.
A decisive daily move and close below the Bollinger lower band near $66,254 would then open the door to a larger range expansion lower. Given the current ATR, multithousand-dollar daily candles are on the table. With daily RSI still above oversold, there is technical room for BTC to probe meaningfully lower levels before momentum becomes extreme.
What invalidates the bearish scenario? A sequence of daily higher lows and higher highs anchored above the 20-day EMA would weaken the bear case. More concretely, if BTC can reclaim and hold above $70k, pull back without losing the mid-$60ks, and show daily MACD curling up toward a bullish cross, the argument for a continued downtrend starts to break down. Bears lose the initiative once they can no longer defend the 20-day EMA as resistance.
How to think about positioning now
Bitcoin crypto today is a market where the higher timeframe is still bearish, while the shorter timeframes are oversold and volatile. That mix is dangerous for both sides: late shorts risk getting squeezed in face-ripping bounces, and early dip buyers risk catching a falling knife if they lean too hard against the trend.
For traders, the key is to separate directional bias from execution timing:
- The directional bias from the daily chart favors caution on outright longs until BTC can reclaim at least the 20-day EMA and stabilize above the daily pivot.
- Execution-wise, the H1 and M15 oversold conditions mean entries, long or short, should respect the elevated intraday ATR; position sizes and stop distances need to reflect the reality of $500+ hourly swings.
Uncertainty is high: sentiment is washed-out, liquidity is thinner, and volatility is elevated. Those are the conditions where sharp reversals and false breakouts are common. Traders who navigate this phase successfully tend to size conservatively, stay nimble, and let the daily structure, not emotions, define when the tide has genuinely turned for Bitcoin crypto today.


 English (US) ·