
 1 hour ago
12
1 hour ago
12

BlackBerry Stock (BB) remains in a clear daily uptrend, but the tape looks stretched, increasing near-term pause risk. The path of least resistance is higher; however, the next leg likely needs brief consolidation above support or a decisive break through nearby resistance.
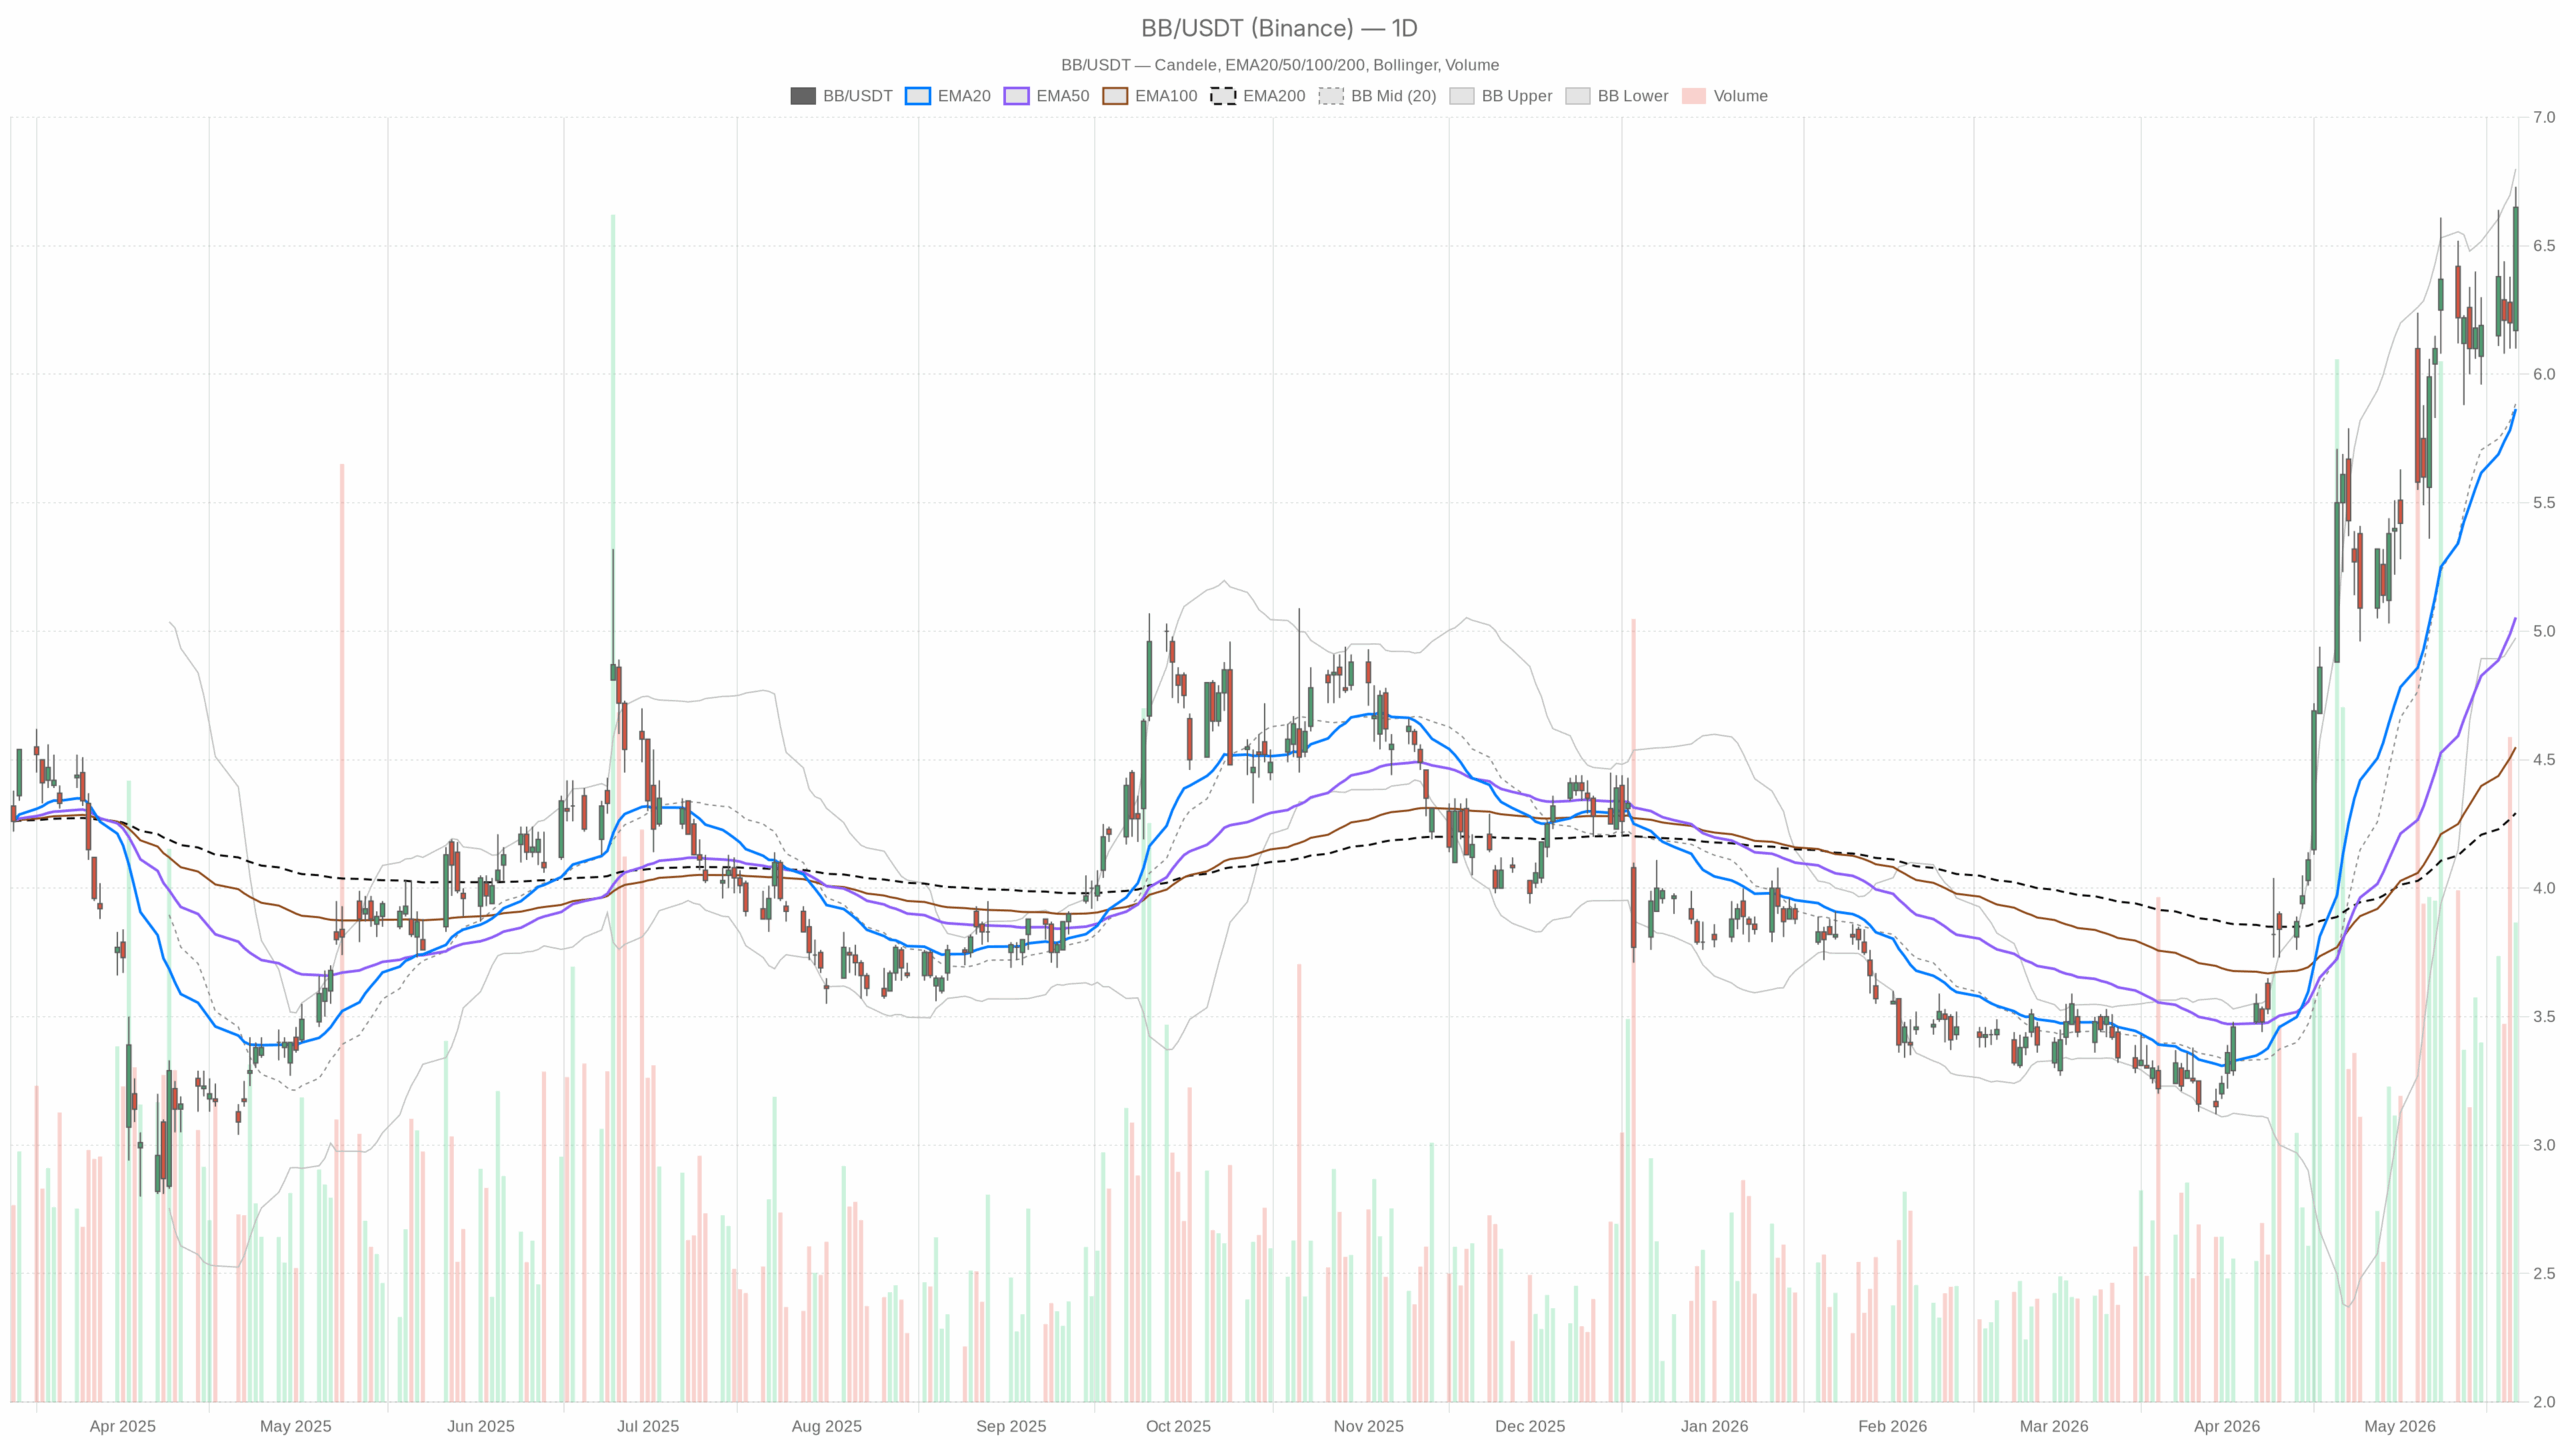 BB — daily chart with candlesticks, EMA20/EMA50 and volume.
BlackBerry Stock Daily Trend: Bullish but Stretched
Notably, price closed at 6.65, well above the 20/50/200-day EMAs at 5.87/5.05/4.29. That alignment signals a strong primary trend and layered support beneath price. The daily regime therefore remains firmly bullish.
Momentum and Key Levels
Daily RSI 75.66 shows hot momentum, yet overbought conditions raise near-term fade risk. The daily MACD has its line just under the signal with a -0.02 histogram; momentum is pausing, not reversing. Meanwhile, daily Bollinger Bands at 5.89/6.80/4.97 place price near the upper band, underscoring trend strength while flagging stretch. Daily ATR 0.45 signals elevated volatility. The daily pivot 6.49 with R1 6.89 and S1 6.26 frames the near-term battleground.
Hourly Backdrop Confirms BB Upside Bias
On the 1-hour chart, price holds above the 20/50/200-hour EMAs at 6.39/6.28/5.55. Rising support keeps the intraday uptrend intact. Hourly RSI 65.7 is constructive without being extreme, and the MACD histogram near 0.05 shows buyers still have initiative.
Meanwhile, hourly Bollinger mid/upper/lower sit at 6.33/6.66/6.00. Price kissing the upper band hints at a pause unless a clean breakout follows. Hourly ATR 0.14 keeps ranges active but controlled. The hourly pivot 6.67 with R1 6.71 and S1 6.62 highlights light resistance into 6.71.
15-Minute Execution Context
At the same time, the 15-minute view guides entries rather than changing bias. Price rides above the 20/50/200-period EMAs at 6.56/6.44/6.27, showing near-term dip demand. The RSI 62.5 is firm but not stretched, while the MACD histogram sits near 0, indicating neutral very short-term impulse.
In addition, Bollinger bands on this timeframe are 6.56/6.77/6.35. Price below the 6.77 upper band suggests room for a push if resistance gives way. The pivot 6.67 with R1 6.71 and S1 6.62 implies micro-structure favors buying reactions near support rather than chasing into resistance.
News Flow Supports Trend Persistence
Notably, BlackBerry’s AtHoc platform secured FedRAMP High re-certification for 2026. That credential reinforces federal and critical-infrastructure demand. Consequently, it strengthens the medium-term narrative and helps justify trend persistence, even after strong year-to-date gains in BlackBerry Stock.
Scenarios for BlackBerry Stock
Bullish Scenario
A firm hold above the daily pivot 6.49, followed by an intraday reclaim of 6.67 and a break through 6.71, would keep buyers pressing for the daily upper band near 6.80. A sustained push beyond 6.80 toward daily R1 6.89 would signal trend acceleration.
On indicators, a turn up in the daily MACD histogram and an hourly RSI staying north of 60 would corroborate follow-through. That would imply momentum is rotating higher after a brief pause.
Bearish or Consolidation Scenario
However, repeated failures near 6.70–6.73 and a slip below 6.62, then 6.49, would open a pullback toward 6.26 (daily S1) as stretched conditions unwind. In contrast, an hourly RSI sliding under 50 and a deepening negative daily MACD histogram would confirm momentum loss.
That would invalidate the immediate bullish extension and shift focus to the daily EMA20 near 5.87 as a stronger support zone.
Bottom Line on BlackBerry Stock
Overall, the trend in BlackBerry Stock is up, but it is late in the current swing and volatility is elevated. Positioning around 6.67–6.71 looks pivotal intraday, while 6.49 and 6.26 define the daily floor for trend maintenance. Expect choppier trade near the upper band, with upside continuation favored only if resistance gives way cleanly.


 English (US) ·