
 4 hours ago
21
4 hours ago
21

Caterpillar stock closed at 830.03 after beating Q2 earnings, with data center spending fueling power-generation growth. Yet the daily chart remains corrective, with CAT trading below key moving averages. The tension between record fundamentals and weakening technicals now defines the setup.
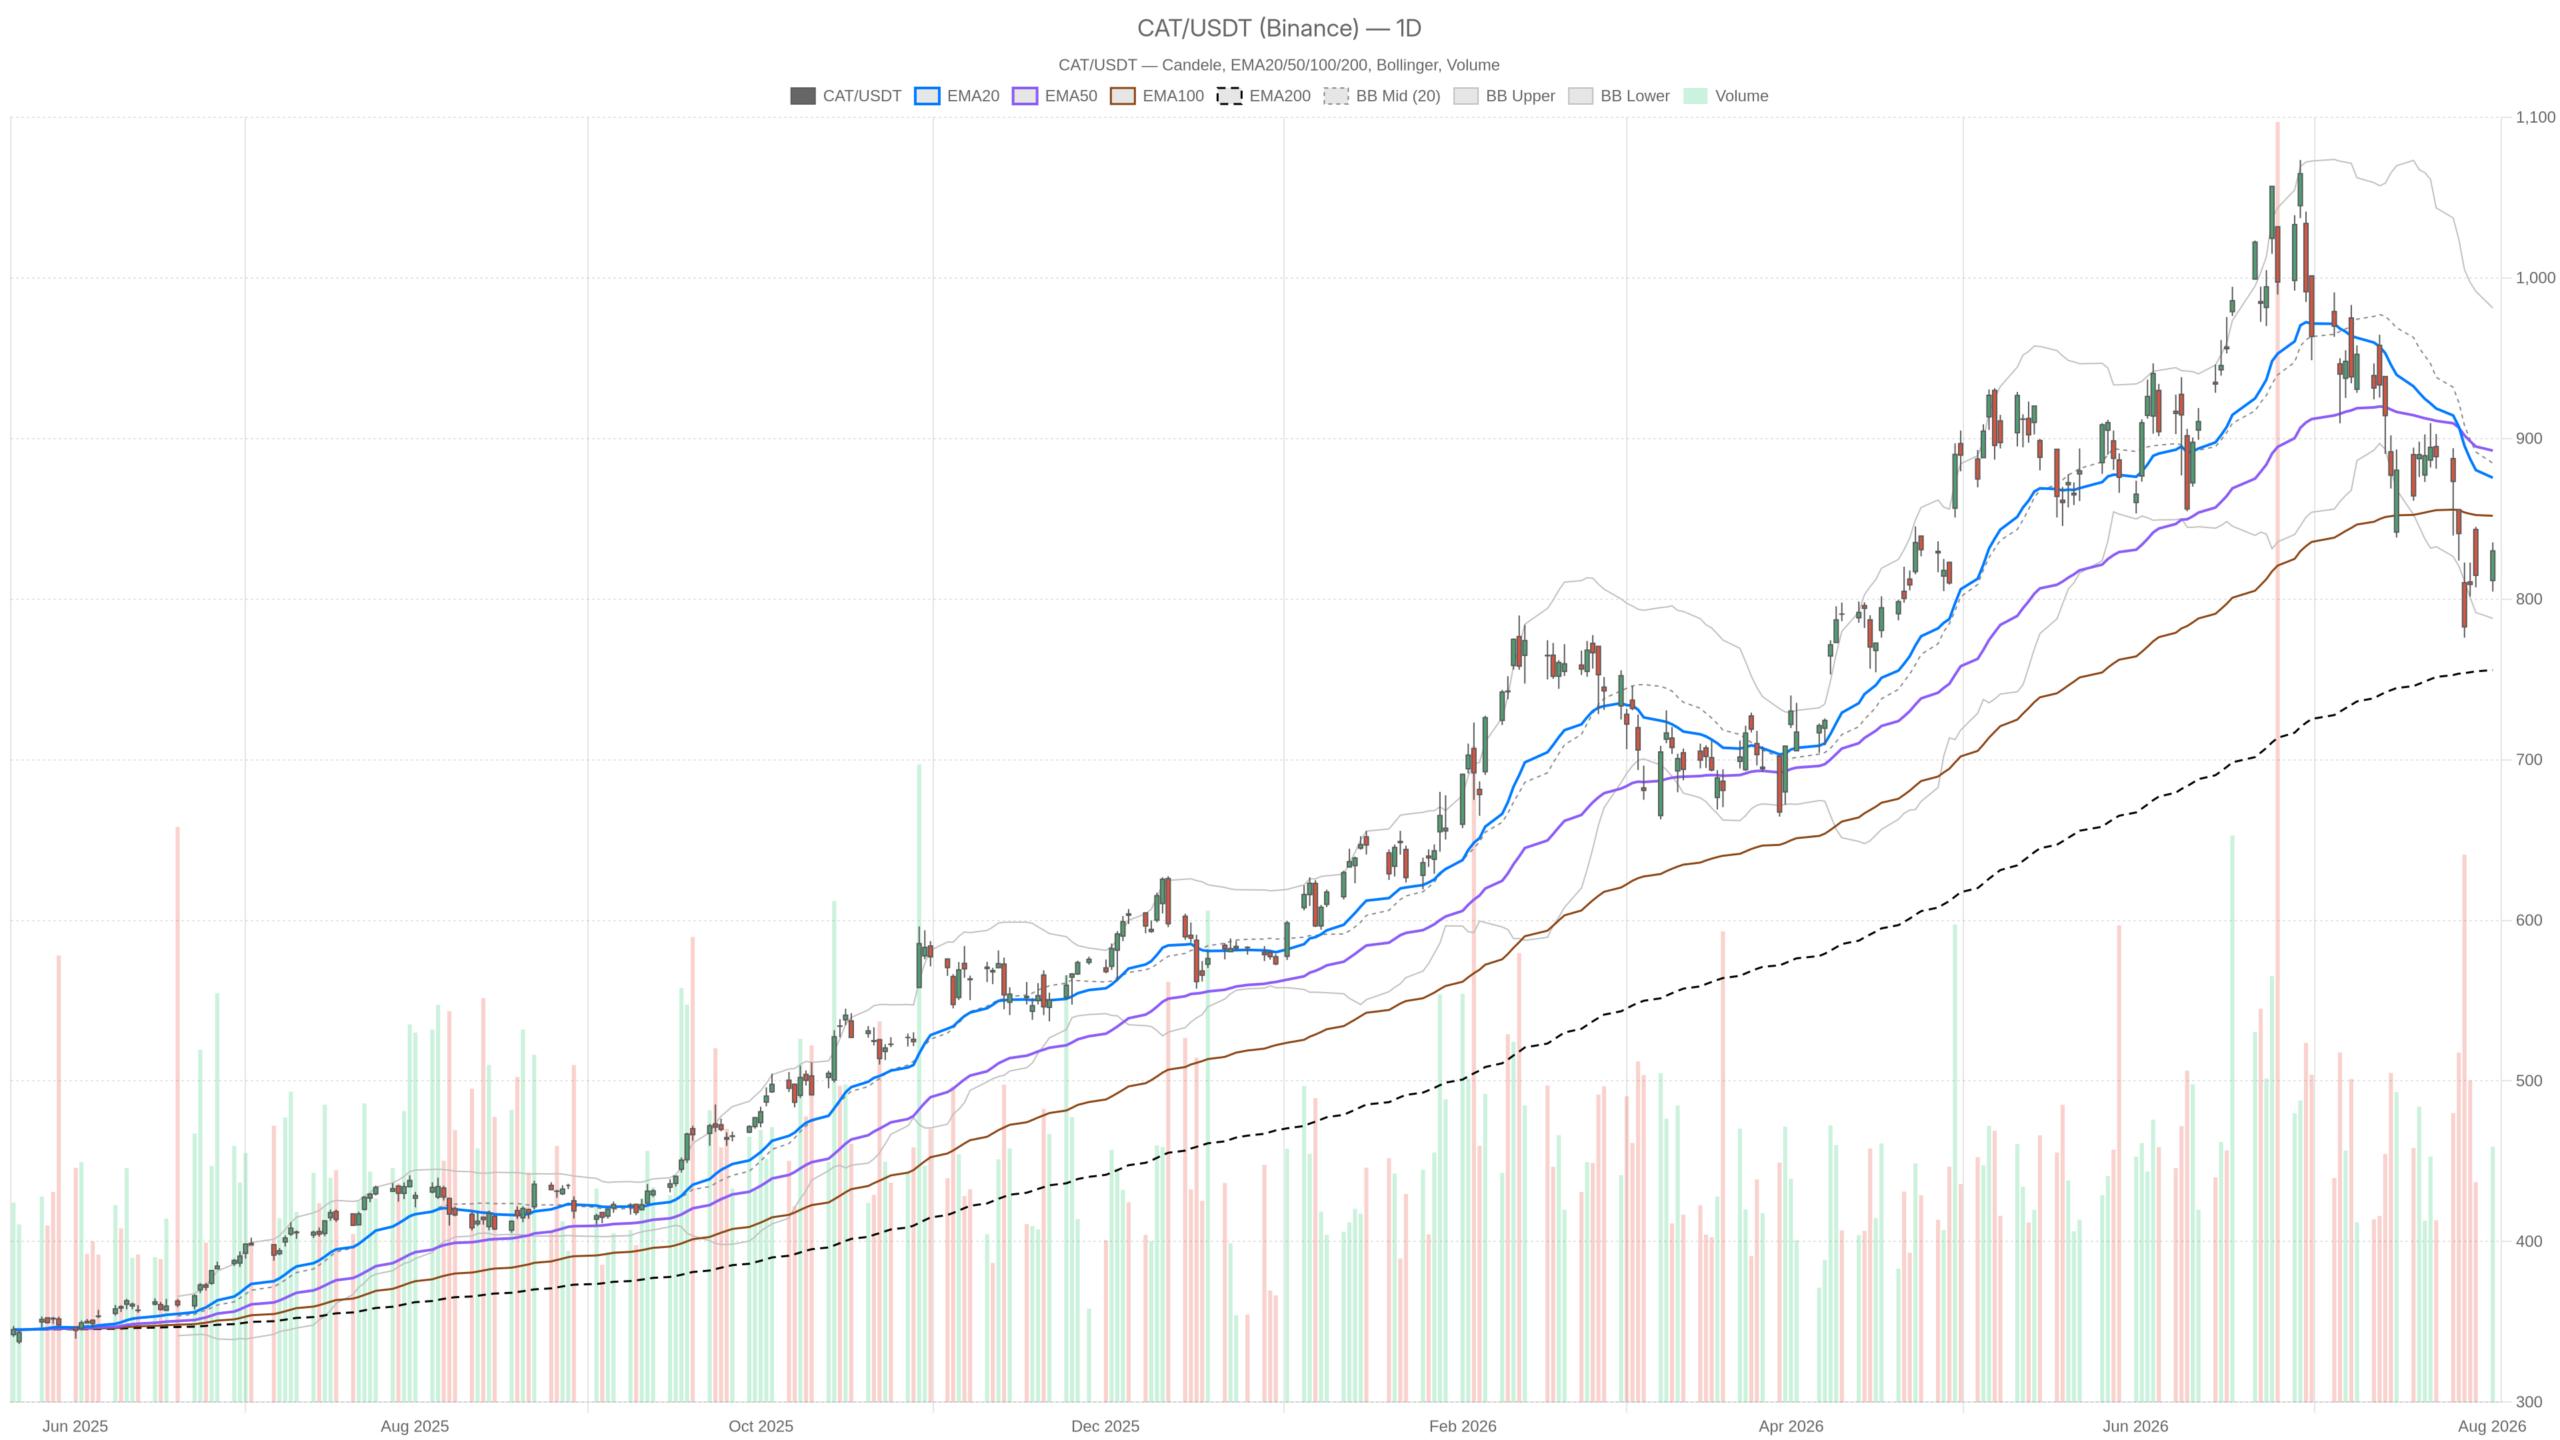 CAT — daily chart with candlesticks, EMA20/EMA50 and volume.
Key takeaways
- CAT closed at 830.03 after beating Q2 earnings, but trades below both its 20-day EMA and 50-day EMA.
- The daily RSI14 sits at 39.55 with a widening negative MACD histogram, confirming bearish momentum.
- Caterpillar’s order backlog reached a record $63 billion, driven by AI-related power demand.
- Key resistance sits at 834–842; a break below 811.38 would put sellers back in control.
- Daily ATR14 at 40.79 signals elevated volatility in the sessions ahead.
Daily Chart: Caterpillar Stock Under Pressure
CAT is under clear daily pressure. The stock trades below its 20-day EMA at 875.57 and its 50-day EMA at 892.48. It still holds above the 200-day EMA at 755.80. This configuration points to a long-term uptrend now working through a sharp intermediate pullback. The break below the shorter EMAs is the more immediate concern for trend-followers.
Momentum confirms the cautious read. The daily RSI14 sits at 39.55, firmly in weak territory without reaching oversold extremes. Meanwhile, the daily MACD line at -32.91 remains below its signal line of -24.01, producing a negative histogram of -8.9. That widening histogram signals bearish momentum is still building, not fading.
The Bollinger Bands reinforce this picture. Price at 830.03 trades well below the mid-band at 884.66 and closer to the lower band at 788.04. This location is typically associated with corrective pressure rather than a healthy uptrend. Notably, daily ATR14 stands at 40.79, underlining elevated volatility around the earnings reaction. Pivot levels sit at 823.36 for the pivot, 842.01 for R1, and 811.38 for S1. This places Tuesday’s close in the upper half of that near-term range.
Hourly Timeframe: A Tactical Bounce Emerges
In contrast to the daily picture, the hourly chart shows a tactical bounce is underway. Price at 831.32 sits above the 1H EMA20 at 821.86. However, it remains below the EMA50 at 834.21 and well below the EMA200 at 890.89. The EMA200 reading confirms the broader hourly trend has been down into this level, even as the very short-term tape stabilizes.
Notably, the hourly RSI14 has recovered to 56.41, a modest bullish reading. The hourly MACD has crossed above its signal line at 0.82 versus -2.63, producing a positive histogram of 3.46. That crossover is a classic short-term bullish signal. Therefore, the hourly timeframe contradicts the daily bias by showing a tactical bounce off the earnings reaction low.
The hourly Bollinger Bands support this reading. Price sits near the upper band at 834.42, with a midline of 817.69 and a lower band of 800.96. Hourly ATR14 is 10.16, notably calmer than the daily reading. This fits a market digesting the earnings move rather than extending it aggressively. Hourly pivot levels sit at 832.08 for the pivot, 834.58 for R1, and 828.82 for S1. This means price is testing resistance just under that pivot point.
15-Minute Chart: Resistance Testing with Fading Momentum
On the 15-minute chart, price is testing resistance with momentum fading. At 831.32, CAT sits above both the EMA20 at 827.54 and EMA50 at 822.70 but just below the EMA200 at 834.48. That EMA200 level aligns closely with hourly R1 and pivot resistance, creating a tight decision zone just above current price.
The 15-minute RSI14 reads 60.83, consistent with the short-term bullish tone on the hourly chart. However, the 15-minute MACD histogram has narrowed to just 0.14. The MACD line at 2.82 sits barely above the signal line at 2.69. That flattening histogram suggests short-term bullish momentum is losing steam right at resistance, rather than accelerating through it.
The 15-minute Bollinger mid-band is 826.92, with price pressing toward the upper band at 834.56. The 15-minute pivot sits at 832.53 and R1 at 834.13. The market appears to be pausing directly beneath a well-defined short-term ceiling.
Bullish Scenario: What Would Confirm a CAT Recovery
A bullish continuation for Caterpillar stock requires a clean break above the 834 to 842 zone. This is where hourly R1, 15-minute R1, and the daily R1 pivot at 842.01 all cluster. A move through that band with follow-through buying would start repairing the daily picture. In this scenario, the daily RSI14 would need to climb back above the 40–45 area.
The fundamental narrative supports this case. The $63 billion record order backlog tied to AI power demand and the earnings beat provide a credible catalyst for renewed buying. Still, a daily close back above the 875.57 EMA20 would be the more meaningful confirmation that the pullback has truly ended.
Bearish Scenario: When the Bounce Would Fail
The bearish case treats the hourly bounce as a relief rally inside a larger daily downtrend. A rejection near the 834 to 842 resistance cluster, followed by a break below daily S1 at 811.38, would put sellers back in control. That outcome would align with the still-negative daily MACD histogram. Price would likely be dragged back toward the lower Bollinger region near 788.04.
In contrast to the earnings optimism, it is worth noting that Seeking Alpha flagged a Baird downgrade alongside the earnings preview. This serves as a reminder that not all analyst sentiment has turned uniformly positive despite the headline beat.
Positioning and Volatility: Key Levels to Watch
Caterpillar stock is caught between two conflicting timeframes. The daily chart is still working off downside momentum while the hourly tape attempts to stabilize after a strong earnings print. This divergence is not unusual right after a results release. However, it does argue for caution rather than conviction in either direction.
Overall, the technical setup remains genuinely mixed despite clear fundamental strength. The record order backlog and data center-driven power demand are meaningful tailwinds, but they have not yet translated into a repaired daily chart. Given the elevated daily ATR14 near 40.79, volatility is likely to stay high in the sessions ahead. The 834 to 842 resistance band and the 811 support level are the key markers that will determine which timeframe’s signal ultimately prevails.
FAQ
Is Caterpillar stock in a downtrend?
On the daily timeframe, CAT is in a corrective phase. Price trades below both the 20-day EMA at 875.57 and 50-day EMA at 892.48, with a daily RSI14 at 39.55 and a widening negative MACD histogram. However, the stock remains above its 200-day EMA at 755.80, keeping the long-term uptrend structurally intact.
What are the key levels for CAT stock right now?
The critical resistance zone is 834 to 842, where hourly R1, 15-minute R1, and the daily R1 pivot converge. On the downside, 811.38 (daily S1) serves as key support. Below that, the lower Bollinger band near 788.04 becomes the next target for sellers.
What is driving Caterpillar’s fundamental strength?
Caterpillar reported a record order backlog of $63 billion, with AI-driven power demand cited as a key driver. The power-generation business continues expanding on the back of data center spending. Additionally, Caterpillar is advancing autonomous heavy equipment through testing with WM for landfill operations.
Does the post-earnings bounce change the bearish outlook?
Not yet. The hourly bounce shows tactical improvement with RSI at 56.41 and a bullish MACD crossover, but the 15-minute MACD histogram is already flattening near resistance. A daily close above the 875.57 EMA20 would be needed to confirm a meaningful trend shift.
Disclaimer: This article is for informational purposes only and does not constitute financial advice, an investment recommendation, or a solicitation to buy or sell any financial instrument or cryptocurrency. The analysis provided is not indicative of future results. Investing in crypto assets and financial markets carries a high risk of capital loss. Always do your own research (DYOR) and consult a qualified financial advisor before making any decision.
Article produced with the assistance of artificial intelligence and reviewed by the editorial team.









 English (US) ·