
 1 month ago
95
1 month ago
95

The bias on Cloudflare, Inc. stock remains bullish after NET closed at $284.43 on 6 August, holding above stacked moving averages. Q2 results beat estimates after the close, sending shares sharply higher — but the intraday tape had already turned defensive into the print.
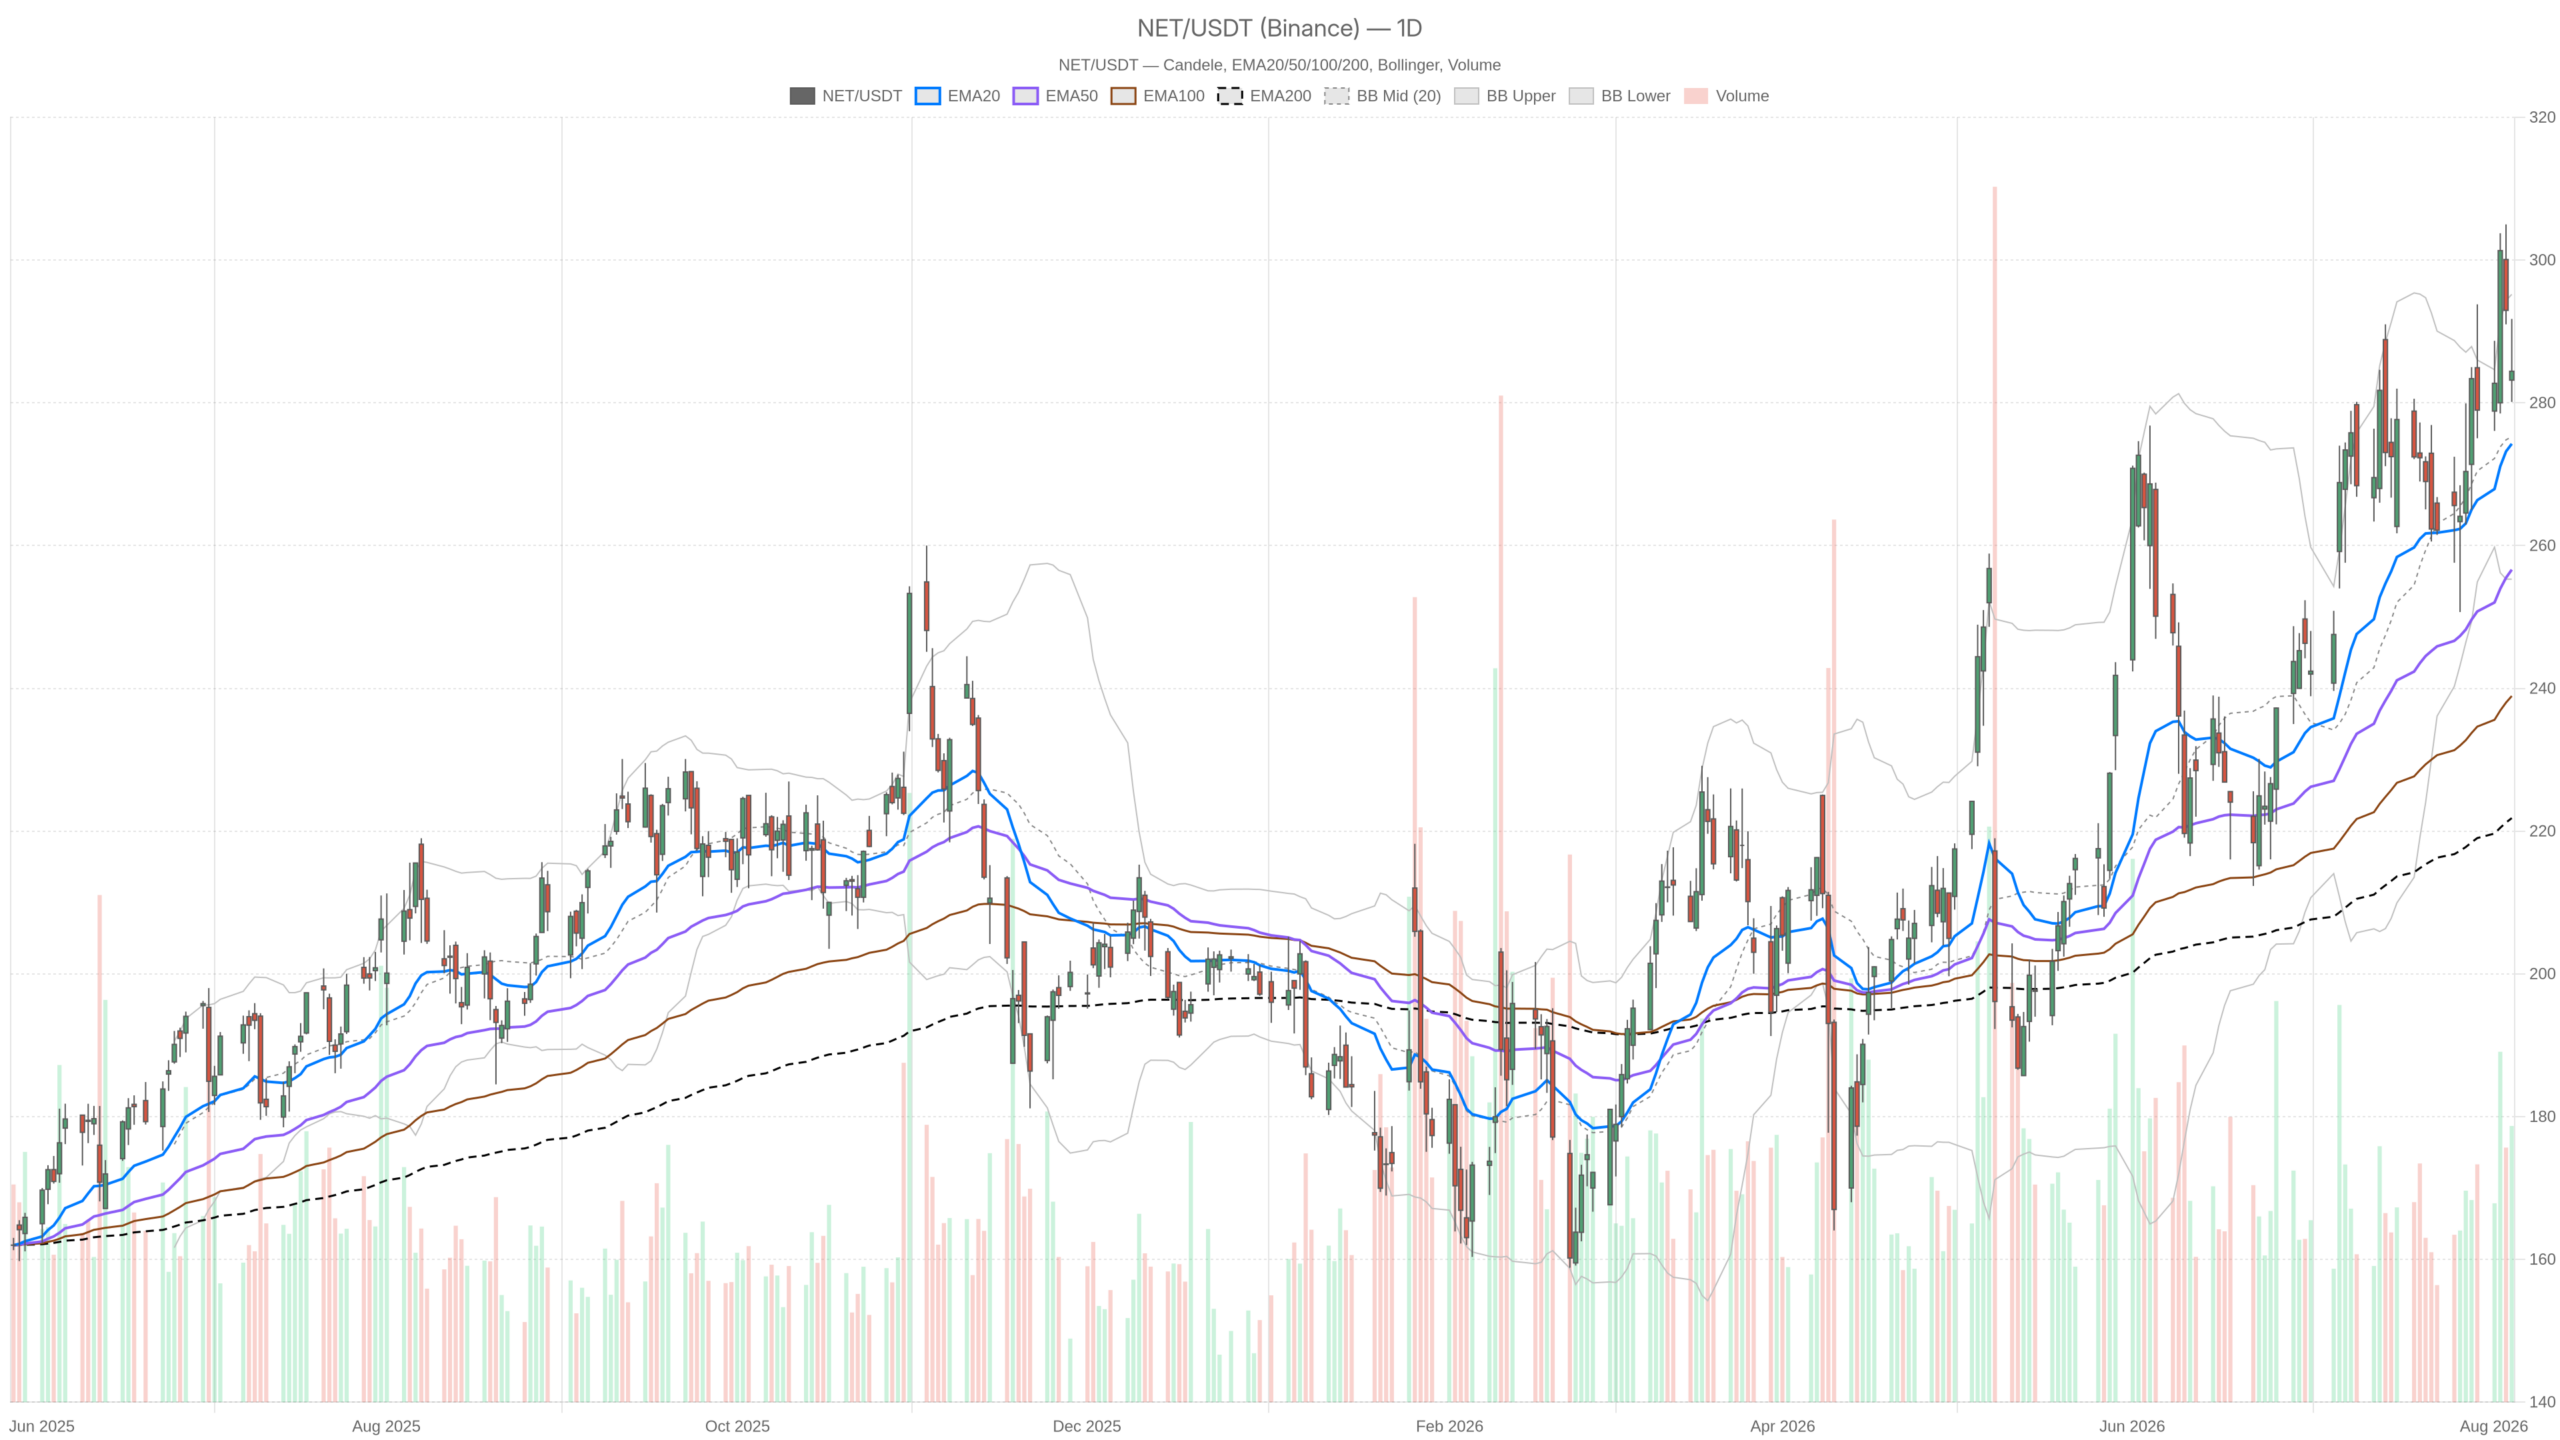 NET — daily chart with candlesticks, EMA20/EMA50 and volume.
Key takeaways
- NET closed at $284.43 on 6 August, with the daily chart holding above all major moving averages.
- Cloudflare reported Q2 revenue of $696.1 million, up 35.9% year on year, beating Wall Street expectations.
- Management raised full-year guidance and set next-quarter revenue at $736.5 million, 2.1% above analyst estimates.
- Shares surged 14.9% in after-hours trading, repricing the stock before the next regular session.
- Daily ATR stands at 14.20, meaning wide intraday swings are normal and position sizing must account for that.
Daily structure keeps the trend intact
The daily chart confirms Cloudflare, Inc. stock remains in a textbook uptrend, with price well above all three key moving averages. The hierarchy reflects a mature advance, not a fragile bounce.
Price sits above the 20-day EMA at $274.26. That average in turn sits above the 50-day at $256.63. The 200-day rests at $221.82. The spread between the 50 and 200 EMA is wide — the hallmark of a trend with structural depth.
Momentum and volatility confirm the setup
Daily RSI at 58.67 supports the same read. Momentum is positive but not stretched. This leaves room to extend before overbought conditions become a constraint. MACD is also constructive, with the line at 10.03 above its signal at 9.16. A small positive histogram of 0.87 confirms the move. Notably, however, the histogram is thin — upward momentum is still present, yet it is decelerating rather than accelerating.
Meanwhile, Bollinger Bands frame the range well. The daily midline sits at $275.25 and the upper band at $295.20. Friday’s high of $291.75 pushed toward that upper boundary, but buyers could not hold the advance during the session. The close came back to $284.43.
Daily ATR of 14.20 is the number to respect here. That is a wide average range for a single session. Position sizing on Cloudflare, Inc. stock must account for this. A normal day can travel more than $14 without anything unusual happening.
The 1H chart weakens the immediate momentum case
The hourly chart shows Cloudflare, Inc. stock has lost short-term drive, with price now below both near-term EMAs heading into the catalyst. The medium-term uptrend remains intact, but the last leg has stalled.
On the hourly, price at $284.43 sits below the 20-period EMA of $289.15. It also rests below the 50-period EMA of $285.17. The 200-period EMA at $270.18 is still far below, keeping the broader uptrend unbroken. Still, the short-term structure has rolled over.
Indicators point to intraday fatigue
Hourly RSI at 41.26 confirms that loss of drive. It sits in the lower half of its range without reaching oversold levels. MACD is more explicit. The line has crossed below the signal, at -0.49 versus 1.60. The histogram reads -2.09. That is an active bearish momentum shift on the intraday timeframe.
Meanwhile, the hourly Bollinger picture reinforces the fade. The midline sits up at $293.61, well above spot. Price is grinding near the lower band at $280.75. The market spent the final hours of the session in the weaker half of its own volatility range. Hourly ATR of 4.31 keeps the noise level meaningful, but not extreme.
The conflict is therefore clear. Daily says trend up. Hourly says the last leg has stalled and sellers controlled the closing hours. That is a pause inside an uptrend, not a reversal signal.
15m execution context
The 15-minute chart presents the most balanced picture, with Cloudflare, Inc. stock closing almost exactly on its intraday equilibrium levels. Compression into the close suggests the market was waiting for the catalyst.
The 15-minute timeframe is the most balanced of the three. Price closed almost exactly on the 200-period EMA at $284.39. It also landed on the Bollinger midline at $284.72. Above it, the 20-period EMA at $285.36 and the 50-period at $288.58 mark the immediate barriers.
At the same time, short-term momentum is beginning to curl higher. The 15-minute MACD histogram has turned positive at 0.43. The line at -1.84 sits above its signal at -2.27. RSI at 43.31 is recovering from weakness rather than breaking down. With ATR at just 1.72, the intraday range had compressed into the close — typical behaviour ahead of a scheduled catalyst.
The fundamental catalyst behind Cloudflare, Inc. stock
Cloudflare, Inc. stock’s post-close surge was driven by a clean Q2 beat and an upward guidance revision tied to AI-driven demand. The results align with a chart that was already structurally bullish.
Q2 CY2026 revenue came in at $696.1 million, up 35.9% year on year. The result landed ahead of Wall Street expectations. Guidance for the next quarter was set at $736.5 million at the midpoint. That figure sits 2.1% above analyst estimates. Management also raised the full-year outlook, citing AI-driven demand. The shares jumped 14.9% on the report.
That is a fundamentally aligned outcome for a chart already in an uptrend. The 5 August launch of the Identity-Aware AI Gateway adds to the same narrative around enterprise AI visibility. However, the technical readings above predate the post-close move. The intraday resistance levels are therefore likely to be repriced quickly once regular trading resumes.
Bullish scenario
The bullish path for Cloudflare, Inc. stock requires reclaiming the hourly EMA cluster and converting the earnings gap into sustained upside. Given the guidance raise, this remains the higher-probability outcome.
The constructive path is straightforward. Bulls need price to reclaim the hourly EMA cluster around $285.17 to $289.15 and hold there. Above that, the daily pivot at $285.44 and R1 at $290.75 become the first objectives. The daily upper band at $295.20 follows.
Confirmation would come from the hourly MACD histogram flipping back positive. RSI would also need to push back above the midline. Given the guidance raise and the size of the after-hours move, that reclaim is the higher-probability outcome. A sustained close above $295.20 would put the stock into fresh expansion territory.
Bearish scenario
The bearish case for Cloudflare, Inc. stock hinges on a failure to convert the earnings beat into follow-through buying. Key support sits at the daily S1 level, with the 20-day EMA below forming the real defensive zone.
The bearish case rests on failure to convert the news into follow-through. If the gap higher is sold and price slips back under the daily S1 at $279.12, the short-term picture deteriorates. The hourly lower band at $280.75 serves as the first warning line.
Below that, the daily 20 EMA at $274.26 and the Bollinger midline at $275.25 form the real defensive zone. A decisive break there would invalidate the immediate bullish case. Attention would then shift toward the 50-day EMA at $256.63. However, nothing in the current data points to that outcome yet — the trend structure is intact and RSI is not diverging.
Positioning and volatility
Cloudflare, Inc. stock enters the post-earnings session in a bullish trend that is momentarily out of step with itself. Patience is essential before assuming the next leg is confirmed.
Overall, this is a bullish trend momentarily out of step with itself. The daily framework argues for continuation. The hourly argues for patience. The 15-minute chart shows compression resolving into a catalyst. The main uncertainty is not direction. It is the quality of the follow-through after a 14.9% repricing.
Volatility deserves particular respect here. With daily ATR at 14.20 and an earnings gap in play, reference levels will move fast. Stops placed too close to spot risk being triggered by noise alone. For anyone tracking Cloudflare, Inc. stock, the practical task is to let the post-earnings range establish itself before assuming the next leg is confirmed.
FAQ
What is the current trend for Cloudflare, Inc. stock?
The daily trend for Cloudflare, Inc. stock remains bullish. NET closed at $284.43 on 6 August, holding above the 20-day EMA at $274.26, the 50-day EMA at $256.63, and the 200-day EMA at $221.82. Daily RSI at 58.67 supports the positive momentum without being overbought.
What were Cloudflare’s Q2 earnings results?
Cloudflare reported Q2 CY2026 revenue of $696.1 million, up 35.9% year on year and ahead of Wall Street expectations. Management guided for $736.5 million in the next quarter, 2.1% above analyst estimates, and raised the full-year outlook citing AI-driven demand. The stock surged 14.9% in after-hours trading.
What are the key support levels for NET stock?
Key support sits at the daily S1 level of $279.12 and the hourly lower Bollinger band at $280.75. Below that, the daily 20 EMA at $274.26 and the Bollinger midline at $275.25 form the main defensive zone. A decisive break beneath those levels would shift attention to the 50-day EMA at $256.63.
What is the bullish scenario for Cloudflare shares?
The bullish scenario requires NET to reclaim the hourly EMA cluster between $285.17 and $289.15. Above that, the daily pivot at $285.44 and R1 at $290.75 become the first targets. A sustained close above the daily upper Bollinger band at $295.20 would confirm a move into fresh expansion territory.
Disclaimer: This article is for informational purposes only and does not constitute financial advice, an investment recommendation, or a solicitation to buy or sell any financial instrument or cryptocurrency. The analysis provided is not indicative of future results. Investing in crypto assets and financial markets carries a high risk of capital loss. Always do your own research (DYOR) and consult a qualified financial advisor before making any decision.
Article produced with the assistance of artificial intelligence and reviewed by the editorial team.







 English (US) ·