
 3 months ago
37
3 months ago
37
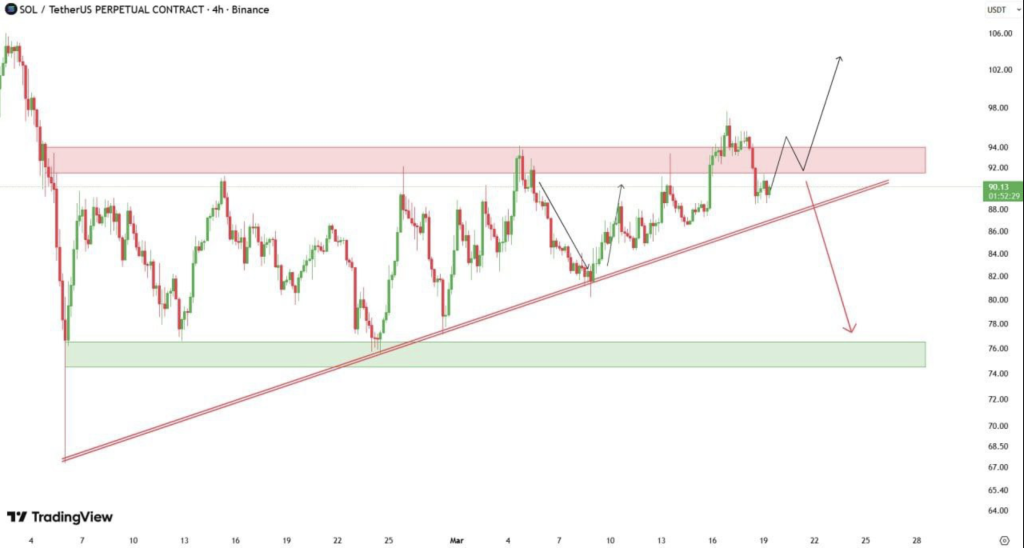
- Solana is consolidating below $95 resistance, forming a squeeze pattern
- Momentum indicators show early signs of weakness despite bullish structure
- Break above $95 could push SOL toward $100+, while failure may lead to $75 support
Solana is starting to feel… compressed. Price keeps hovering just under that $92–$95 resistance zone, and with each attempt, the tension builds a little more. It hasn’t broken through, but importantly, it hasn’t broken down either, which keeps things interesting.
There’s still a sense that buyers are holding the line. Even after multiple rejections, SOL hasn’t slipped into any real weakness, and that alone suggests there’s some underlying strength, at least for now.
Buyers Step In Earlier, But Resistance Still Holds
One thing that stands out is how price is behaving on dips. Instead of pulling back sharply, Solana is following an ascending trendline, with buyers stepping in sooner each time. That kind of structure usually points to quiet accumulation, not panic selling.
It’s subtle, but it matters. The market is slowly squeezing price into that resistance zone, almost like it’s preparing for something. If SOL manages to break above $95 and actually hold it, the move could accelerate quickly toward $100, maybe even $105 without much hesitation.
But, and there’s always a “but”… if that trendline gives way, things could flip fast. A drop toward the $78–$75 area wouldn’t be surprising in that case.
A Classic Squeeze Setup Forms
What’s developing here looks a lot like a squeeze. Price is tightening, volatility is shrinking, and both sides, buyers and sellers, are getting pushed closer together. These setups don’t last forever.
When the breakout comes, whichever direction it goes, it’s usually not slow. It tends to move fast, sometimes faster than expected. Right now, the chart is basically coiling.
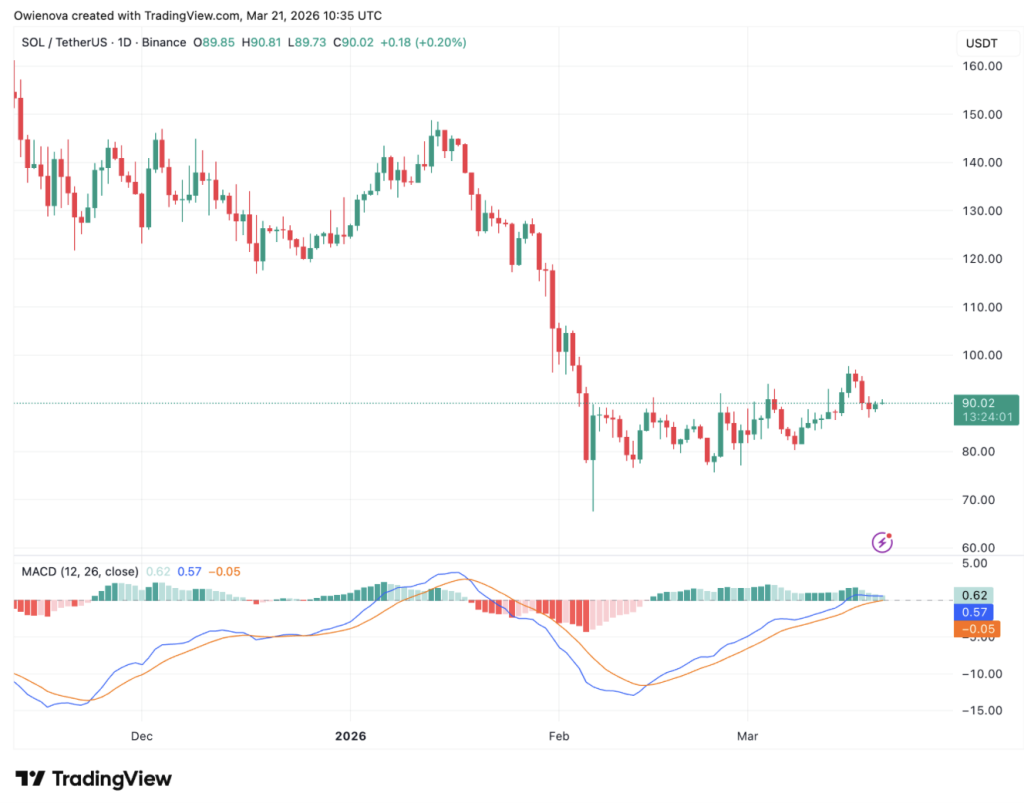
Momentum Weakness Starts to Show Beneath the Surface
At the same time, not everything is as strong as it looks. There’s a subtle shift happening in momentum, particularly on the USDT pair. RSI has started to fade there, which can be an early sign that buying strength is losing some energy.
What makes this more interesting is that the BTC pair hasn’t shown the same weakness yet. That kind of divergence is… a bit unusual. Normally, weakness shows up in the BTC pair first. When it appears in USDT instead, it can mean the underlying momentum is deteriorating faster than expected.
Warning Signs Build Despite Potential Upside
Solana recently pushed toward $97 but didn’t have strong volume behind the move, which raises some doubts. A move toward $100 or even $101 is still possible, but if that happens with weak momentum, it could actually form a bearish divergence rather than a continuation signal.
And if the BTC pair eventually breaks below its key level, both pairs could start moving lower together. That’s when things usually accelerate. In that scenario, downside targets around $77 come into play, with deeper levels near $67 not completely off the table.
A Market on the Edge of Decision
So here we are. Solana is sitting right at that edge, not breaking out, not breaking down, just building pressure. There’s still a bullish structure in place, but cracks are starting to show underneath.
It’s one of those moments where the next move probably won’t be subtle. Either SOL clears $95 and runs… or the weakness takes over and pulls it lower.
For now, it’s a waiting game. But not a quiet one.
Disclaimer: BlockNews provides independent reporting on crypto, blockchain, and digital finance. All content is for informational purposes only and does not constitute financial advice. Readers should do their own research before making investment decisions. Some articles may use AI tools to assist in drafting, but every piece is reviewed and edited by our editorial team of experienced crypto writers and analysts before publication.


 English (US) ·