
 3 hours ago
19
3 hours ago
19

Dell Technologies Inc. stock surged to 484.50 on August 12, touching an intraday high of 484.70 on heavy volume of 6.16 million shares. The move pushed price against the daily upper Bollinger Band, confirming a sharp, news-driven breakout with bulls firmly in control across all timeframes.
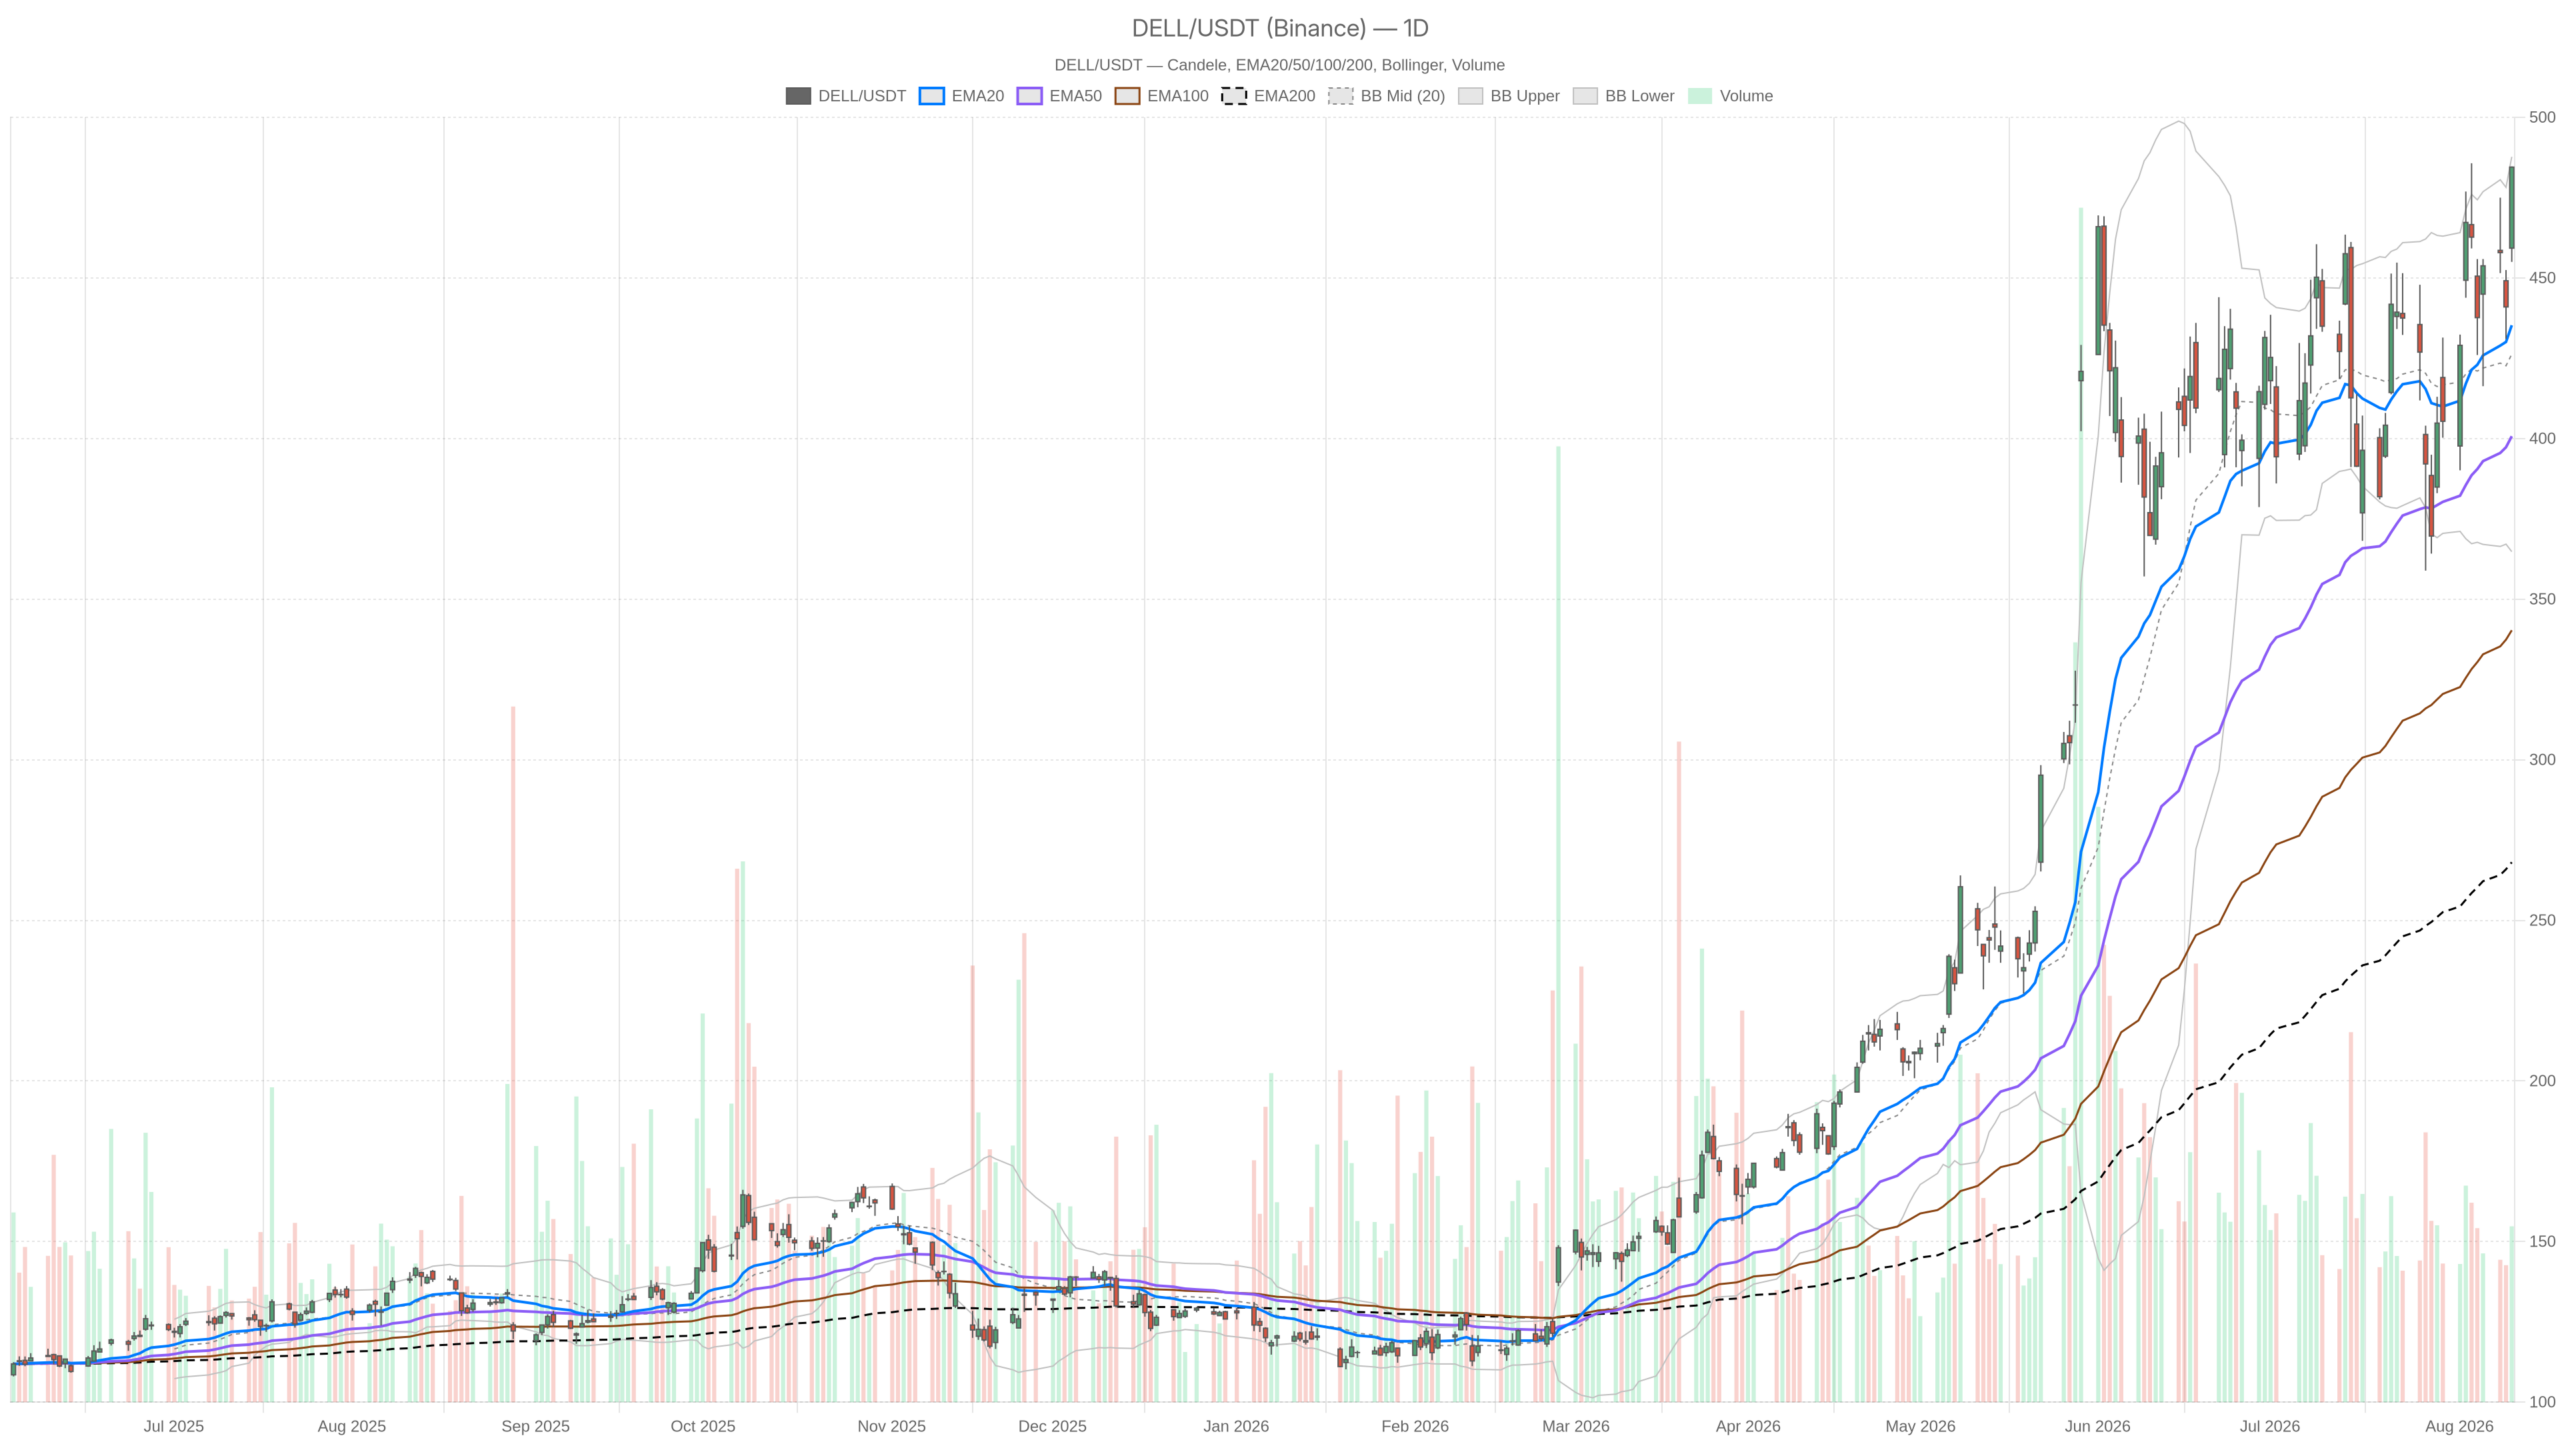 DELL — daily chart with candlesticks, EMA20/EMA50 and volume.
Key takeaways
- Dell Technologies Inc. stock closed at 484.50, pressing against the daily upper Bollinger Band at 487.72.
- Daily RSI at 61.11 leaves room for upside, but the hourly RSI at 70.88 and 15-minute RSI at 79.45 signal overbought conditions.
- Volume of 6.16 million shares confirms strong institutional participation behind the breakout.
- The rally was catalyzed by AI server demand guidance from Super Micro Computer, which lifted the entire hardware sector.
- Daily ATR at 36.83 reflects sharply expanded volatility, meaning wider swings should be expected in either direction.
The catalyst behind the move is straightforward. Super Micro Computer delivered what has been described as blowout AI server guidance, and the entire hardware sector moved in sympathy. Reports noted Dell gaining 5% alongside a 13% advance for Super Micro and a 3% rise for HPE. Investors treated SMCI’s numbers as a live demand barometer for the whole AI server space. Meanwhile, separate coverage flagged Dell’s AI server business growing at a 757% pace, with a $60 billion target being floated. However, margin compression beneath those headline numbers remains an open question. A Zacks analyst note added that Dell trades at a premium, but argued that soaring AI server demand, a record backlog, and a broad portfolio could support further growth.
Daily Trend Structure Confirms the Bullish Regime for Dell Technologies Inc. Stock
The daily chart presents an unambiguous bullish picture. Price holds well above all major moving averages, with momentum still building and no signs of exhaustion on this timeframe.
Moving Average Alignment Points to Expanding Bullish Structure
On the daily chart, the technical picture is unambiguous. Price sits well above the EMA20 at 435.27, the EMA50 at 400.72, and the EMA200 at 268.08. That kind of separation across averages signals a textbook expanding bullish structure. It tells you this is not a one-day spike sitting on a flat trend. Rather, it is a sustained advance that has been building for some time. The EMA200, sitting far below current price, underscores how far Dell Technologies Inc. stock has already traveled.
Momentum and Volatility: Room to Run, But Bands Are Tight
The daily RSI14 reads 61.11, which is firmly bullish but not yet stretched into extreme territory. Momentum on this timeframe still has room to run before it becomes a concern. The MACD line at 15.04 sits above its signal line at 10.98, with a positive histogram of 4.06. This confirms daily momentum is not just present but still building. Meanwhile, the daily Bollinger setup shows the mid-band at 426.25 and the upper band at 487.72. Wednesday’s close of 484.50 sits just below that upper boundary. Price is pressing against the ceiling of its own volatility envelope. This typically signals strength but also raises the odds of a near-term pause before the next leg.
Daily ATR14 stands at 36.83, a large figure that underscores just how wide the trading ranges have become. Volatility has clearly expanded alongside the rally. On the pivot framework, price closed above the daily pivot point of 474.73. It is now closing in on R1 at 494.47, while S1 support sits at 464.77. As long as price holds above that pivot, the daily bias remains constructive.
1H Timeframe: Trend Intact, But Overbought Signals Surface
The hourly chart confirms the uptrend is intact, but it also surfaces the first genuine overbought warning. RSI has climbed to 70.88, suggesting the rally may need a short pause to digest recent gains.
The hourly moving averages are all stacked in bullish order. EMA20 at 460.93, EMA50 at 451.56, and EMA200 at 429.49 confirm the uptrend on this shorter horizon. However, the hourly RSI14 at 70.88 marks a genuine overbought reading. This is where the first crack in an otherwise clean bullish narrative appears. The hourly MACD line at 6.57 remains above its signal at 3.06, with a histogram of 3.52. So momentum is still positive and expanding on this timeframe.
At the same time, the hourly Bollinger Bands show price at 484.50 pressing right against the upper band at 486.97, with the mid-band at 458.95. That is a tight squeeze against resistance. It usually means either an acceleration higher or a short consolidation to relieve the overbought condition. The hourly pivot data has price between the pivot point at 482.13 and R1 at 487.11, essentially trading in no-man’s land just below resistance.
15-Minute Execution Context: Momentum Is Stretched
The 15-minute chart shows momentum stretched to levels that typically precede at least a short pullback or sideways digestion. RSI at 79.45 and price above the upper Bollinger Band make the overbought signal hard to ignore for near-term traders.
Zooming into the 15-minute chart, the overbought signal becomes much harder to dismiss. RSI14 here sits at 79.45, a level that typically precedes at least a short pullback or sideways digestion. Notably, price at 484.50 is trading above the 15-minute upper Bollinger Band of 481.87, with the mid-band at 470.59. That is an overextension beyond the normal volatility envelope on this timeframe. It is a classic sign of a market running hot in the very short term.
The 15-minute MACD histogram has narrowed to just 0.66, well below the hourly histogram of 3.52. This divergence between timeframes is worth flagging. While the hourly and daily charts still show expanding momentum, the 15-minute momentum is decelerating even as price grinds higher. In practice, this suggests the immediate move is losing some steam. The broader trend across daily and hourly frames, however, remains unquestionably bullish. Signals across timeframes are not contradictory in direction, but they are certainly out of sync in intensity.
Bullish Scenario: AI Server Tailwinds Target 494.47 and Beyond
The bullish case targets the daily R1 at 494.47 and beyond, provided Dell Technologies Inc. stock holds above the daily pivot at 474.73. Sustained AI server demand and sector-wide sympathy buying support this path forward.
The bullish case rests on the daily structure holding above the pivot at 474.73 and the EMA20 at 435.27. If the AI server demand narrative continues to be validated by peers like Super Micro and HPE, the path toward the daily R1 at 494.47 remains open. A breakout above the daily upper Bollinger Band at 487.72 would reinforce that the rally has further legs. This would carry more weight if it occurs on strong volume similar to the 6.16 million shares seen on the latest session. Notably, if Dell’s record backlog translates into confirmed revenue rather than just guidance, upside momentum could accelerate further.
Bearish Scenario: Overbought Signals and Margin Concerns
The bearish case hinges on overbought signals across shorter timeframes and a potential rejection at the upper Bollinger Bands. A break below the daily S1 at 464.77 would materially weaken the short-term structure, even if the broader trend remains intact.
On the other hand, the overbought readings on both the hourly RSI at 70.88 and the 15-minute RSI at 79.45 are legitimate warning signs for near-term traders. A rejection at the daily and hourly upper Bollinger Bands, combined with a loss of the hourly EMA20 at 460.93, would be the first sign that momentum is fading rather than pausing. If price were to break below the daily S1 at 464.77, that would materially weaken the short-term bullish structure. The broader daily trend defined by the EMA200 at 268.08 would still remain intact. However, the margin compression concerns flagged in coverage of Dell’s AI server growth also represent a fundamental risk. These could resurface if upcoming results fail to match the pace of guidance from peers like Super Micro.
Closing Take
Overall, Dell Technologies Inc. stock presents a structurally bullish daily and hourly setup, driven by a powerful sector narrative around AI server demand. However, the 15-minute chart’s extreme RSI reading and its position above the upper Bollinger Band suggest the stock is due for at least a short pause. Elevated daily ATR at 36.83 confirms that volatility has expanded meaningfully alongside this rally. Swings in either direction are likely to be sharper than usual. Given the overbought short-term signals layered on top of a structurally bullish daily and hourly setup, positioning discipline and awareness of volatility will matter more than usual in the sessions ahead.
FAQ
What is driving Dell Technologies Inc. stock higher?
The primary catalyst is surging AI server demand, highlighted by Super Micro Computer’s blowout guidance that lifted the entire hardware sector. Dell gained 5% in sympathy, with its AI server business reportedly growing at a 757% pace and a $60 billion target being discussed. A record backlog and broad portfolio further support the bullish narrative.
Is Dell Technologies Inc. stock overbought right now?
It depends on the timeframe. The daily RSI at 61.11 remains firmly bullish with room to run. However, the hourly RSI at 70.88 and the 15-minute RSI at 79.45 both flash overbought signals. Price is also pressing against upper Bollinger Bands on multiple timeframes, suggesting a near-term pause or consolidation is likely.
What are the key support levels to watch for Dell Technologies Inc. stock?
The nearest support is the daily pivot point at 474.73. Below that, the daily S1 at 464.77 represents a critical level—a break there would materially weaken the short-term bullish structure. The hourly EMA20 at 460.93 and the daily EMA20 at 435.27 provide deeper support zones.
What is the bullish price target for Dell Technologies Inc. stock?
The immediate bullish target is the daily R1 resistance level at 494.47. A breakout above the daily upper Bollinger Band at 487.72 on strong volume would confirm the rally has further legs and open the path beyond R1.
Disclaimer: This article is for informational purposes only and does not constitute financial advice, an investment recommendation, or a solicitation to buy or sell any financial instrument or cryptocurrency. The analysis provided is not indicative of future results. Investing in crypto assets and financial markets carries a high risk of capital loss. Always do your own research (DYOR) and consult a qualified financial advisor before making any decision.
Article produced with the assistance of artificial intelligence and reviewed by the editorial team.








 English (US) ·