
 1 hour ago
14
1 hour ago
14
Key Highlights
- DOGE currently sits at approximately $0.083, reflecting a 2% decline over the last 24 hours, with total market capitalization reaching $14.21 billion.
- Blockchain analytics reveal approximately 30 billion DOGE tokens were last moved near the $0.081 price point, establishing a significant cost-basis support level.
- Market analyst Ali Charts reports the Tom DeMark Sequential indicator has issued a buy signal for DOGE — notably, this same tool accurately forecasted a 31% price collapse in May.
- Technical indicators show bearish pressure: MACD crossed beneath its signal line, Bollinger Bands widened significantly, and price action dropped below the 20-period moving average.
- Futures market data reveals open interest declined 3.12% to $1 billion while trading volume decreased, suggesting trader caution in current conditions.
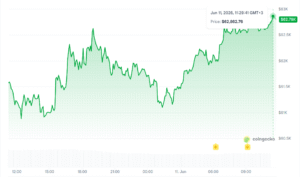
Following its May 2026 peak of $0.117, Dogecoin experienced intense selling activity that pushed the cryptocurrency through multiple technical support levels. Current data from June 11, 2026, shows DOGE changing hands at $0.08356, representing a 2.01% decrease across the previous 24-hour period. The memecoin’s market capitalization stands at $14.21 billion, accompanied by $593 million in daily exchange volume.
Technical factors have driven the recent pullback. The cryptocurrency breached its 20-period simple moving average positioned at $0.09440 and subsequently fell beneath the lower Bollinger Band threshold. A notable expansion in the Bollinger Bands occurred rapidly, signaling heightened volatility as market participants initiated selling activity.
MACD readings support the bearish interpretation. After the MACD line dropped below its signal line and entered negative territory, histogram bars expanded in size. This development suggests intensifying selling momentum rather than exhaustion.
Critical Support Zone at $0.081
Blockchain data analyst Ali Charts has highlighted $0.081 as a pivotal price threshold. Approximately 30 billion DOGE tokens changed hands at this valuation, establishing what analysts call a cost-basis concentration zone. Holders within this range are hovering near their entry prices, potentially creating buying interest should prices return to test this area.
On May 7, the Tom DeMark Sequential flashed a sell signal on Dogecoin $DOGE that preceded a 31% correction from $0.113 to $0.078.
Now the same indicator is flashing a buy signal, suggesting a rebound could be around the corner. https://t.co/PZF6Vdi85j pic.twitter.com/XsvKsJv2YQ
— Ali Charts (@alicharts) June 11, 2026
This threshold represents both a mental barrier for traders and a technical marker. Market participants are monitoring this level intently to determine whether buyer support materializes or if the floor gives way.
The analyst Ali Charts recently posted on social media that the Tom DeMark Sequential indicator generated a sell alert on May 7 — which accurately preceded a 31% downward move from $0.113 to $0.078. The same technical tool has now reversed to issue a buy signal, hinting at a possible price recovery. Ali Charts maintains significant influence in blockchain analytics circles, and this signal is garnering attention based on its recent accuracy.
Multi-Year Chart Pattern Recalls 2021 Bull Run
Cryptocurrency chartist Trader Tardigrade has identified a long-term formation on DOGE’s monthly timeframe. This configuration resembles the price action witnessed between 2014 and 2017, which came before the token’s extraordinary 2021 surge — a movement that climbed approximately 29,000% from 2015 bottom prices.
$Doge/monthly#Dogecoin is repeating the exact chart pattern from the first cycle — and it’s happening right now.
2014-2017: Consolidation → Falling Wedge → Breakout → Parabolic surge
2021-2026: Consolidation → Falling Wedge → Breakout → ?
The structure is identical.… pic.twitter.com/A7lSOscHiV
— Trader Tardigrade  (@TATrader_Alan) June 7, 2026
Dogecoin began 2021 trading near $0.004 and reached its record high in May of that year, delivering gains exceeding 18,000% within a five-month window. The chartist contends that the present falling wedge compression pattern on monthly charts echoes the identical pre-breakout formation.
The forecast scenario outlines a potential breakout phase, followed by retracement, then a more substantial expansion wave later in the market cycle. Price objectives mentioned span from $3 to $5, with possibilities for further upside.
Futures market metrics introduce additional near-term concerns. Open interest contracted 3.12% to $1 billion as trading volume slipped 7.97% to $1.35 billion.
On the adoption front, recent developments include House of Doge partnering with MoonPay to facilitate DOGE payment acceptance across more than 6,000 retail locations.
The post Dogecoin (DOGE) Price Analysis: Historic Indicator Issues Buy Signal After Predicting Previous 31% Decline appeared first on Blockonomi.


 English (US) ·