
 2 months ago
75
2 months ago
75
TLDR
- Dogecoin retested a decade-long ascending support trendline near the $0.07 level.
- The same trendline supported major price recoveries after tests in 2017 and 2020.
- DOGE traded near $0.0731 and remained above Bollinger Band support at $0.0701.
- The MACD showed improving bullish momentum, although both lines stayed below zero.
- A breakout above $0.0777 could strengthen the rebound and open a move toward $0.08.
Dogecoin (DOGE) returned to a decade-long ascending support trendline in July 2026, renewing interest in its historical price structure. The meme coin traded near $0.073 as buyers defended a zone that supported earlier market recoveries. Technical indicators showed improving momentum, but the price remained below levels needed to confirm a stronger rebound.
Dogecoin Approaches Critical Floor From Past Cycles
Technical analyst Trader Tardigrade highlighted the monthly chart after the price reached the long-running ascending trendline. Dogecoin previously touched this support during 2017 and 2020 before recording substantial rallies. The latest contact places the asset near the same structural floor almost ten years after its first test.
$Doge/monthly#Dogecoin bounces every single time it touches this support trendline — and the pump after each touch is accelerating.
2017: Touch → Pump
2020: Touch → Bigger pump
2026: Touch → ?
This is a long-term support that has held for nearly a decade. Every bounce gets… pic.twitter.com/4paJozoI6j
— Trader Tardigrade  (@TATrader_Alan) July 22, 2026
The shared chart marked each trendline contact with upward arrows and increasingly taller yellow bars. These markers represented stronger advances following earlier touches, although past performance does not establish future outcomes.
“The pattern repeats. The next pump is loading,” the analyst wrote on X.
Dogecoin traded between roughly $0.070 and $0.076 as the monthly support faced another test. Market data placed the token near $0.073, while several long-term support measures converged around the same area. Holding that range would preserve the broader rising structure shown on the monthly chart.
Daily Indicators Show Limited Recovery
Dogecoin changed hands near $0.0731 on the daily chart and declined about 0.4% during the session. The price remained below the Bollinger Band midpoint at $0.0739, showing limited buying control. However, the lower band near $0.0701 continued to support the market during recent weakness.
DOGE price recovered modestly after approaching $0.070 earlier in July. A daily move above $0.0777 would clear the upper Bollinger Band and strengthen the current recovery. That breakout could place $0.080 within reach, but the chart has not confirmed that move.
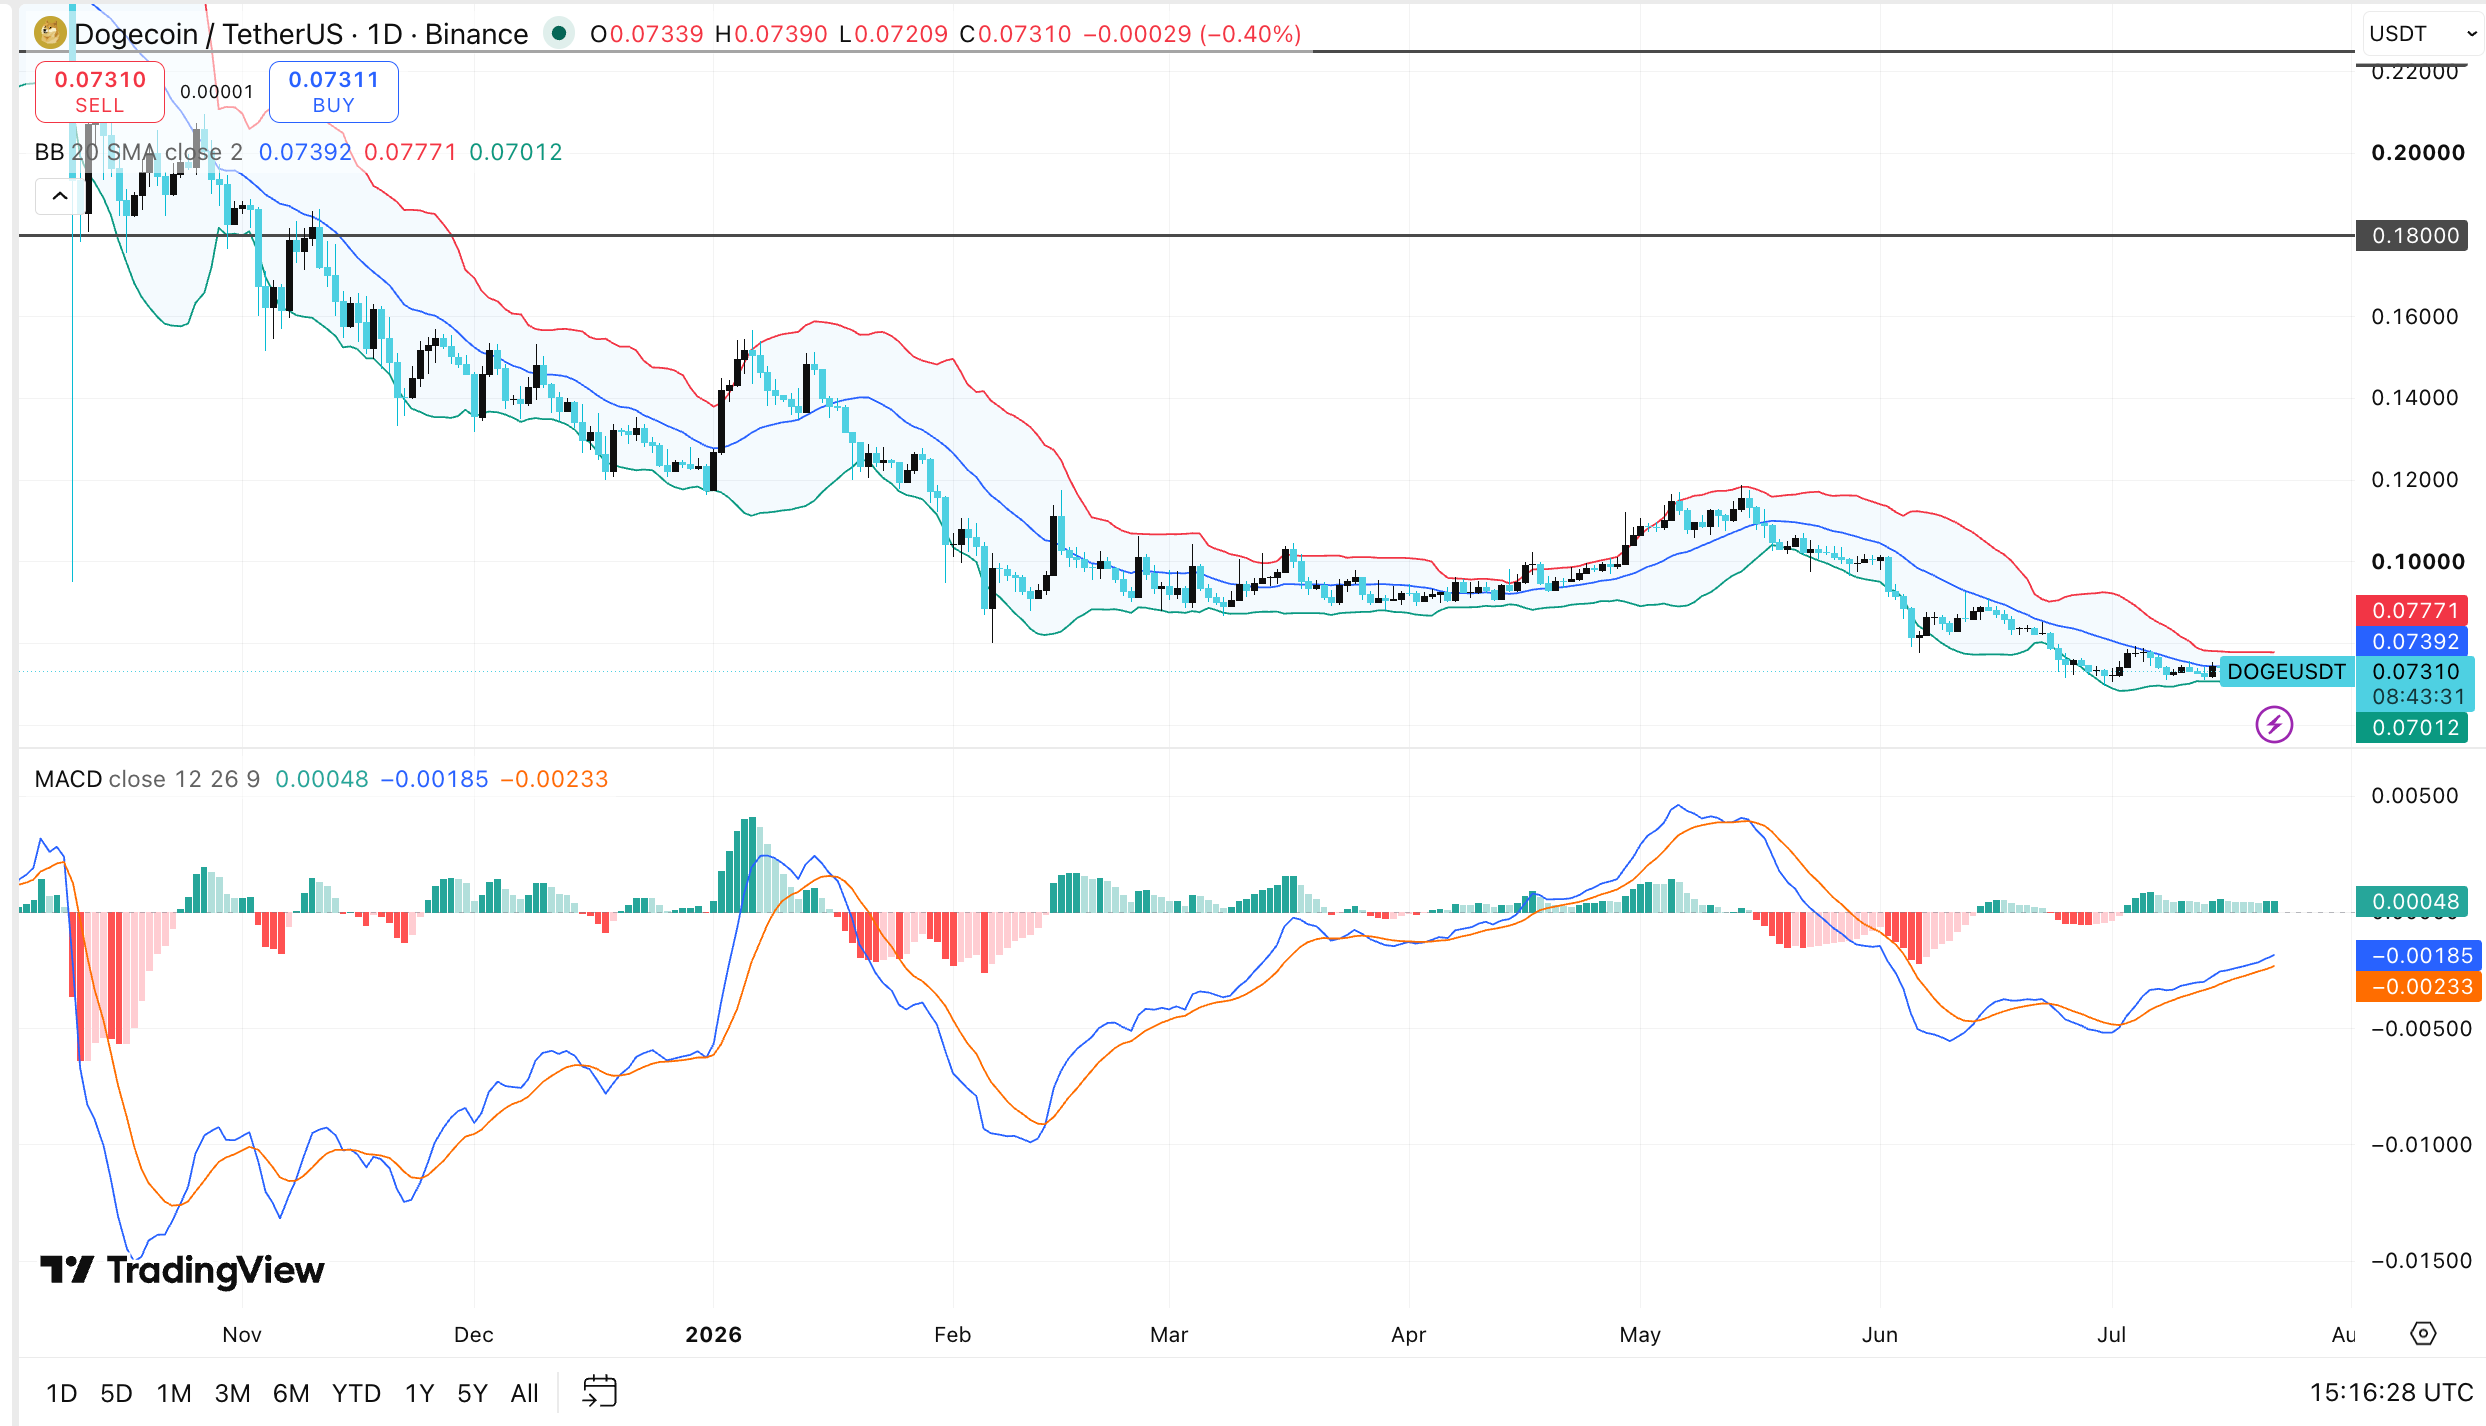
Source: TradingView
Dogecoin must also retain the $0.070 area to prevent further technical weakness. A daily close below that level could expose lower support zones and weaken the long-term setup. Therefore, the current range remains important for short-term direction and broader trend stability.
The MACD line stayed above its signal line, while the histogram remained positive. That configuration showed improving bullish momentum after the early-July decline. Still, both MACD lines remained below zero, which limited the strength of the signal.
A break above $0.0777 would confirm stronger price momentum on the daily chart. Such a move would also place the price above the upper Bollinger Band.
The post Dogecoin Hits Decade-Long Support Trendline, Sparking Bullish Hopes for Major Rebound appeared first on Blockonomi.





 English (US) ·