
 2 months ago
39
2 months ago
39
Key Takeaways
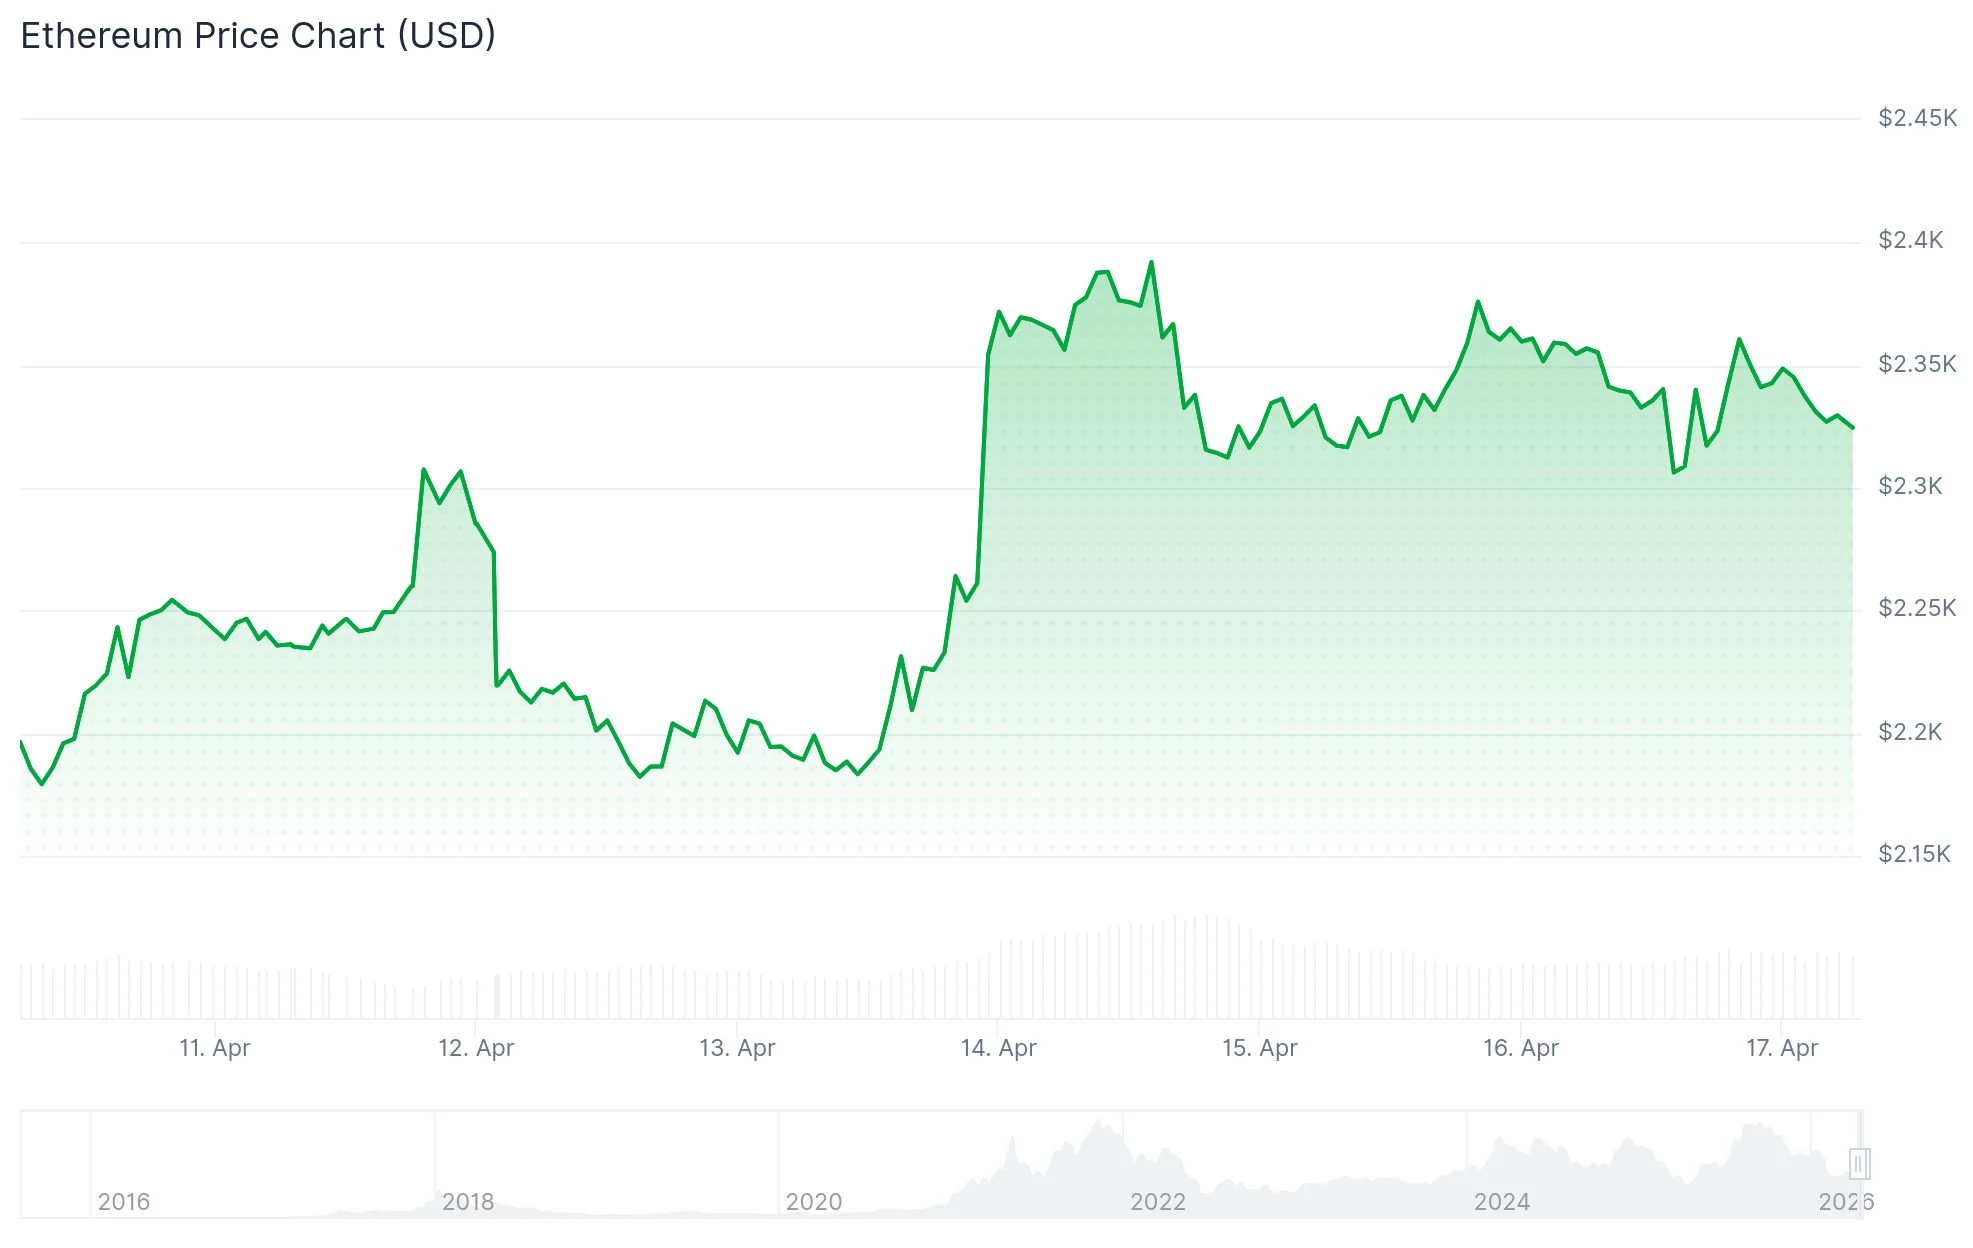
- Ethereum peaked at $2,417 before facing strong selling pressure
- Critical resistance zone between $2,360 and $2,400; support established at $2,190–$2,295
- Large holders have sold approximately 60K ETH after reaching their cost basis
- Open interest in ETH futures remains unchanged at 14.2 million ETH, showing no new leverage
- Spot Ethereum ETFs in the US recorded five consecutive days of positive flows, adding $67.8M on Wednesday
Ethereum’s recent rally encountered significant resistance after touching $2,417, forcing the price below the $2,350 threshold. This rejection comes from a resistance zone that market observers have been monitoring closely.
 Ethereum (ETH) Price
Currently, ETH is hovering just above the $2,300 mark, maintaining its position above the 100-hour Simple Moving Average. Sellers are actively protecting the $2,360 level, reinforced by a converging short-term trend line.
Resistance is clustered between $2,360 and $2,420. Breaking decisively above $2,420 would target the $2,450 level, followed by $2,500 and potentially $2,550. Should prices decline, the first support rests at $2,295, with subsequent floors at $2,265 and $2,200.
Looking at the daily timeframe, Ethereum remains supported above both the 20-day and 50-day EMAs, positioned at $2,214 and $2,190 respectively. The Relative Strength Index reads approximately 61, indicating moderate bullish momentum, though the Stochastic Oscillator hovering near 84 suggests potentially overbought territory that may limit further gains.
The 100-day EMA at $2,376 serves as immediate overhead resistance, sitting just beneath the horizontal barrier at $2,388. Breaking above this zone on a daily close would bring $2,746 into focus, with $3,411 as the next major target.
Large Holder Distribution Creates Headwinds
Blockchain analytics reveal that addresses containing 10K–100K ETH started reducing their holdings once prices exceeded their average acquisition cost. These wallets have collectively sold approximately 60K ETH since early this week.
 Source: CryptoQuant
Additionally, two other wallet categories—those holding 100–1K and 1K–10K ETH—have distributed nearly 350K ETH over the past week. This pattern typically indicates profit-taking or exit strategies from holders approaching their break-even points.
Futures market data shows open interest has plateaued at approximately 14.2 million ETH following the initial price surge earlier this week. The seven-day moving average of the Taker Buy-Sell Ratio has begun declining, suggesting waning buying enthusiasm in the derivatives market.
The past 24 hours saw $111.6 million in total liquidations across Ethereum positions, with long positions accounting for $70.8 million of that figure.
Institutional Flows Provide Counterbalance
US-based spot Ethereum ETFs have posted five consecutive days of positive net flows. Wednesday’s session alone captured $67.8 million in new capital, based on SoSoValue tracking. This demonstrates renewed institutional interest, although market analysts note the inflow rate remains modest.
The 4-hour chart reveals ETH’s rejection from the $2,360 resistance band, with prices now testing support near $2,190. Successful defense of this level could set up another challenge of the $2,400 region.
At present, ETH trades at $2,350, maintaining position above near-term moving averages, with $2,360 representing the immediate hurdle to overcome.
The post Ethereum (ETH) Price Faces Critical Test at $2,400 Resistance Zone appeared first on Blockonomi.


 English (US) ·