
 2 months ago
34
2 months ago
34
Ethereum (ETH) price trades at $2,108 on the 12-hour chart on April 7, down approximately 1% over the past 24 hours. The headline move looks unremarkable. However, four separate metrics across the technical, derivatives, and on-chain layers are converging toward the same conclusion, and none of them are pointing down.
The last time something similar happened, at least on the technical front, Ethereum price rallied 16%. Whether history repeats depends on a handful of levels that are now within striking distance.
Two Technical Triggers Are Converging on the 12-Hour Chart
The first metric is the Exponential Moving Average (EMA) structure, a trend indicator that gives greater weight to recent price action. On the 12-hour chart, the 20-period EMA at $2,083 is closing in on the 50-period EMA at $2,086. When the faster EMA crosses above the slower one, it forms a bullish crossover that typically signals a shift in short-term momentum.
This exact setup started building in mid-March. The crossover started forming around mid-March, and Ethereum price subsequently rallied 15.63%. In the process, it even reclaimed the 100-period EMA. The same structure is forming again. Since April 5, prices have already moved up 7.59%, and the 20 and 50 EMAs are now within $3 of each other. The 100-period EMA sits at $2,144, and a confirmed crossover would bring that level into immediate focus.
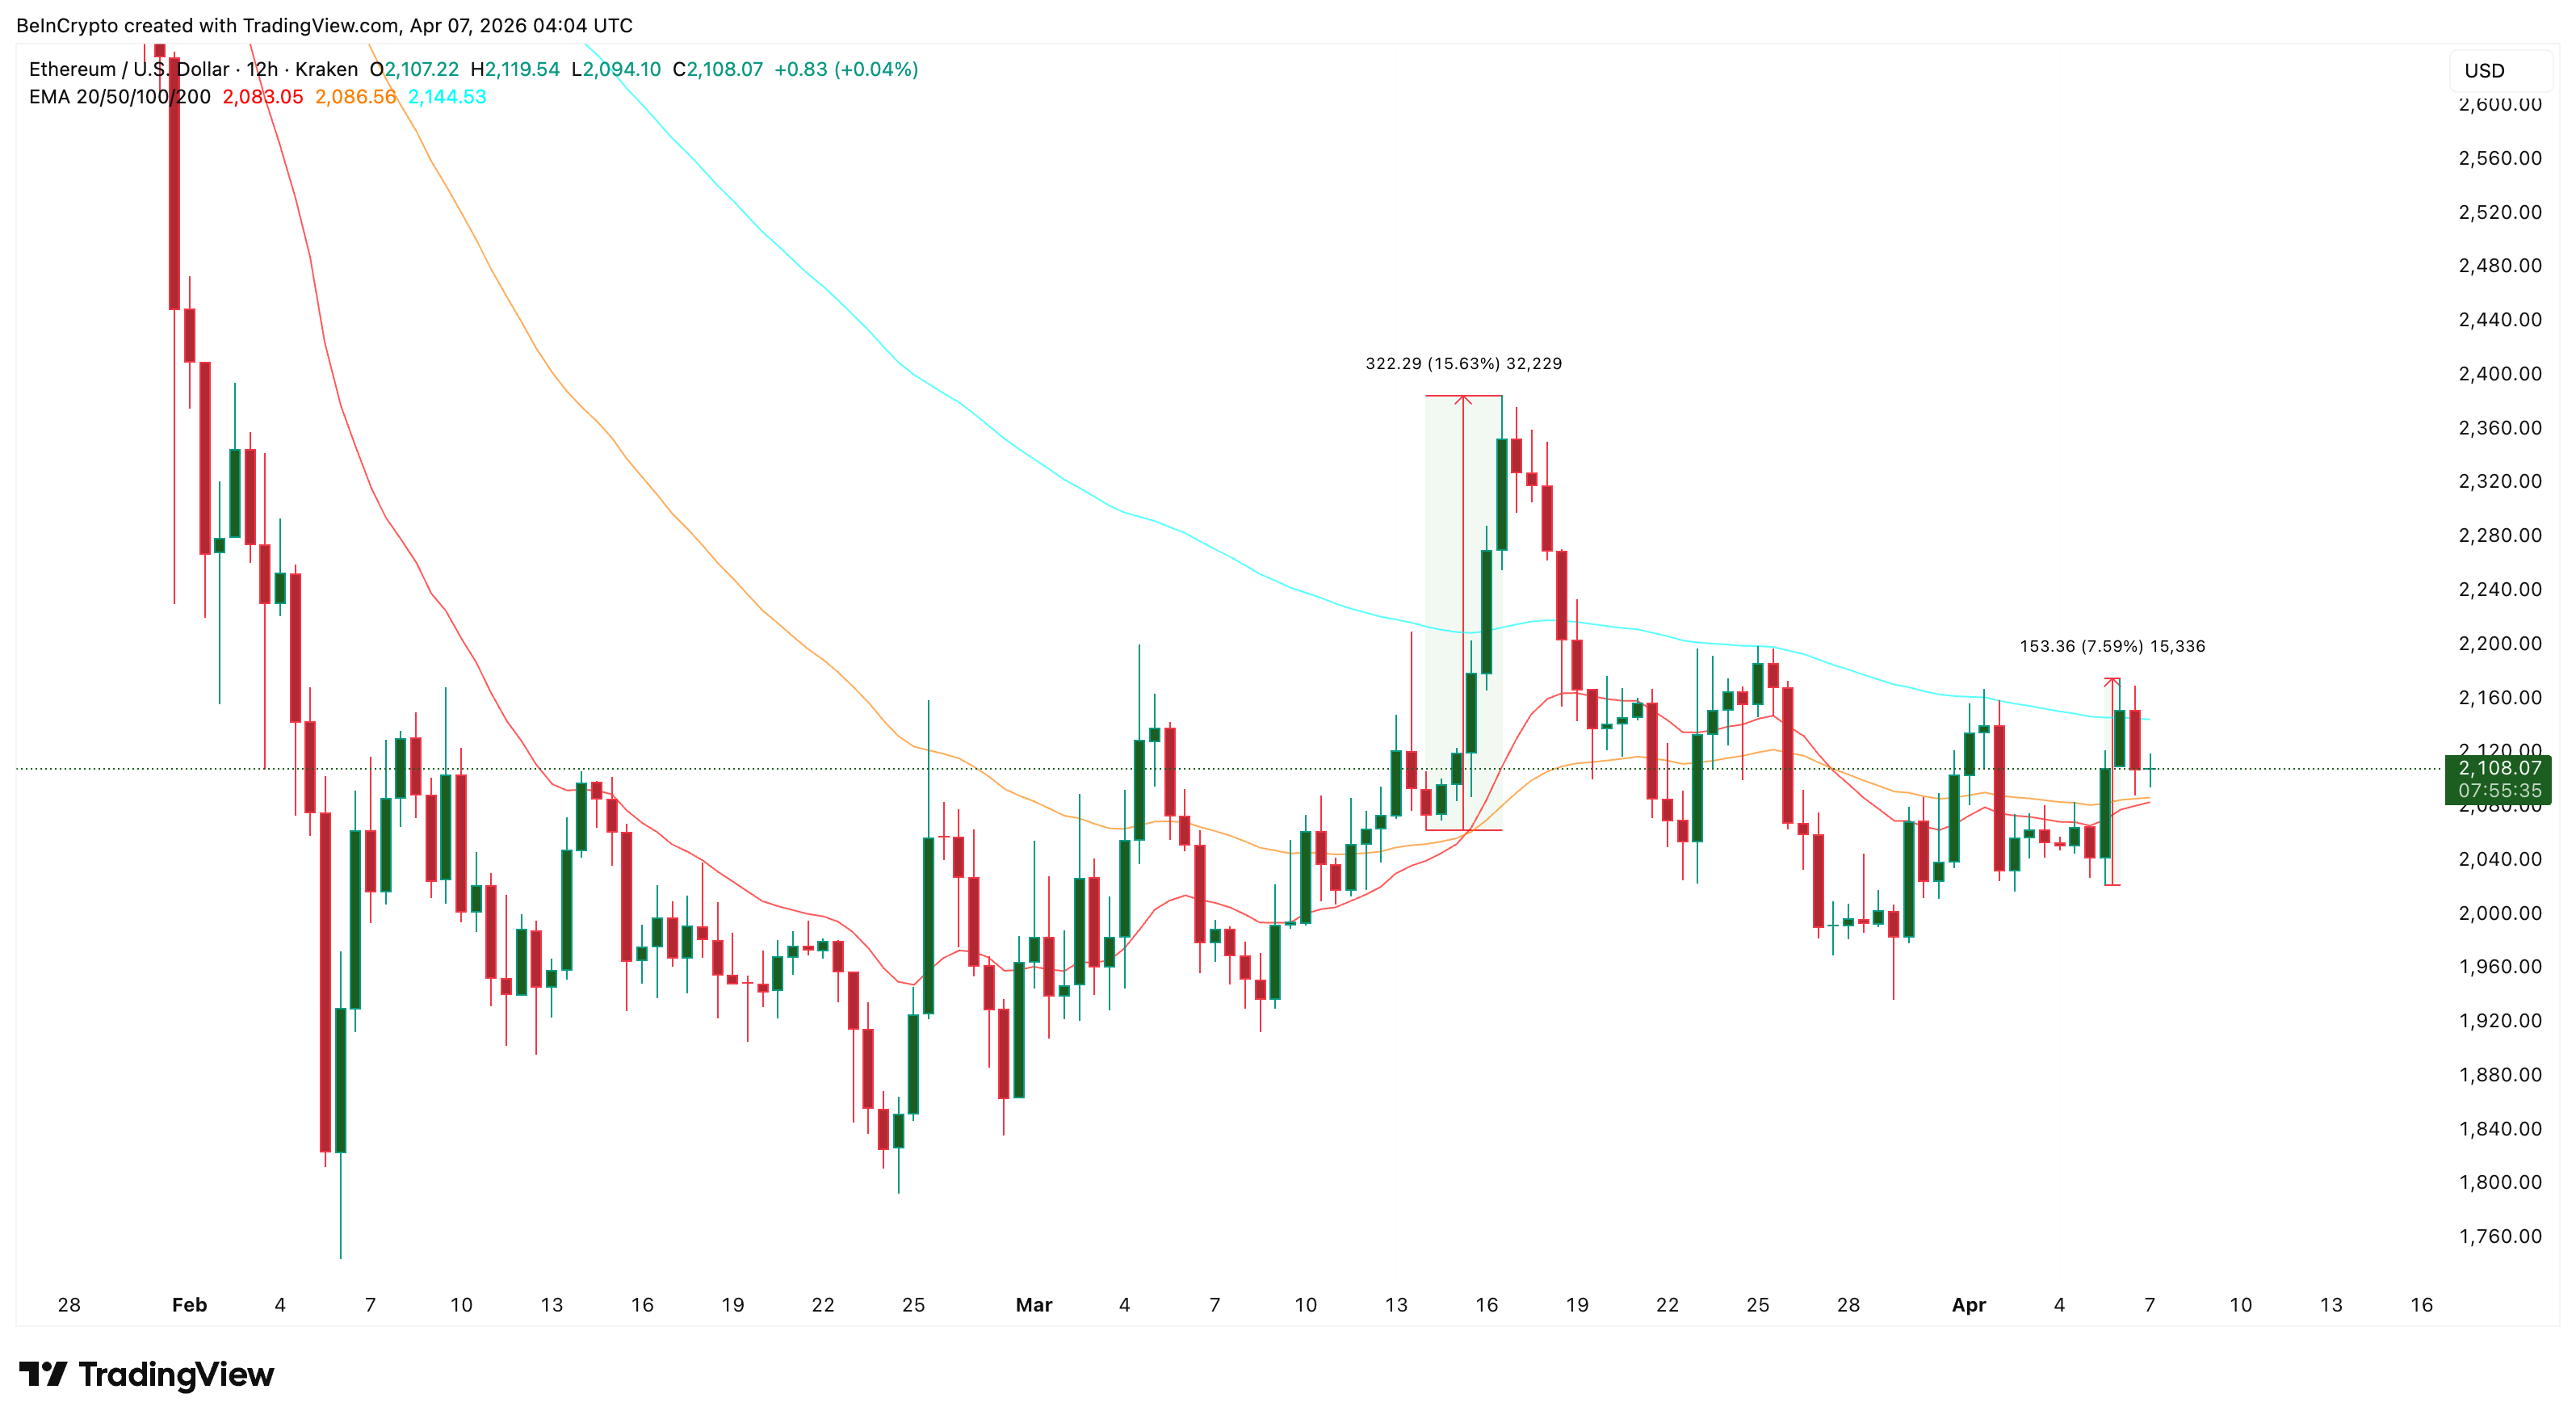 ETH 12H EMA Crossover: TradingView
Want more token insights like this? Sign up for Editor Harsh Notariya’s Daily Crypto Newsletter here.
The second metric is the Relative Strength Index (RSI), a momentum oscillator. Between March 19 and April 6, price made a lower low on the 12-hour chart while RSI made a higher low.
That standard bullish divergence suggests selling momentum is fading even as price tested lower levels. The divergence remains intact as long as Ethereum price holds above $2,086. A break below that level would not destroy the broader lower low structure but would invalidate the most recent swing as a confirmed low until it resets.
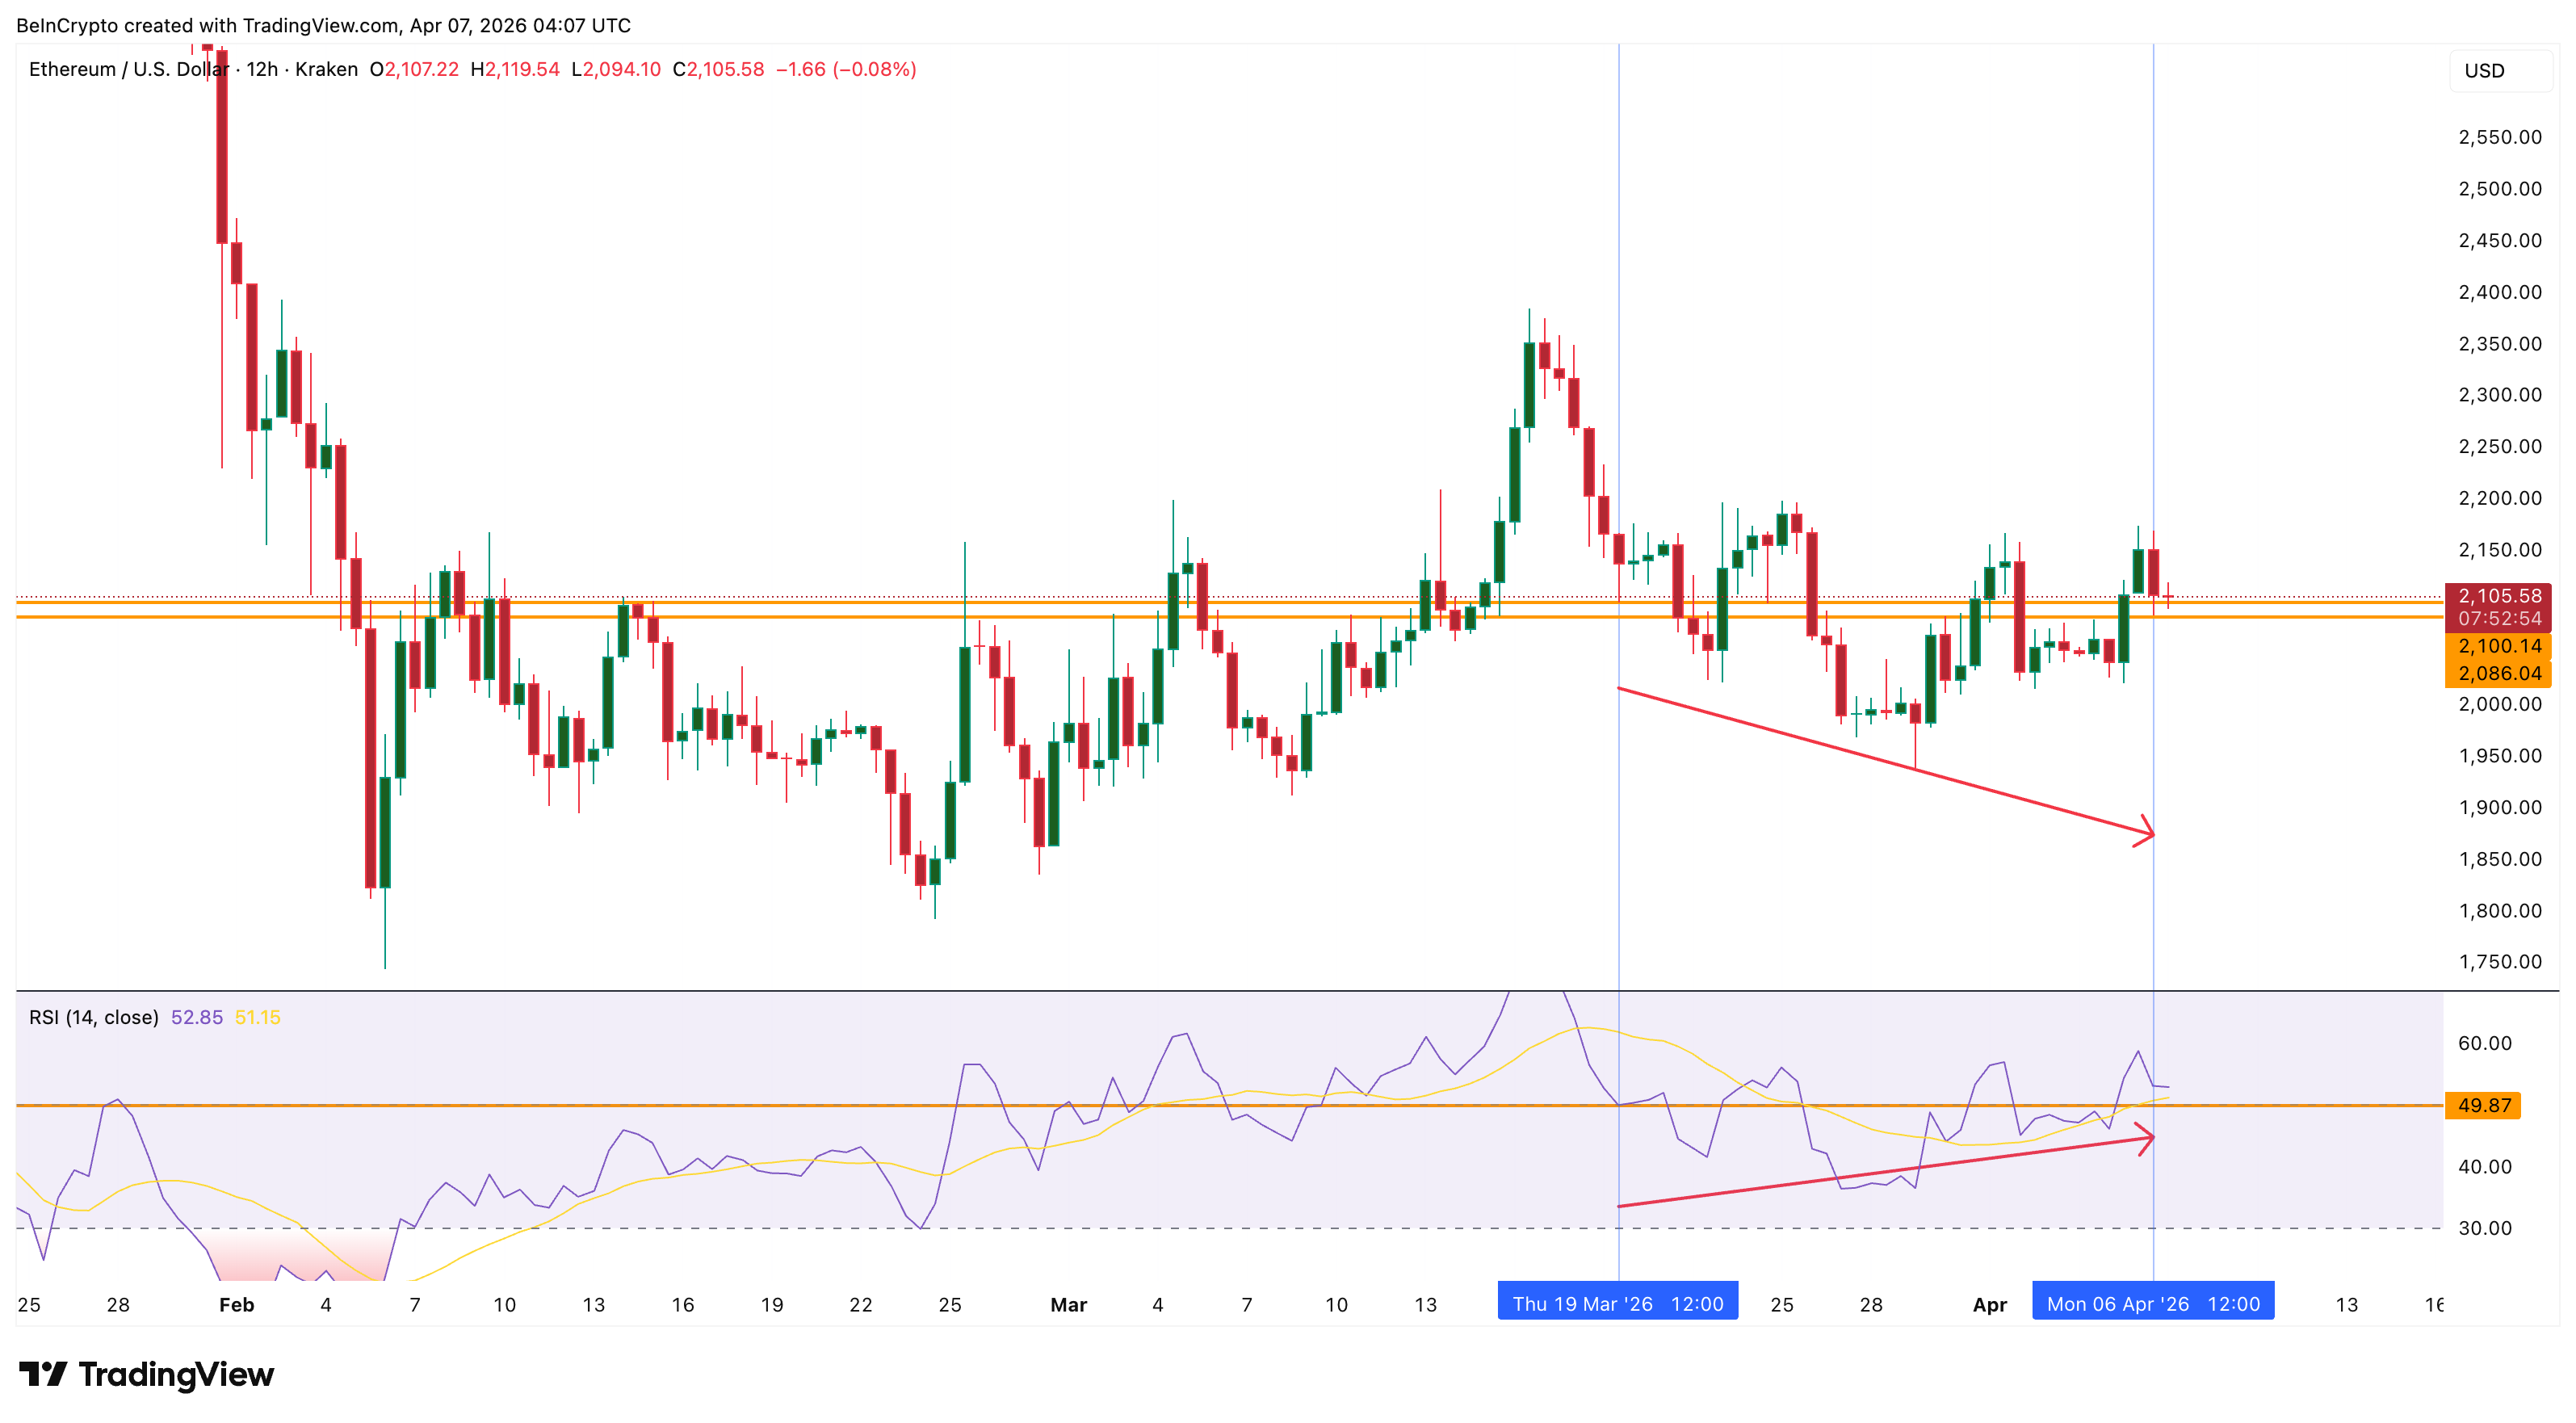 RSI Divergence: TradingView
Together, the EMA convergence and RSI divergence form the technical foundation for a potential bounce. However, technical patterns alone do not move prices. The derivatives and on-chain data reveal whether the fuel exists to power the move.
Shorts Are Piling In and Whales Are Not Selling
The third metric comes from the derivatives market. On April 4, total open interest for Ethereum stood at $10.49 billion with a funding rate of approximately -0.0015%. By April 7, open interest had risen to $10.77 billion while the funding rate dropped further to -0.007%.
Rising open interest combined with an increasingly negative funding rate means one thing. Traders are opening new short positions. That buildup of short exposure creates contrarian fuel because if price moves against them, the shorts must buy to close their positions, accelerating the rally through a short squeeze.
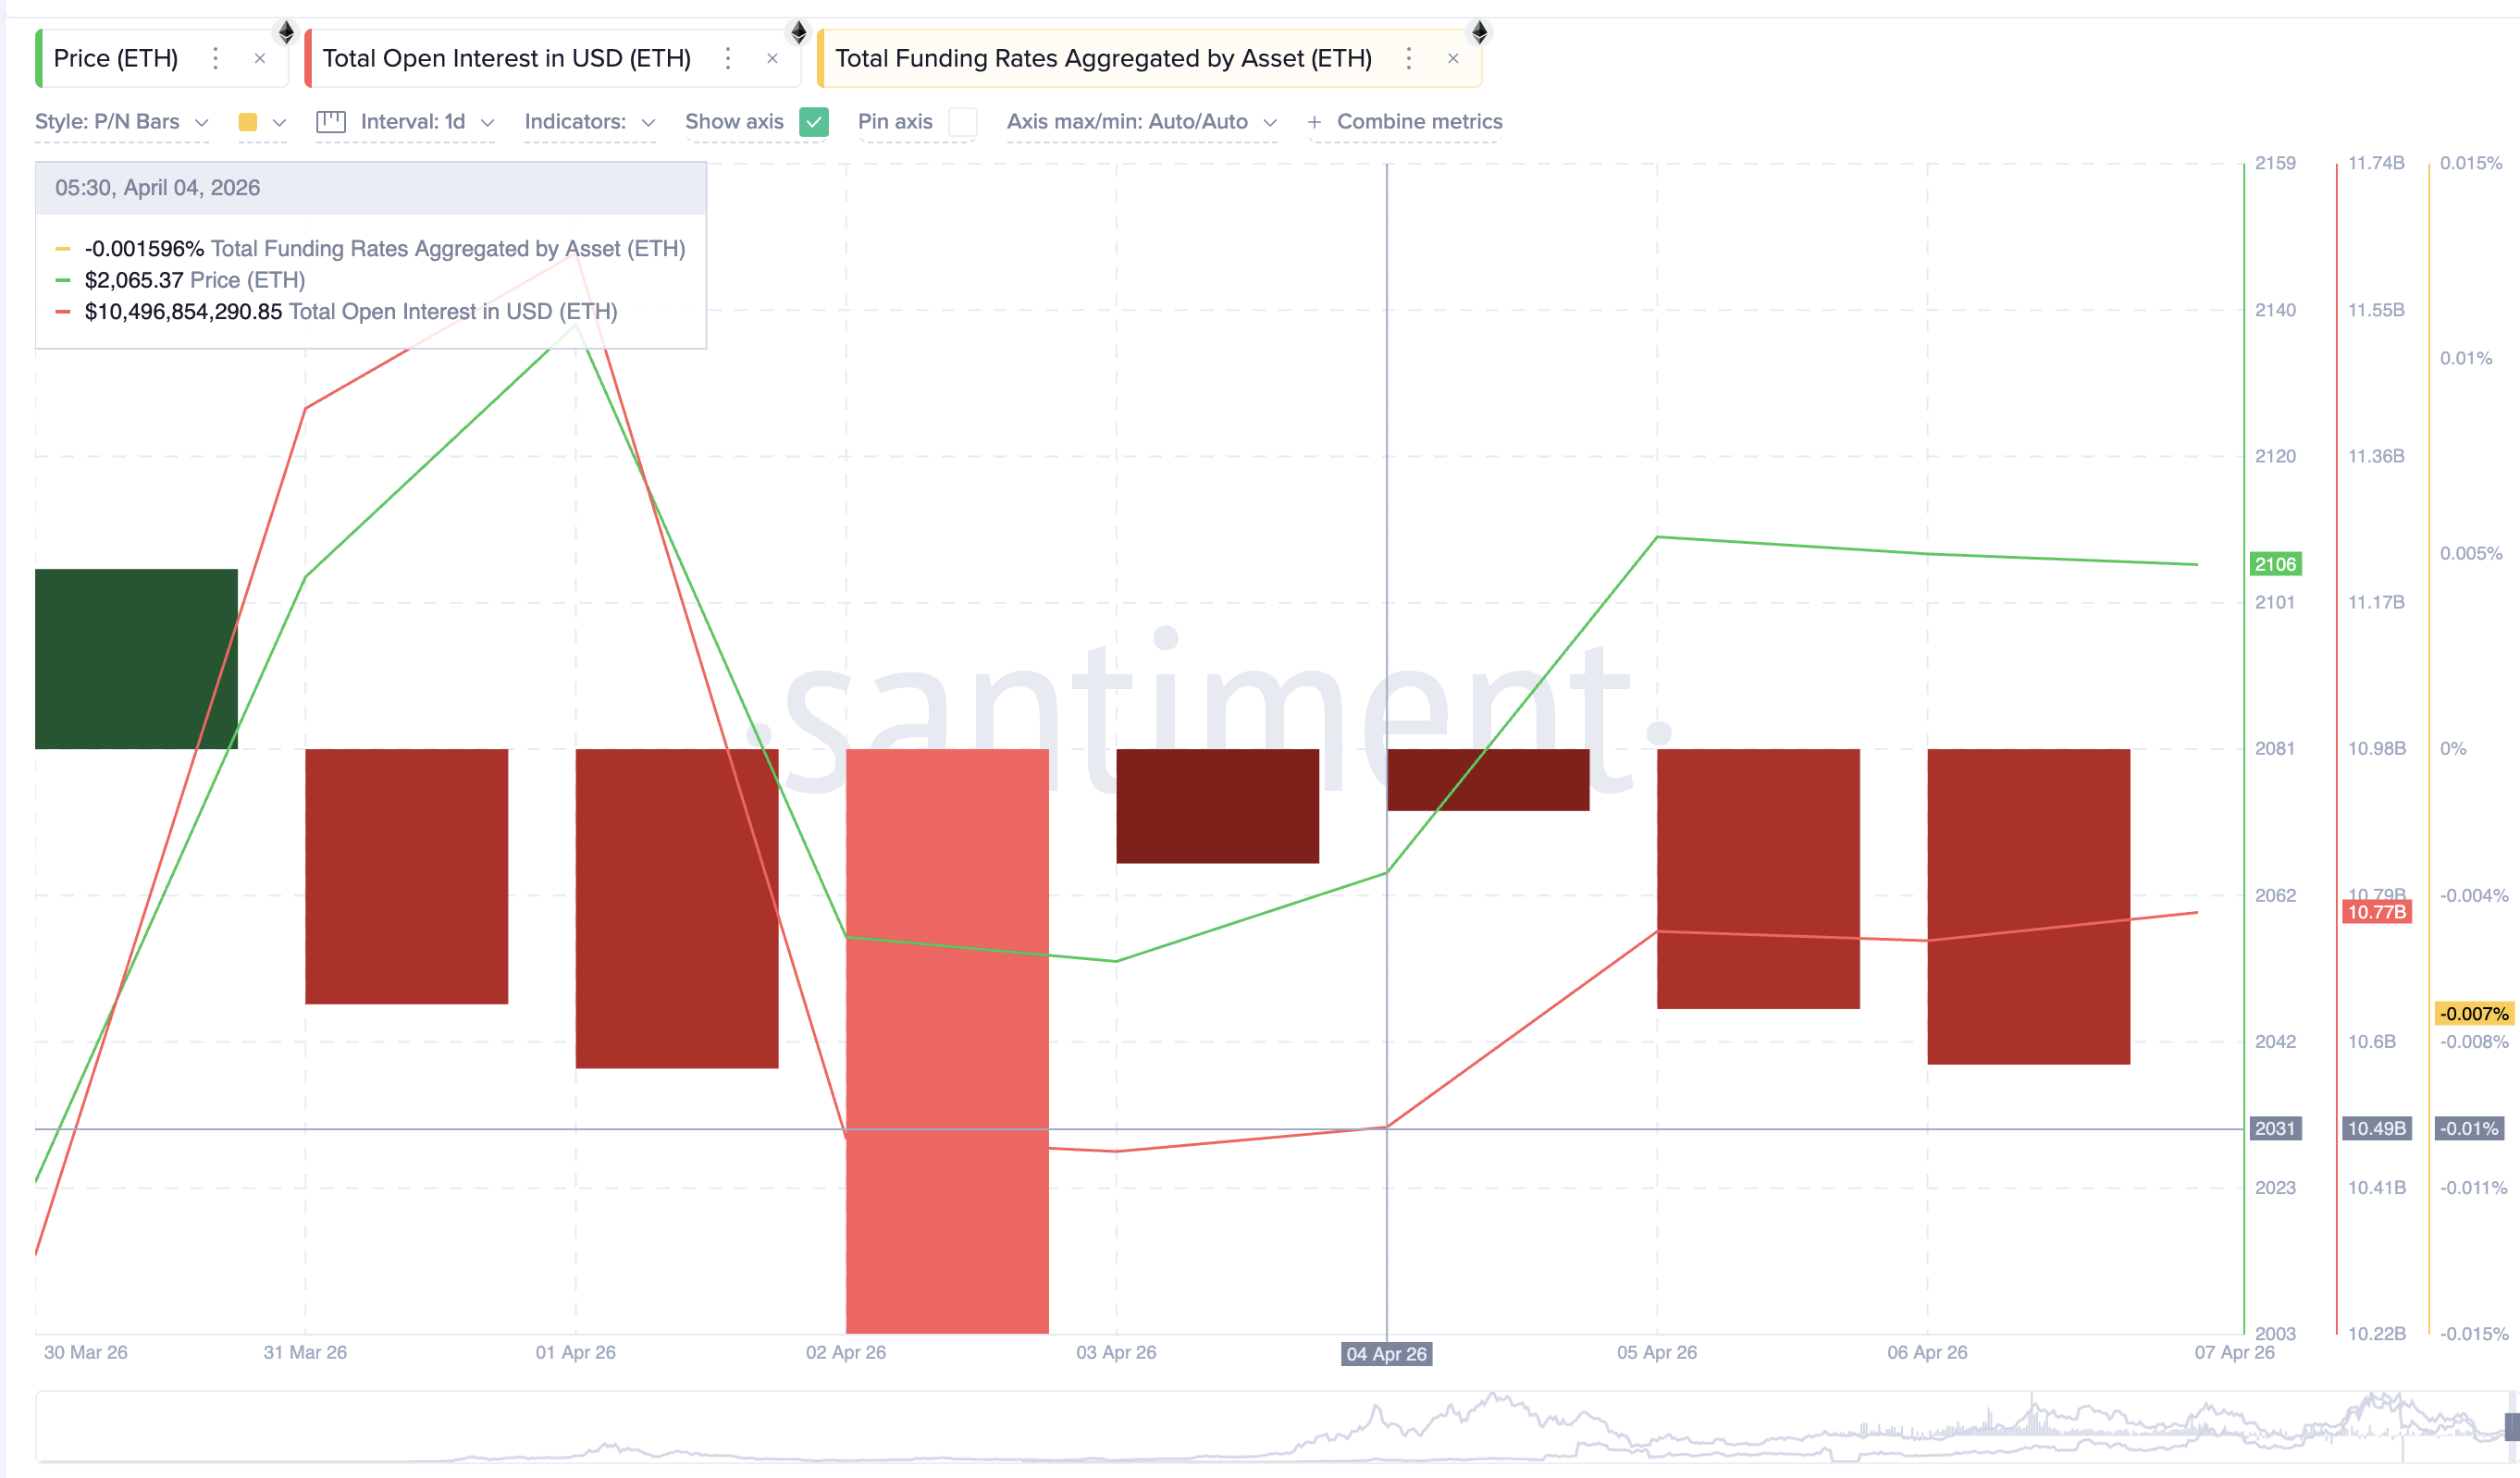 ETH Open Interest and Funding Rate: Santiment
The fourth metric is whale behavior. Since April 3, whale wallets (excluding exchanges) have increased their holdings from 122.73 million to 122.92 million ETH. That addition of approximately 190,000 ETH or roughly $400 million represents steady accumulation rather than aggressive buying.
But the key point is that whales have not reduced their positions during the recent weakness. They are holding through the dip and adding incrementally, providing spot support that sits beneath the derivatives-driven short squeeze potential.
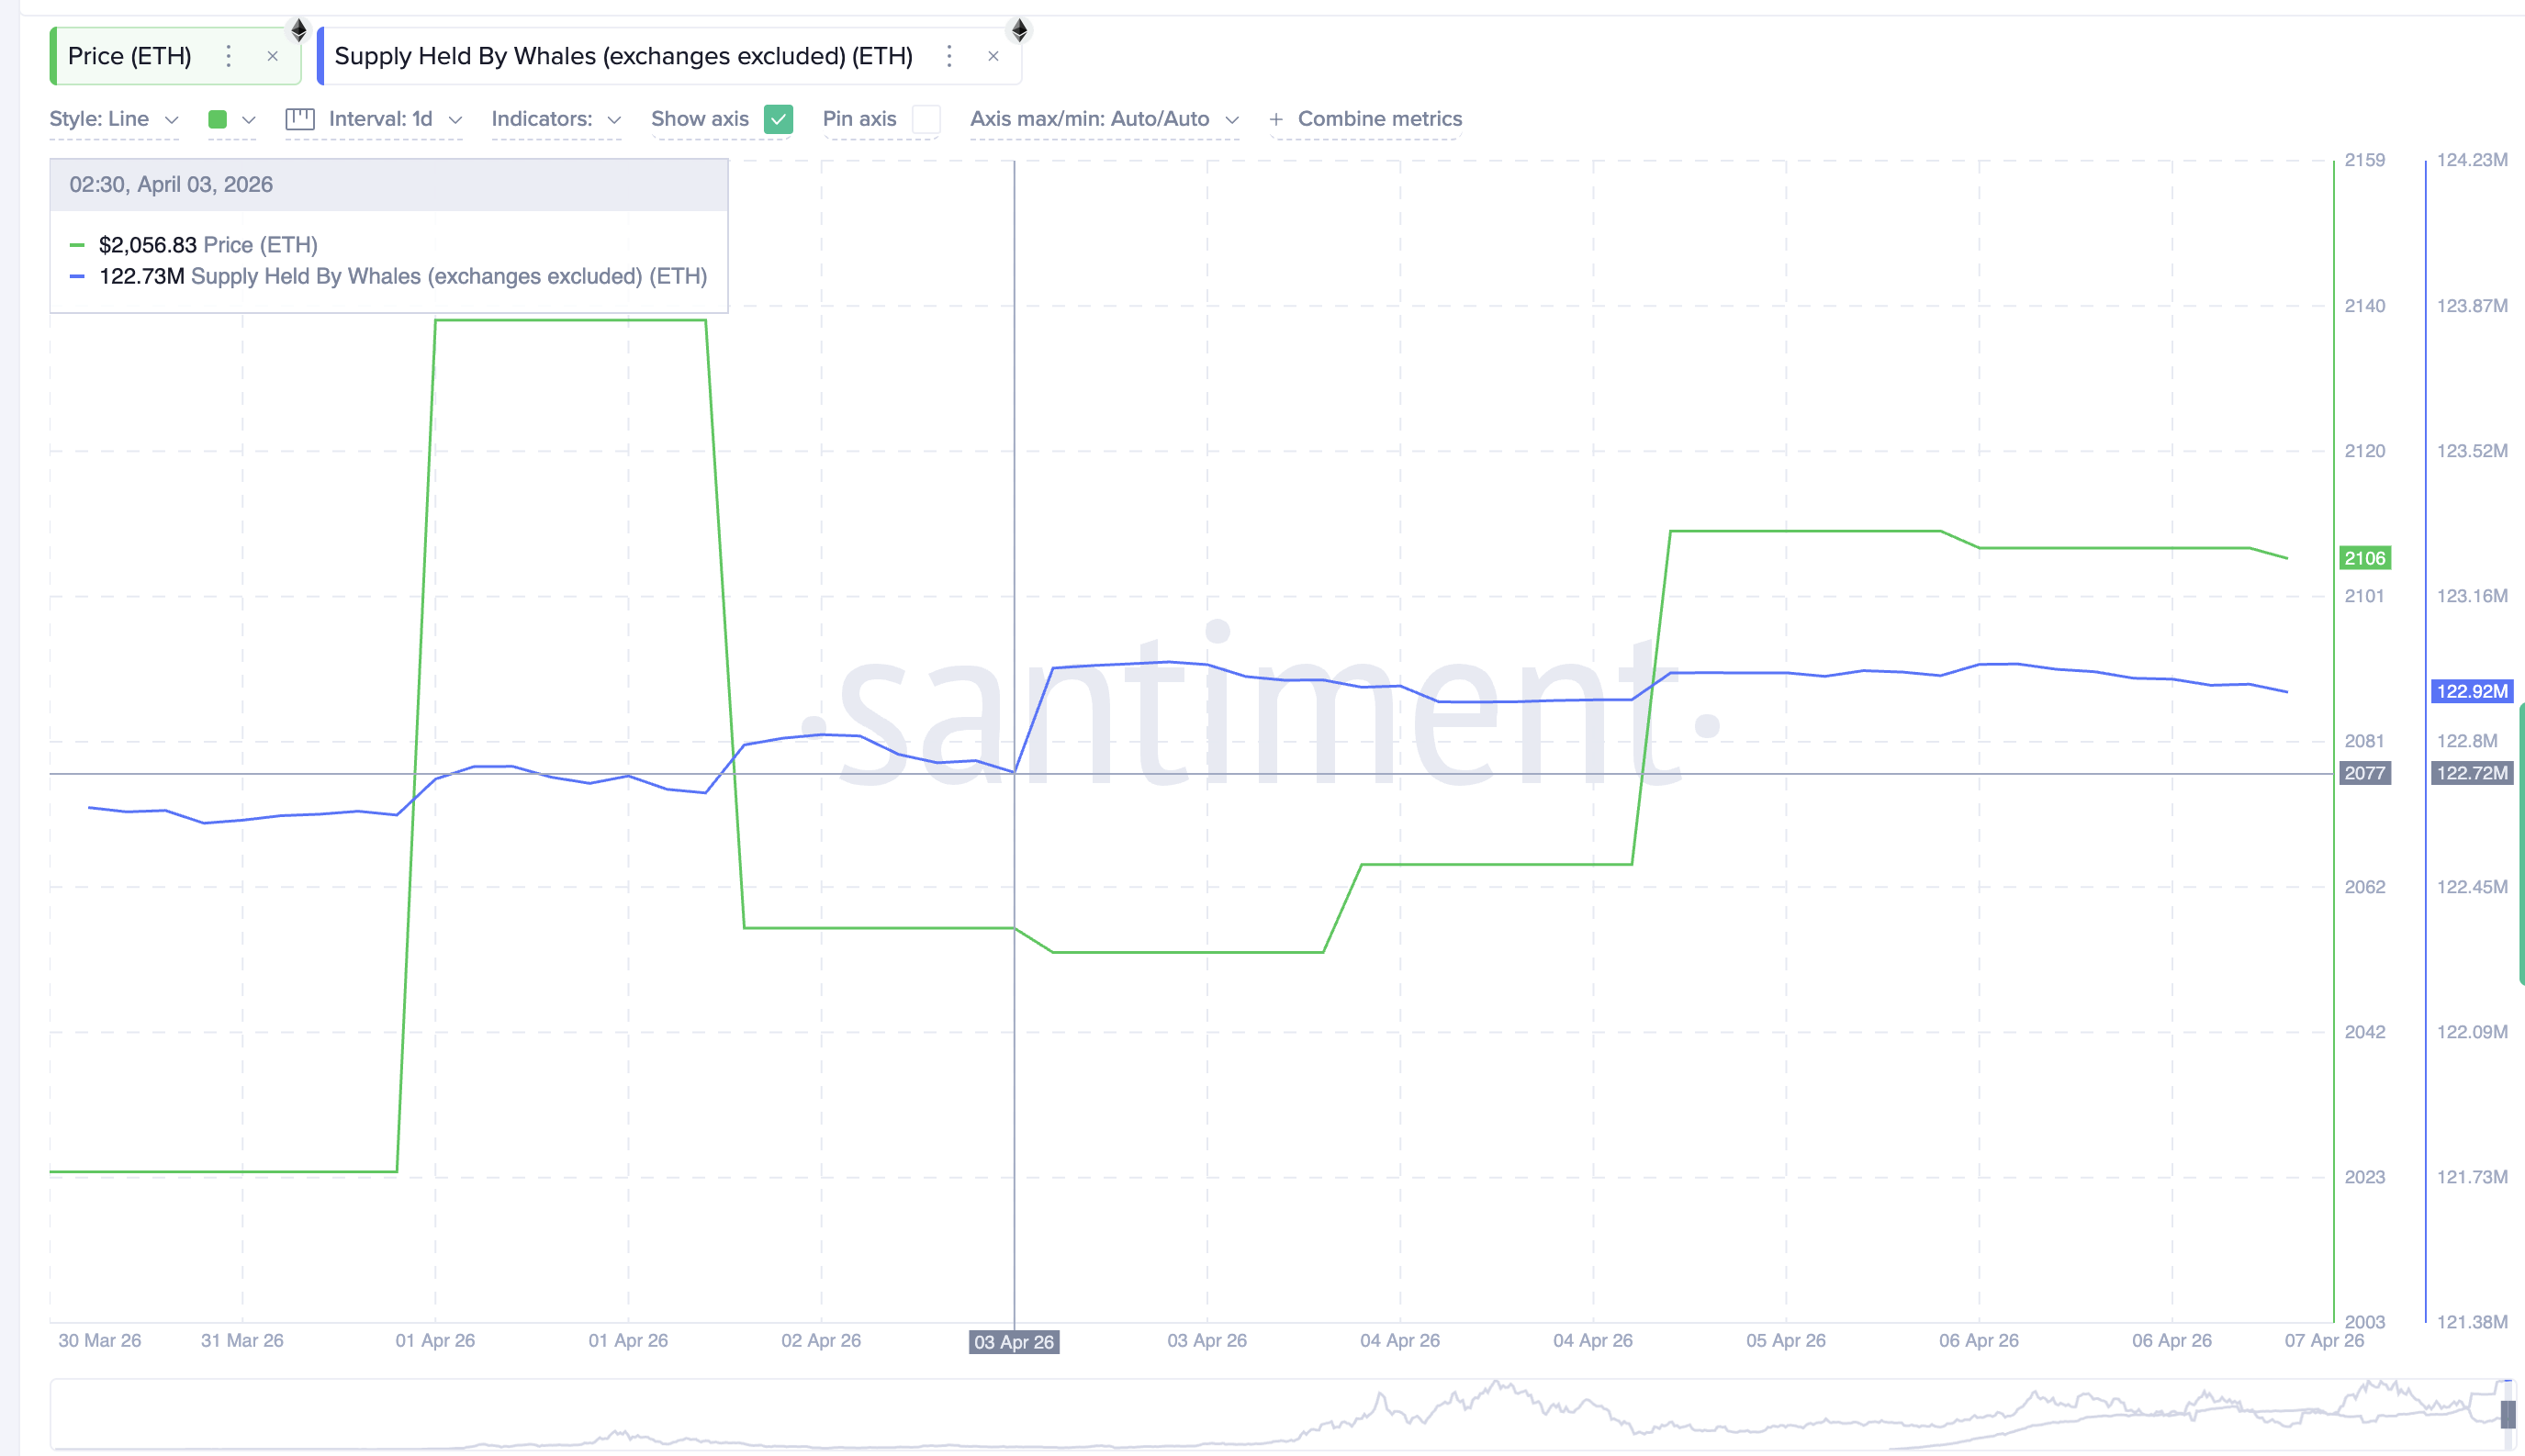 Whale Holdings: Santiment
The technical setup provides the direction. The derivatives market provides the contrarian fuel. The whale accumulation provides the spot floor. All four metrics are aligning toward the same outcome, which makes the price levels the final arbiter.
Ethereum Price Levels That Decide If the Bounce Delivers
The 12-hour chart with technical levels from the completed swing frames every critical level.
The first hurdle is $2,116 at the 0.382 level. A 12-hour close above this would place Ethereum price back above the zone where the EMA crossover would likely confirm, adding momentum to the move. Above that, $2,172 is the most important resistance. This level has rejected price repeatedly since mid-March, and a clean break above it would represent the first meaningful shift in the short-term structure.
For the bounce to show genuine strength, Ethereum needs to reach $2,228 at the 0.618 level, a 5.77% move from current prices. A close above $2,228 would confirm that the four metrics translated into a real trend shift rather than another failed bounce.
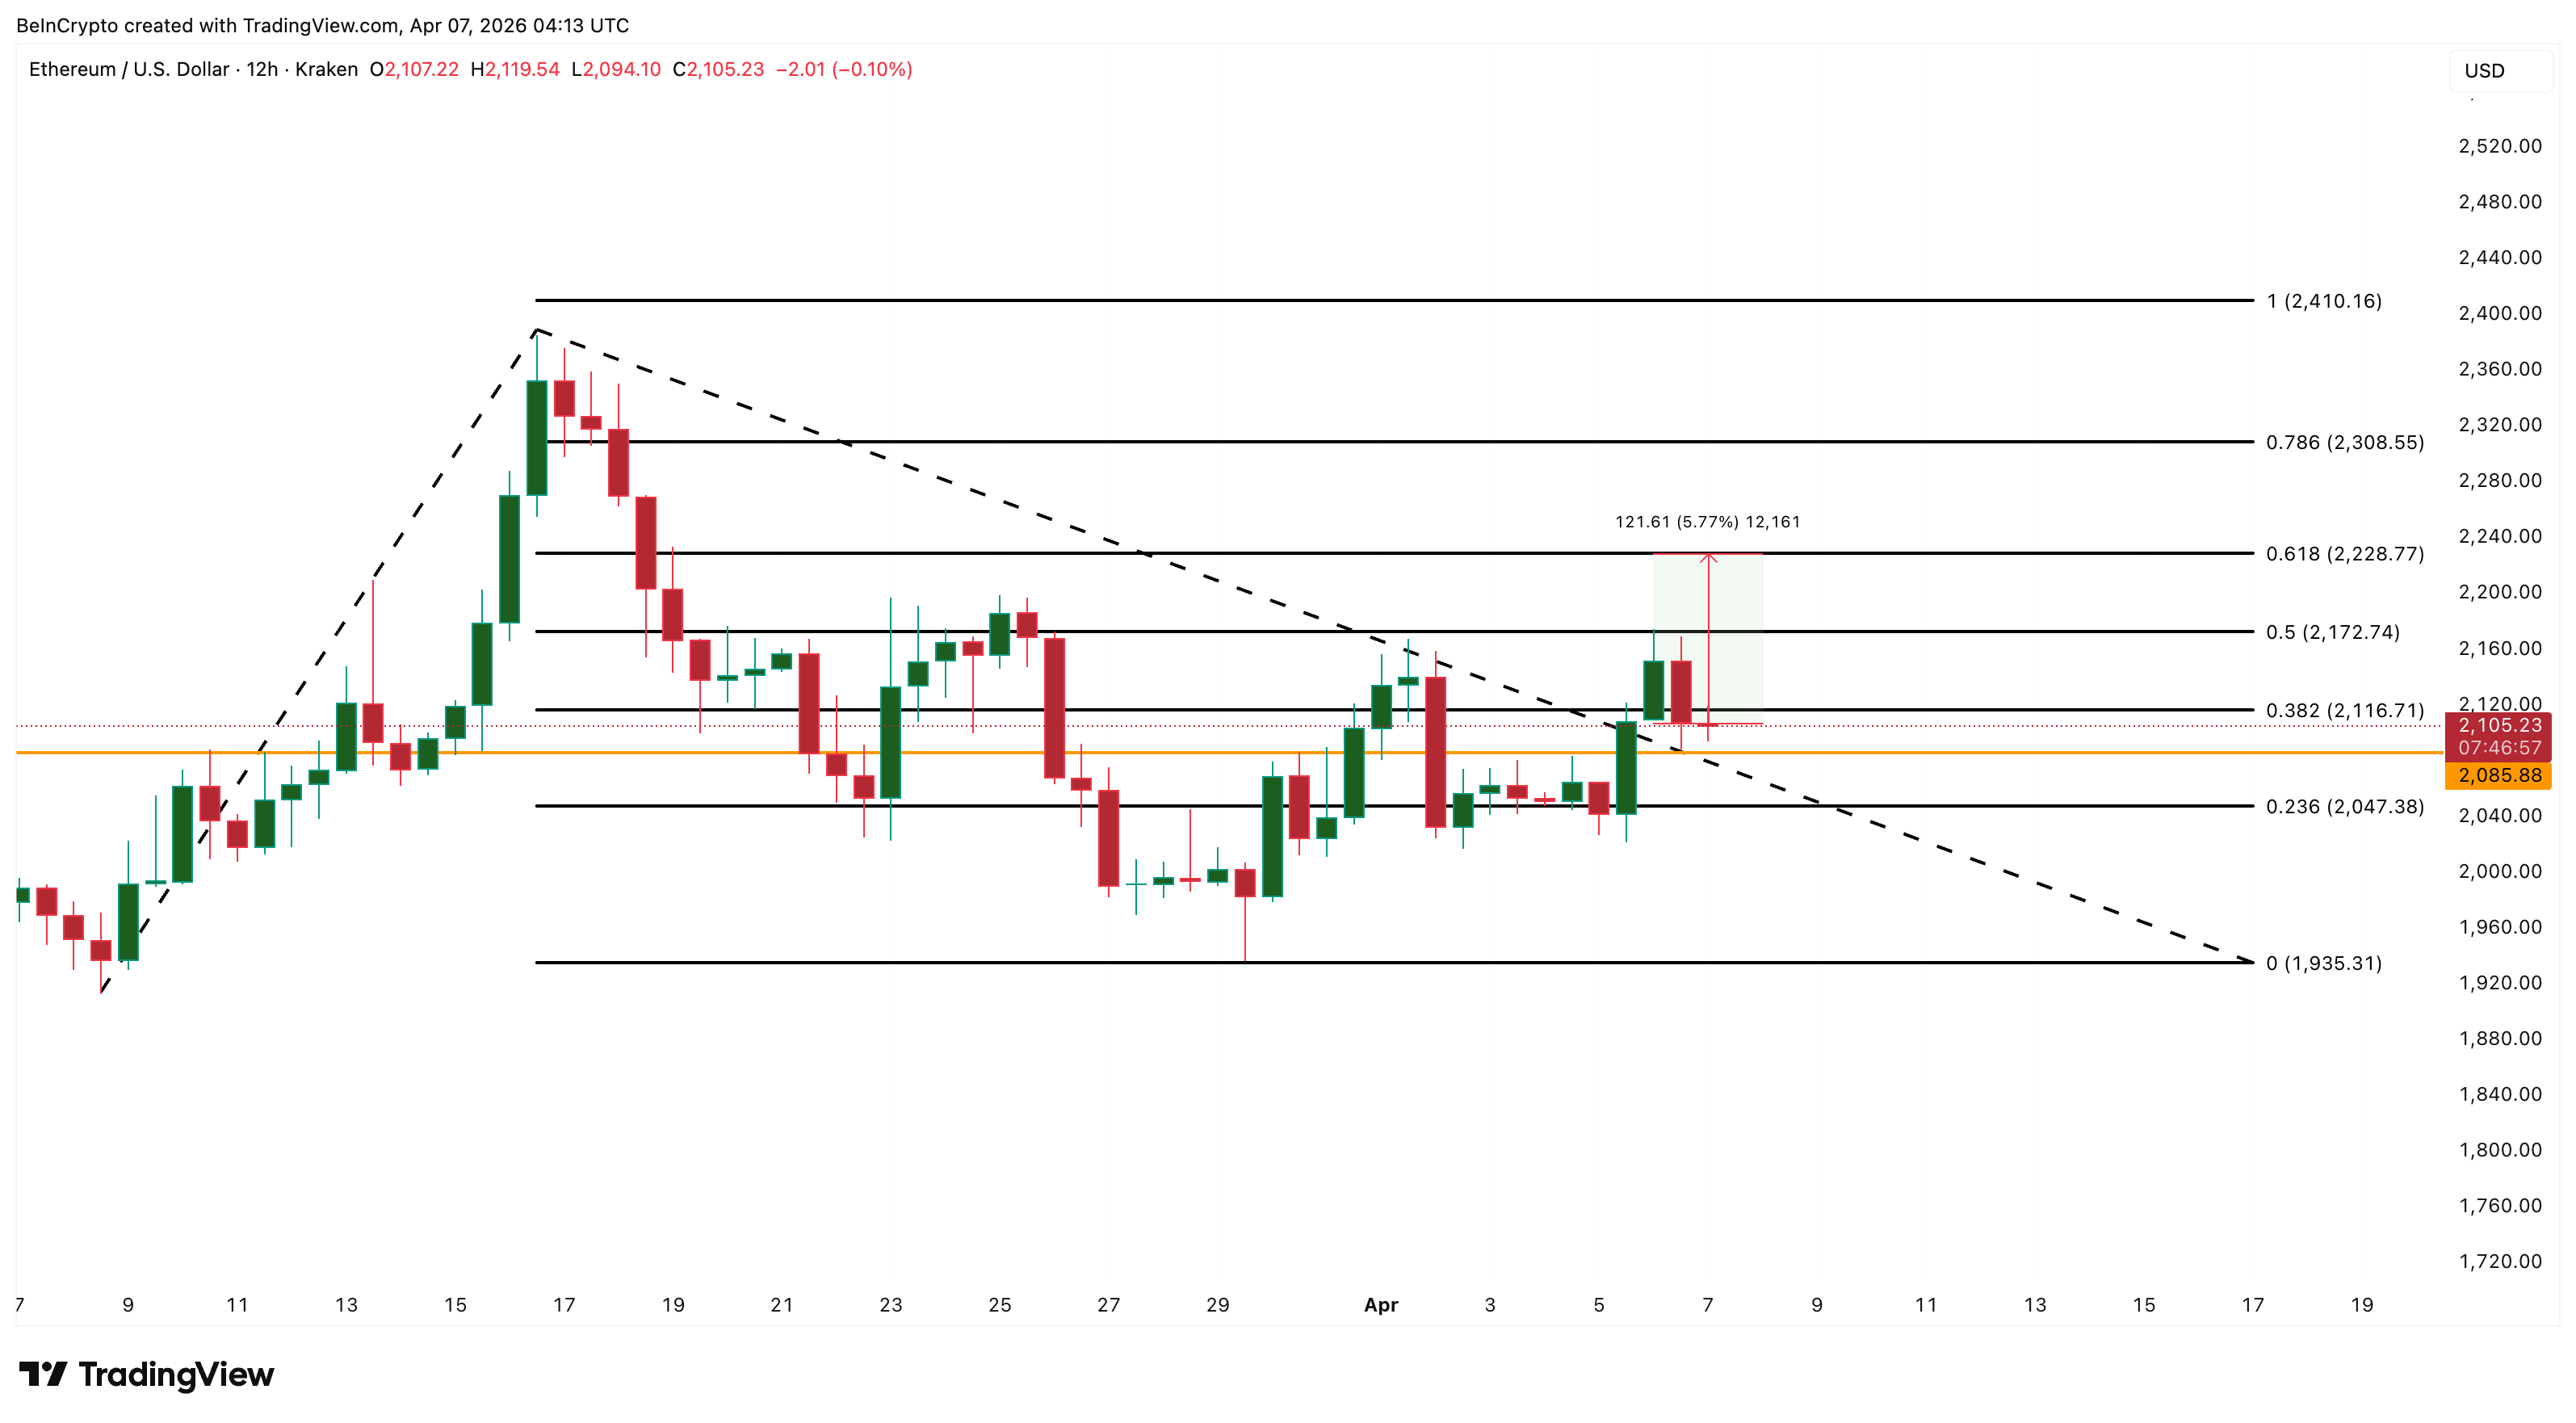 Ethereum Price Analysis: TradingView
On the downside, $2,086 is the level that keeps the RSI divergence intact. Below that, $2,047 at the 0.236 level becomes the immediate floor. A break below $2,047 would expose $1,935 and suggest that the four converging metrics were not enough to overcome the broader bearish pressure.
A 12-hour close above $2,172 would confirm the bounce thesis that all four metrics are building toward. And for now, a failure to hold $2,086 would delay the setup and leave Ethereum price vulnerable to a retest of $1,935.
The post Ethereum Price Corrects but 4 Metrics Are Quietly Building a Bounce Case appeared first on BeInCrypto.


 English (US) ·