
 1 month ago
34
1 month ago
34
Ethereum (ETH) price has broken down from the midline of its daily ascending channel after weeks of tightening volatility, opening the door to a slide toward $2,070 if support at $2,264 fails to hold.
The second-largest cryptocurrency trades near $2,291 at the time of writing, down roughly 0.93% over the past 24 hours. Meanwhile, ETH/BTC has collapsed from its own ascending channel on the 12-hour chart and now points to 0.028 BTC after a clean retest of broken support.
Daily ETH/USDT Chart Hints at a Big Move From Compressed Volatility
The daily ETH/USDT chart traces an ascending parallel channel that originated on February 6. Price has reacted cleanly to the upper and lower bands, and especially to the channel midline, which has flipped between support and resistance several times during the move higher.
That midline is now breaking. If the close confirms the loss, the channel projects a measured slide toward the lower band near $2,070. Below that, the next horizontal supports stack at $2,001.70 and $1,920, both areas tested earlier in February and March.
To the upside, $2,370 has rejected price multiple times and remains the resistance that would invalidate the bearish structure on a sustained reclaim. Previous forecasts for April had flagged this band as the pivot.
The RSI sits slightly above 50, neutral and offering no edge in either direction. More telling is the volatility reading (BBWP), which prints three consecutive extremely low blue bars, while daily volume continues to decline. That setup historically resolves with an outsized move in either direction.
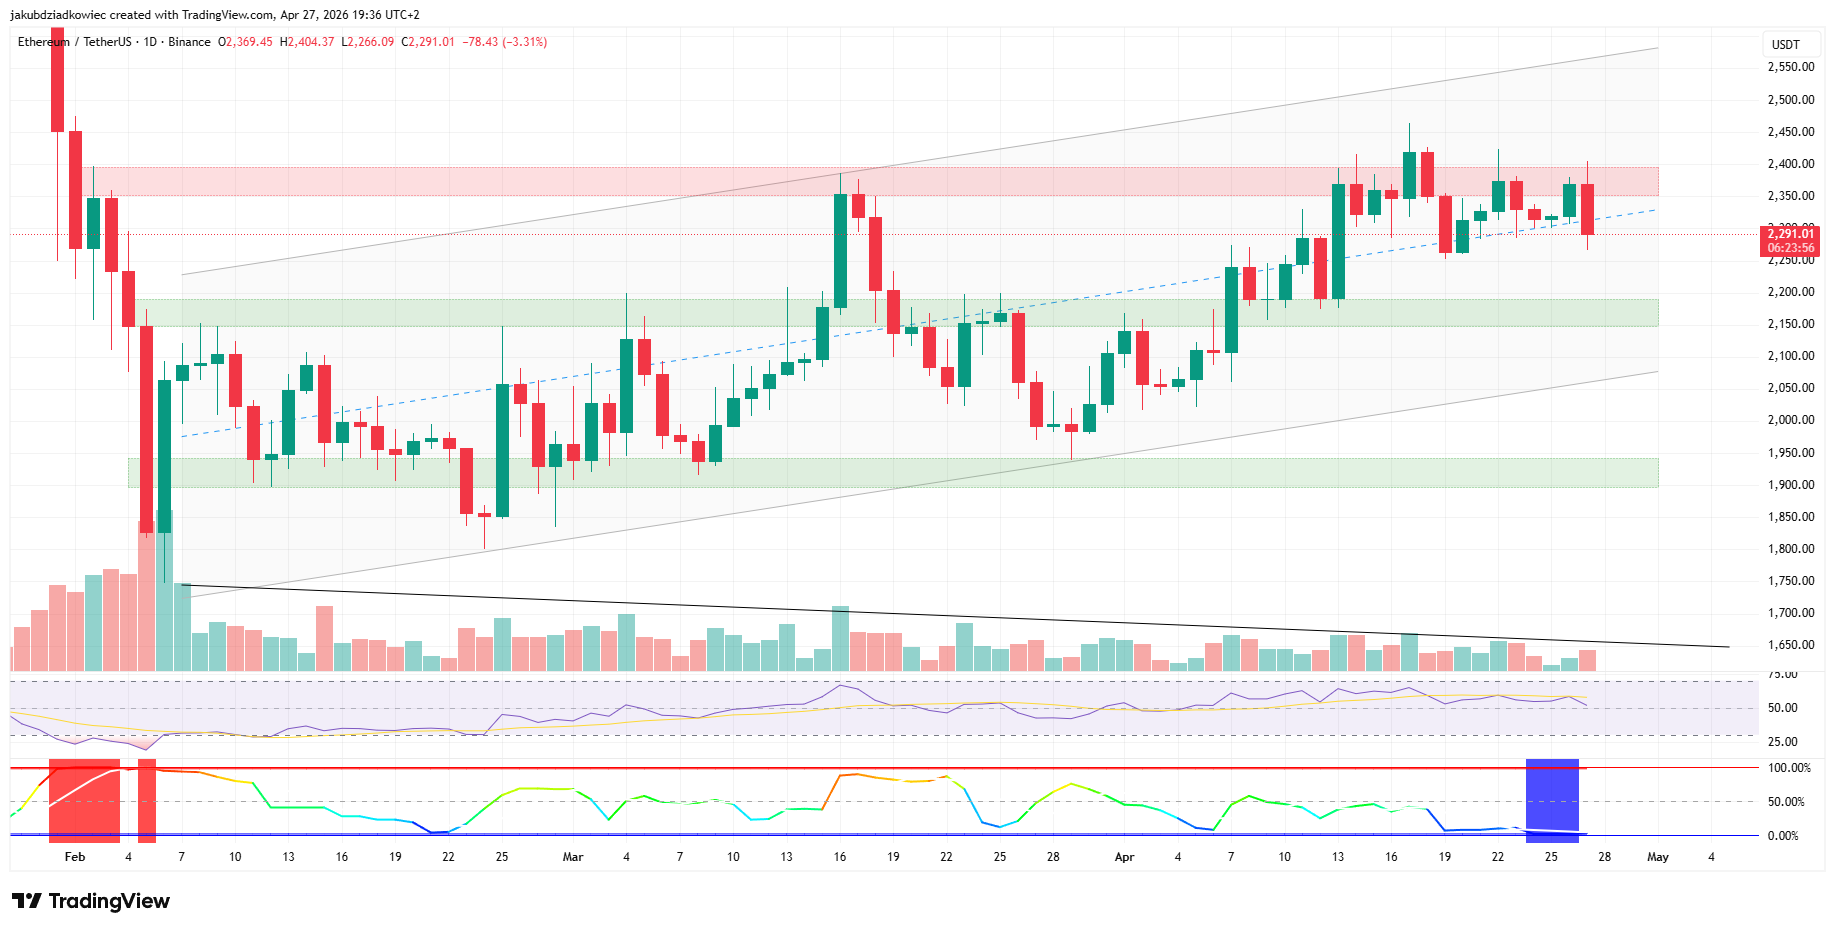 ETH daily chart / Source: Tradingview
4-Hour Ethereum Chart Confirms Active Bearish Momentum
While the daily picture still hides inside a multi-month structure, the 4-hour ETH/USDT chart already shows visible damage. Price broke its short-term ascending trendline and is currently testing the 0.382 Fibonacci retracement at $2,264.
If that level fails, the next high probability support sits in the golden pocket just above $2,114. The BBWP volatility indicator prints extremely high readings (red), which contrast with the daily compression and confirm that fast money is already active in the move.
RSI on the 4-hour timeframe has rolled over into bearish territory, and short-term volume increased on the trendline break. This is a classic confirmation that sellers are in control of the immediate trend.
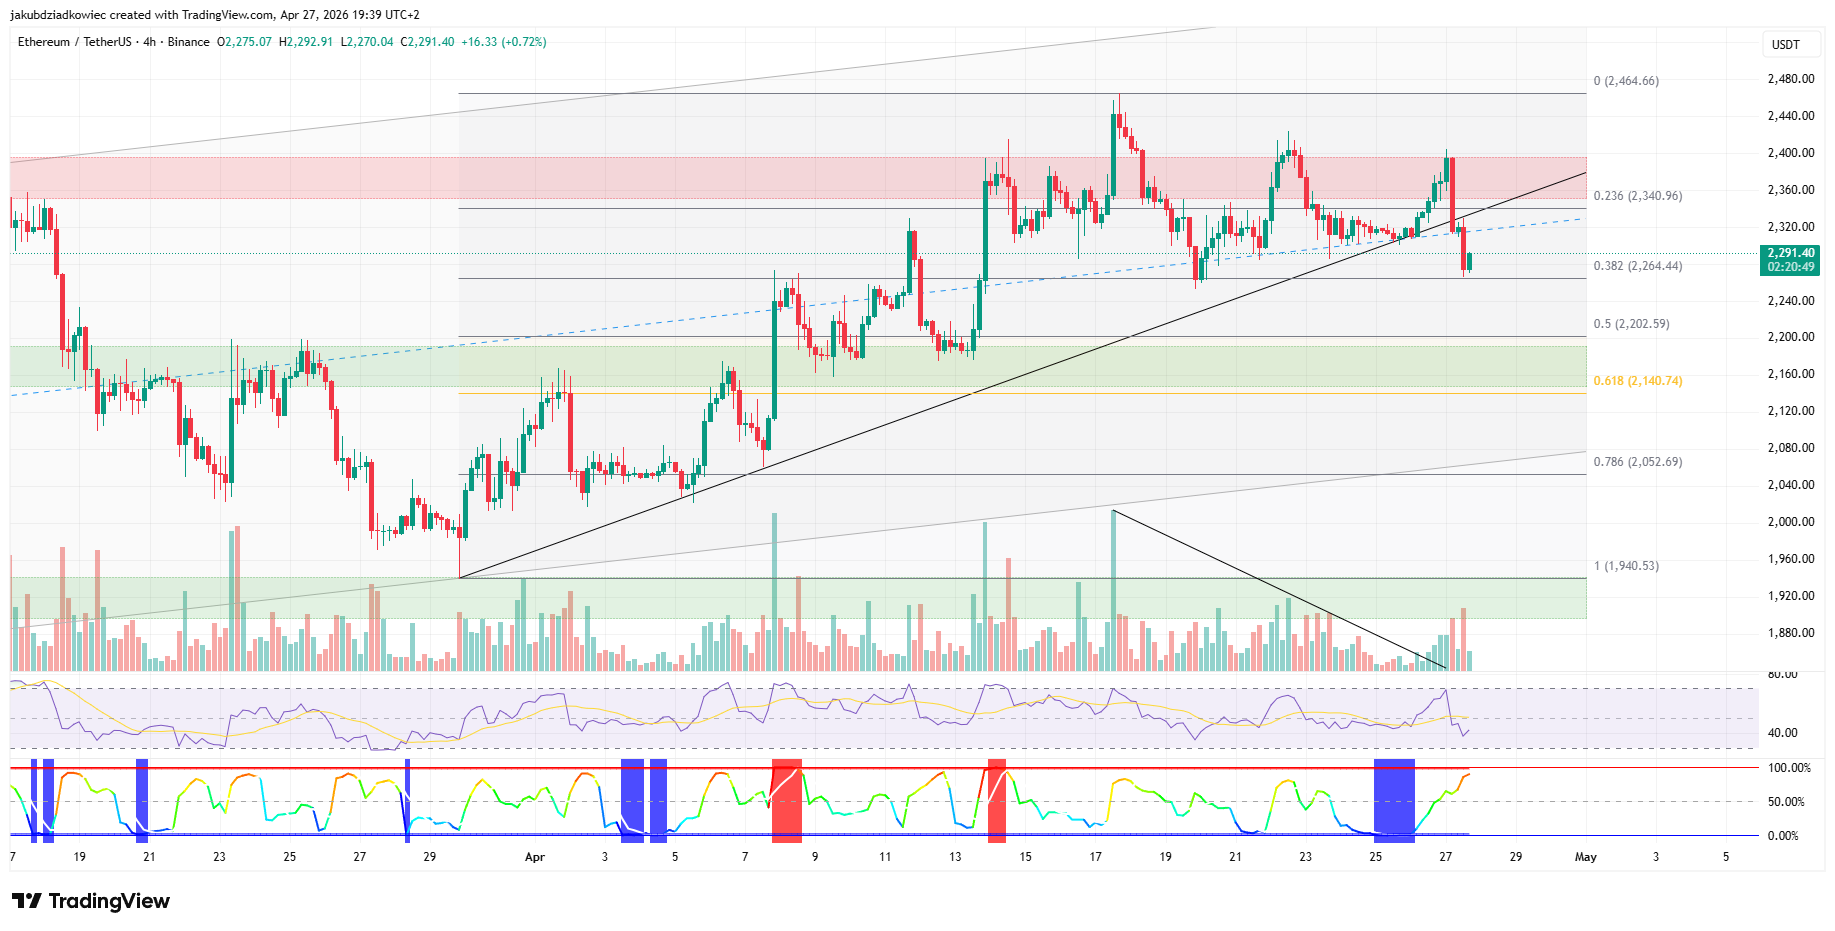 ETH 4-hourly chart / Source: Tradingview
Michael van de Poppe Eyes 0.026 BTC for Ethereum Long-Term Positions
The relative weakness against Bitcoin reinforces the bearish case. Analyst Michael van de Poppe highlighted 0.032 BTC as the level that would reopen upside, and 0.026 BTC as the higher-timeframe support that matters for long-term positions.
“I keep repeating the crucial levels for $ETH. Unfortunately, it broke down, which means that there’s no continuation of the uptrend, yet. As long as it stays below 0.032 $BTC, I’m not interested until I see a clear bottoming formation or when it tests 0.026. The latter is a higher timeframe support area, which I find important to monitor for long-term positions,” says Michael van de Poppe
He also noted that the prior cycle bottom for ETH was marked in April 2025, framing 0.026 BTC as the area where institutional and long-term accumulation becomes interesting again.
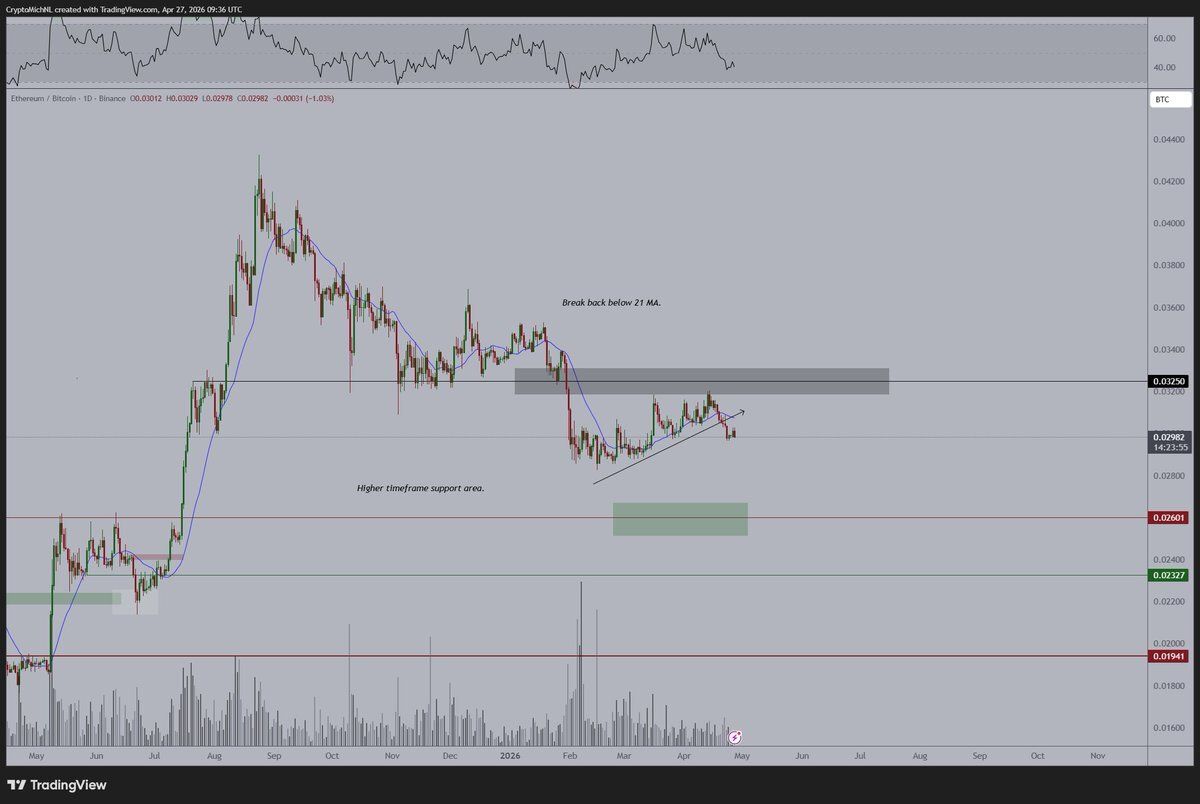 ETH/BTC daily chart / Source: X
ETH/BTC 12-Hour Chart Targets 0.028 BTC After Channel Loss
The 12-hour ETH/BTC chart shows the same weakness in motion. A well-established ascending parallel channel defined price action through February, March, and most of April, but the lower band gave way on April 23. Today, the pair is collapsing after a textbook retest from below.
Projecting the channel height to the breakdown point yields a measured move target of 0.028 BTC, aligning with the broader bearish scenario outlined by Van de Poppe.
The Relative Strength Index (RSI) prints a bearish reading, while volatility has compressed sharply right after the break. That combination historically precedes continuation rather than reversal, suggesting the pair is coiling for the next leg lower.
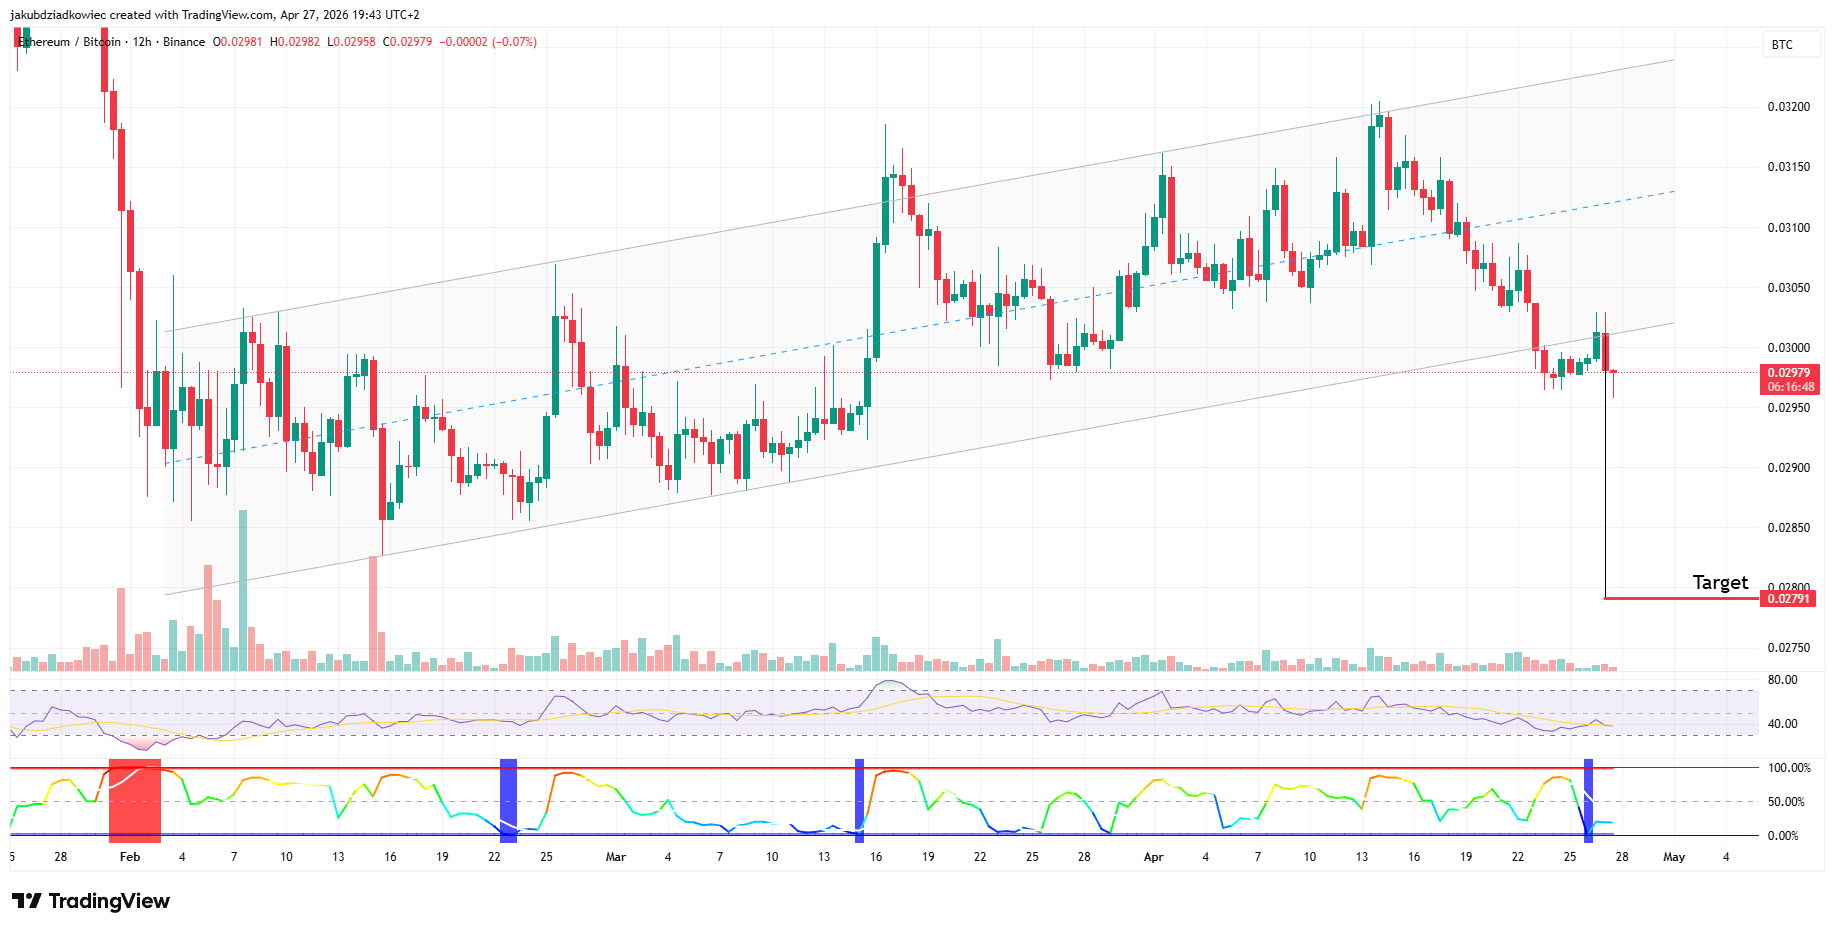 ETH/BTC 12-hourly chart / Source: Tradingview
The next 48 to 72 hours will likely determine whether Ethereum defends the daily channel or unwinds toward the spring lows, and traders watching higher-timeframe targets above will need that defense to hold.
The post Ethereum Price Faces a New Risk and Potential Dip – Here’s Why appeared first on BeInCrypto.


 English (US) ·