
 4 months ago
48
4 months ago
48
Ethereum price started a recovery wave above $2,050. ETH is now consolidating and eyeing an upside break above the $2,150 resistance.
- Ethereum managed to stay above $1,950 and recovered some losses.
- The price is trading above $2,020 and the 100-hourly Simple Moving Average.
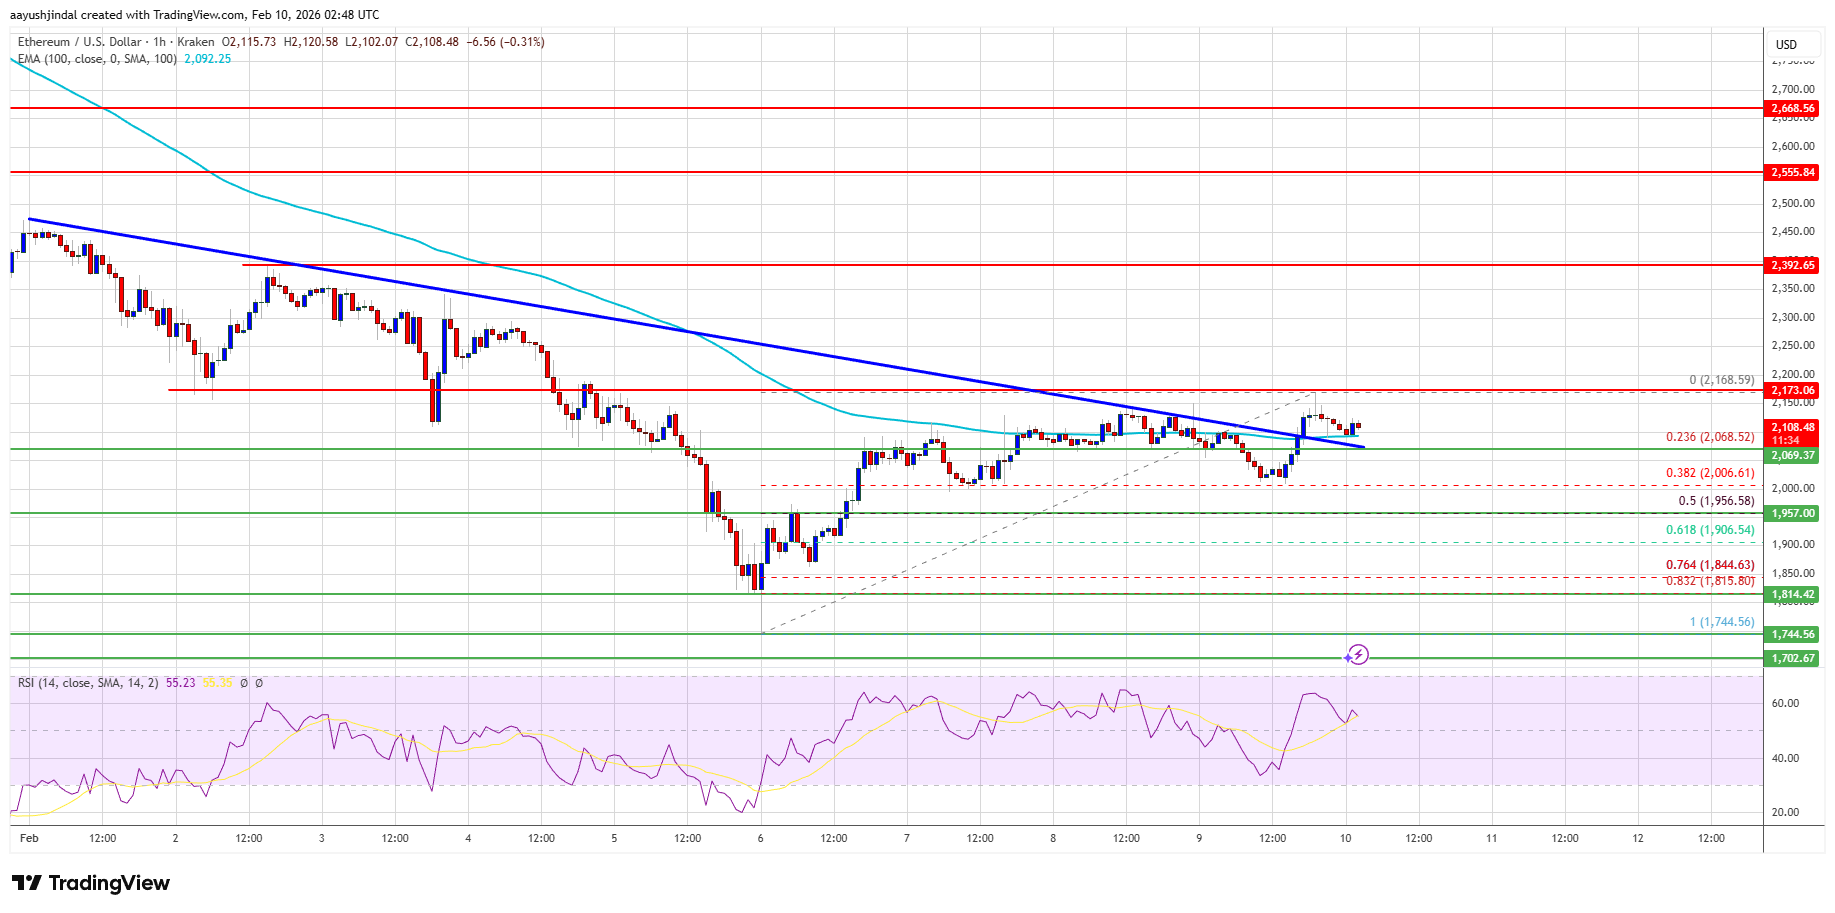
- There was a break above a major bearish trend line with resistance at $2,070 on the hourly chart of ETH/USD (data feed via Kraken).
- The pair could start a fresh decline if it stays below the $2,165 zone.
Ethereum Price Eyes Upside Break
Ethereum price managed to form a base above $1,950 and started a recovery wave, like Bitcoin. ETH price traded above the $1,980 and $2,000 resistance levels.
Besides, there was a break above a major bearish trend line with resistance at $2,070 on the hourly chart of ETH/USD. The pair even spiked above $2,150. A high was formed at $2,168, and the price is now consolidating gains above the 23.6% Fib retracement level of the upward move from the $1,744 swing low to the $2,168 high.
Ethereum price is now trading above $2,050 and the 100-hourly Simple Moving Average. If the bulls remain in action above $2,020, the price could attempt another increase. Immediate resistance is seen near the $2,150 level.
The first key resistance is near the $2,165 level. The next major resistance is near the $2,250 level. A clear move above the $2,250 resistance might send the price toward the $2,350 resistance. An upside break above the $2,350 region might call for more gains in the coming days. In the stated case, Ether could rise toward the $2,550 resistance zone or even $2,665 in the near term.
Another Decline In ETH?
If Ethereum fails to clear the $2,150 resistance, it could start a fresh decline. Initial support on the downside is near the $2,050 level. The first major support sits near the $2,020 zone.
A clear move below the $2,020 support might push the price toward the $1,950 support or the 50% Fib retracement level of the upward move from the $1,744 swing low to the $2,168 high. Any more losses might send the price toward the $1,845 region. The main support could be $1,800.
Technical Indicators
Hourly MACD – The MACD for ETH/USD is losing momentum in the bearish zone.
Hourly RSI – The RSI for ETH/USD is now above the 50 zone.
Major Support Level – $2,020
Major Resistance Level – $2,165


 English (US) ·