
 1 month ago
47
1 month ago
47

Focus Universal Inc. stock closed at $11.60 on July 31 after an explosive session spanning $8.42 to $17.59 on 93.4 million shares. The surface-level bullish surge masks deep intraday exhaustion, creating a market defined by conflicting signals across timeframes.
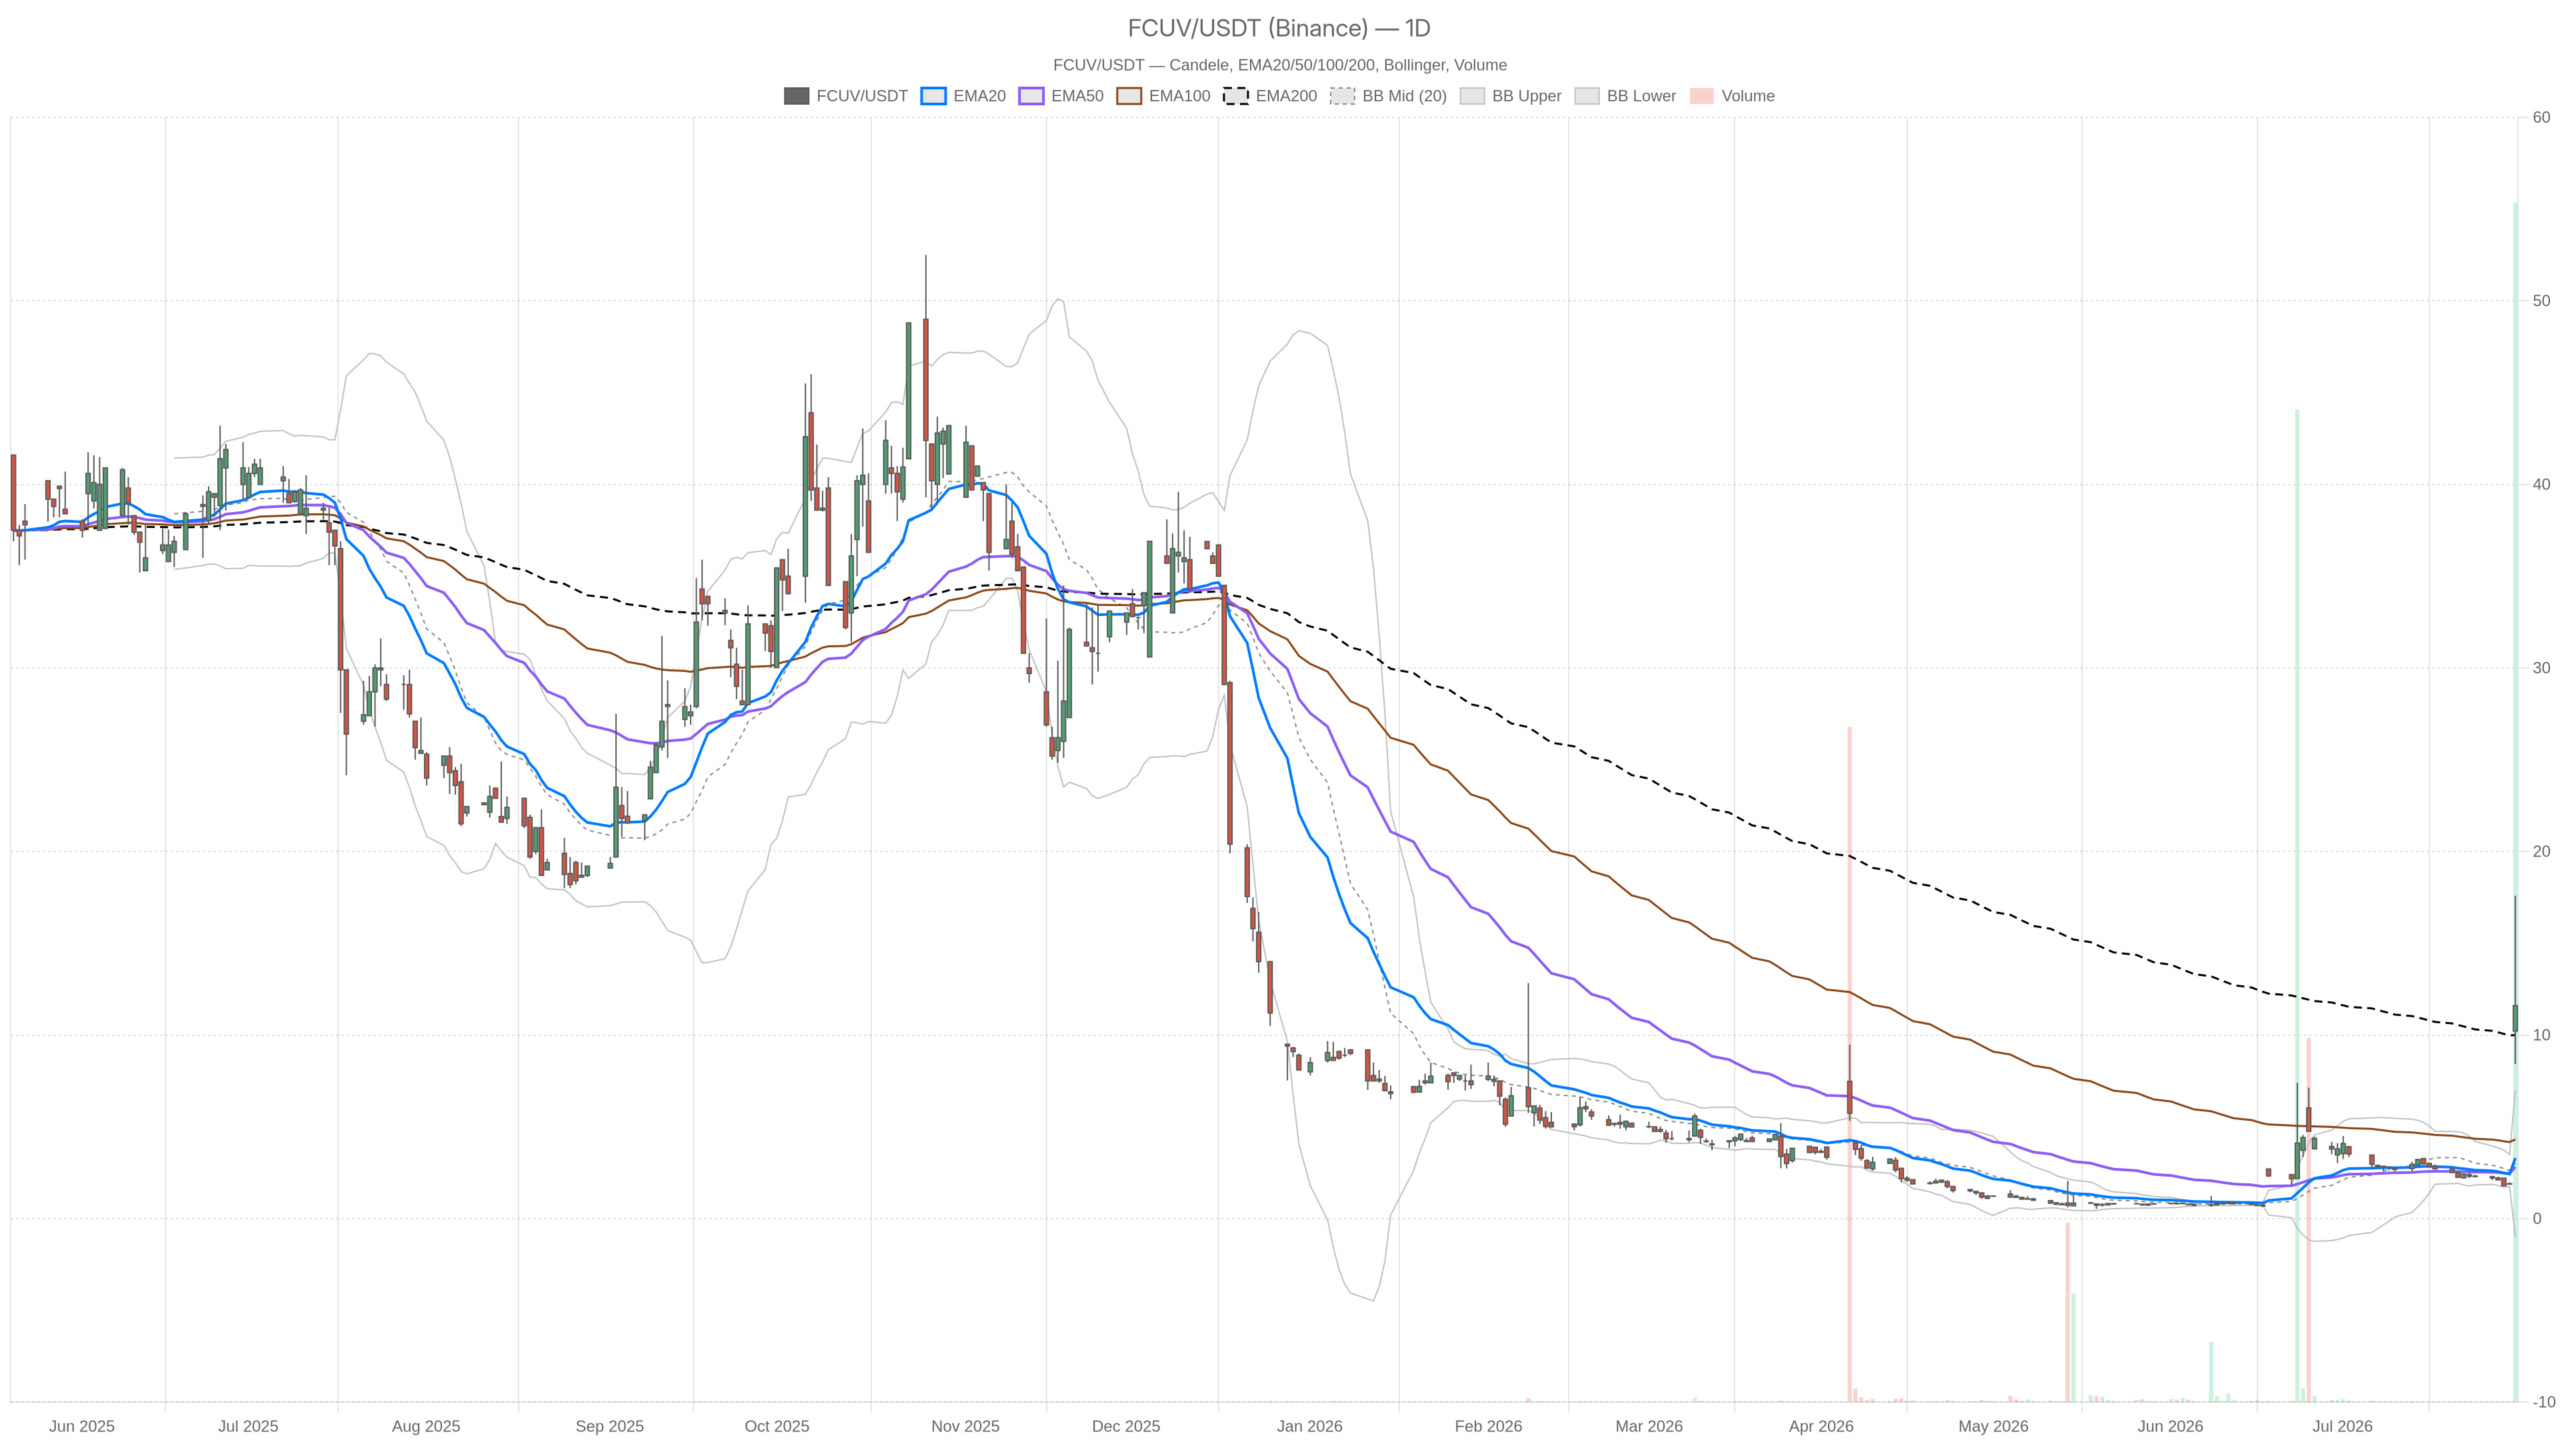 FCUV — daily chart with candlesticks, EMA20/EMA50 and volume.
Key takeaways
- FCUV closed at $11.60 after an intraday range of $8.42 to $17.59 on July 31.
- Daily RSI14 reached 87.3, a historically extreme overbought reading.
- Volume exploded to 93.4 million shares, confirming speculative intensity.
- The daily pivot at $12.54 remains unreclaimed, with support at $7.48.
- The 15-minute chart shows momentum already flipping bearish despite the daily uptrend.
Focus Universal Inc. Stock Daily Structure: Explosive Trend, Extreme Overbought
The daily chart confirms a powerful uptrend in Focus Universal Inc. stock, but overbought extremes now dominate the technical picture. Further upside without a pause is increasingly unlikely at these levels.
RSI and MACD: Overbought Warning Against Constructive Momentum
The daily RSI14 sits at 87.3, leaving almost no room for further upside without a pullback. Readings this extreme rarely mark sustainable conditions. Meanwhile, MACD remains constructive. The line at 0.62 sits above the signal at 0.15, and the positive histogram of 0.47 confirms upward momentum is technically intact. However, the RSI warning cannot be ignored.
EMA Structure: The Speed of Repricing
EMA20 stands at 3.30 and EMA50 at 2.81, both far below the current price. EMA200 sits at 10.00, just under the close. This spread shows Focus Universal Inc. stock has sharply repriced higher in a very short window. Such moves routinely produce the overbought extremes now visible on RSI.
Bollinger Bands and Pivots: Measuring the Overextension
Bollinger Bands show a mid-line of 3.02 and an upper band of 7.03. The close at $11.60 sits well above the upper band, reinforcing the overextended nature of the move. ATR14 at 1.36 confirms elevated volatility, though it understates the true intraday swing. Pivot levels frame the immediate battleground. The daily pivot stands at $12.54, resistance at $16.65, and support at $7.48. Notably, the close sits below the pivot, meaning bulls have not reclaimed the session’s balance point.
1H Timeframe: Bullish Regime with Cooling Momentum
The hourly chart remains structurally bullish for Focus Universal Inc. stock. However, the most recent candle shows the same rejection pattern seen on the daily timeframe.
The 1-hour chart carries a bullish label, and the numbers support that classification. RSI14 reads 71.53, MACD histogram is positive at 1.05, and EMA20, EMA50, and EMA200 are stacked in ascending order at 7.58, 4.85, and 3.44. That alignment is textbook uptrend structure.
Still, the most recent hourly candle undercuts some of that optimism. Price opened at 13.67, reached 14.60, then dropped to 11.00 before closing at $11.60, near the bottom of its own range. That is the same rejection pattern seen on the daily chart, compressed into a single hour. In other words, the trend remains active but is not confirming strength at current levels. Pivot data reinforces this. The hourly pivot sits at 12.40, resistance at 13.80, and support at 10.20. Price currently trades below its own pivot point.
15m Execution View: Momentum Has Already Flipped
The 15-minute chart reveals short-term momentum in Focus Universal Inc. stock has already turned neutral to bearish. This creates a direct conflict with the daily uptrend.
RSI14 has cooled to 48.69, essentially neutral. That is a sharp contrast to the daily reading of 87.3. MACD has turned negative on this timeframe, with the histogram at -0.63, signaling short-term momentum has already rolled over. EMA20 on the 15-minute chart sits at 12.80, above the current close of $11.60. Price has slipped below its own short-term average.
This is a clear example of timeframes disagreeing. The daily and hourly charts still carry bullish trend characteristics. However, the 15-minute structure shows momentum fading in real time. For execution purposes, that divergence matters. Entries chasing daily strength could be stepping into a pullback already underway.
Bullish Scenario for Focus Universal Inc. Stock
A bullish continuation for Focus Universal Inc. stock requires reclaiming the daily pivot at $12.54 and defending the $11 area. Buyers must also hold above the hourly pivot near 12.40. If the $11 low holds and RSI cools without a sharp price breakdown, the uptrend could resume toward daily resistance at $16.65. A reversal of the negative 15-minute MACD histogram into positive territory would offer an early sign that short-term selling pressure is fading.
Bearish Scenario for Focus Universal Inc. Stock
The bearish case for Focus Universal Inc. stock centers on mean reversion from an RSI of 87.3. That is a level which historically precedes at least a temporary pullback. A break below hourly support at $10.20, and especially below daily support at $7.48, would invalidate the bullish thesis. The large upper wick from Wednesday’s session already suggests distribution occurred at elevated prices. If the 15-minute downtrend in momentum extends and drags hourly RSI toward neutral, the stock risks retracing a meaningful portion of its recent surge.
Closing Take
Focus Universal Inc. stock presents a market defined by conflicting signals across timeframes, with elevated volatility arguing for caution regardless of directional bias. The daily chart shows a powerful move alongside extreme overbought conditions. The hourly chart is technically bullish but shows the same intraday rejection pattern. Meanwhile, the 15-minute chart has already turned neutral to bearish on momentum. Given the scale of the recent move, uncertainty around the next directional resolution remains high. Traders should weigh both scenarios carefully rather than assume strength extends in a straight line.
FAQ
What was Focus Universal Inc. stock’s closing price on July 31?
FCUV closed at $11.60 on July 31 after an extraordinarily volatile session that saw the stock swing from $8.42 to $17.59 intraday.
What does an RSI of 87.3 mean for FCUV?
An RSI14 at 87.3 signals extreme overbought conditions. It leaves little room for further upside without a pause or pullback. Readings this high are rare and typically mark a stretched market rather than a sustainable one.
What are the key support and resistance levels for FCUV?
Daily support sits at $7.48, with hourly support at $10.20. Resistance levels include the daily pivot at $12.54 and the upper resistance at $16.65.
Is short-term momentum still bullish for FCUV?
No. The 15-minute chart shows momentum has already flipped. RSI stands at 48.69 and the MACD histogram is negative at -0.63, even though the daily trend remains structurally bullish.
Disclaimer: This article is for informational purposes only and does not constitute financial advice, an investment recommendation, or a solicitation to buy or sell any financial instrument or cryptocurrency. The analysis provided is not indicative of future results. Investing in crypto assets and financial markets carries a high risk of capital loss. Always do your own research (DYOR) and consult a qualified financial advisor before making any decision.
Article produced with the assistance of artificial intelligence and reviewed by the editorial team.






 English (US) ·