
 1 month ago
64
1 month ago
64

Ford stock enters Q2 earnings week in a bullish technical posture across all monitored timeframes. At $14.53 on July 27, shares hold above key moving average support as a Jefferies upgrade shifts analyst sentiment. The convergence of technical structure and fundamental catalysts makes this a pivotal moment.
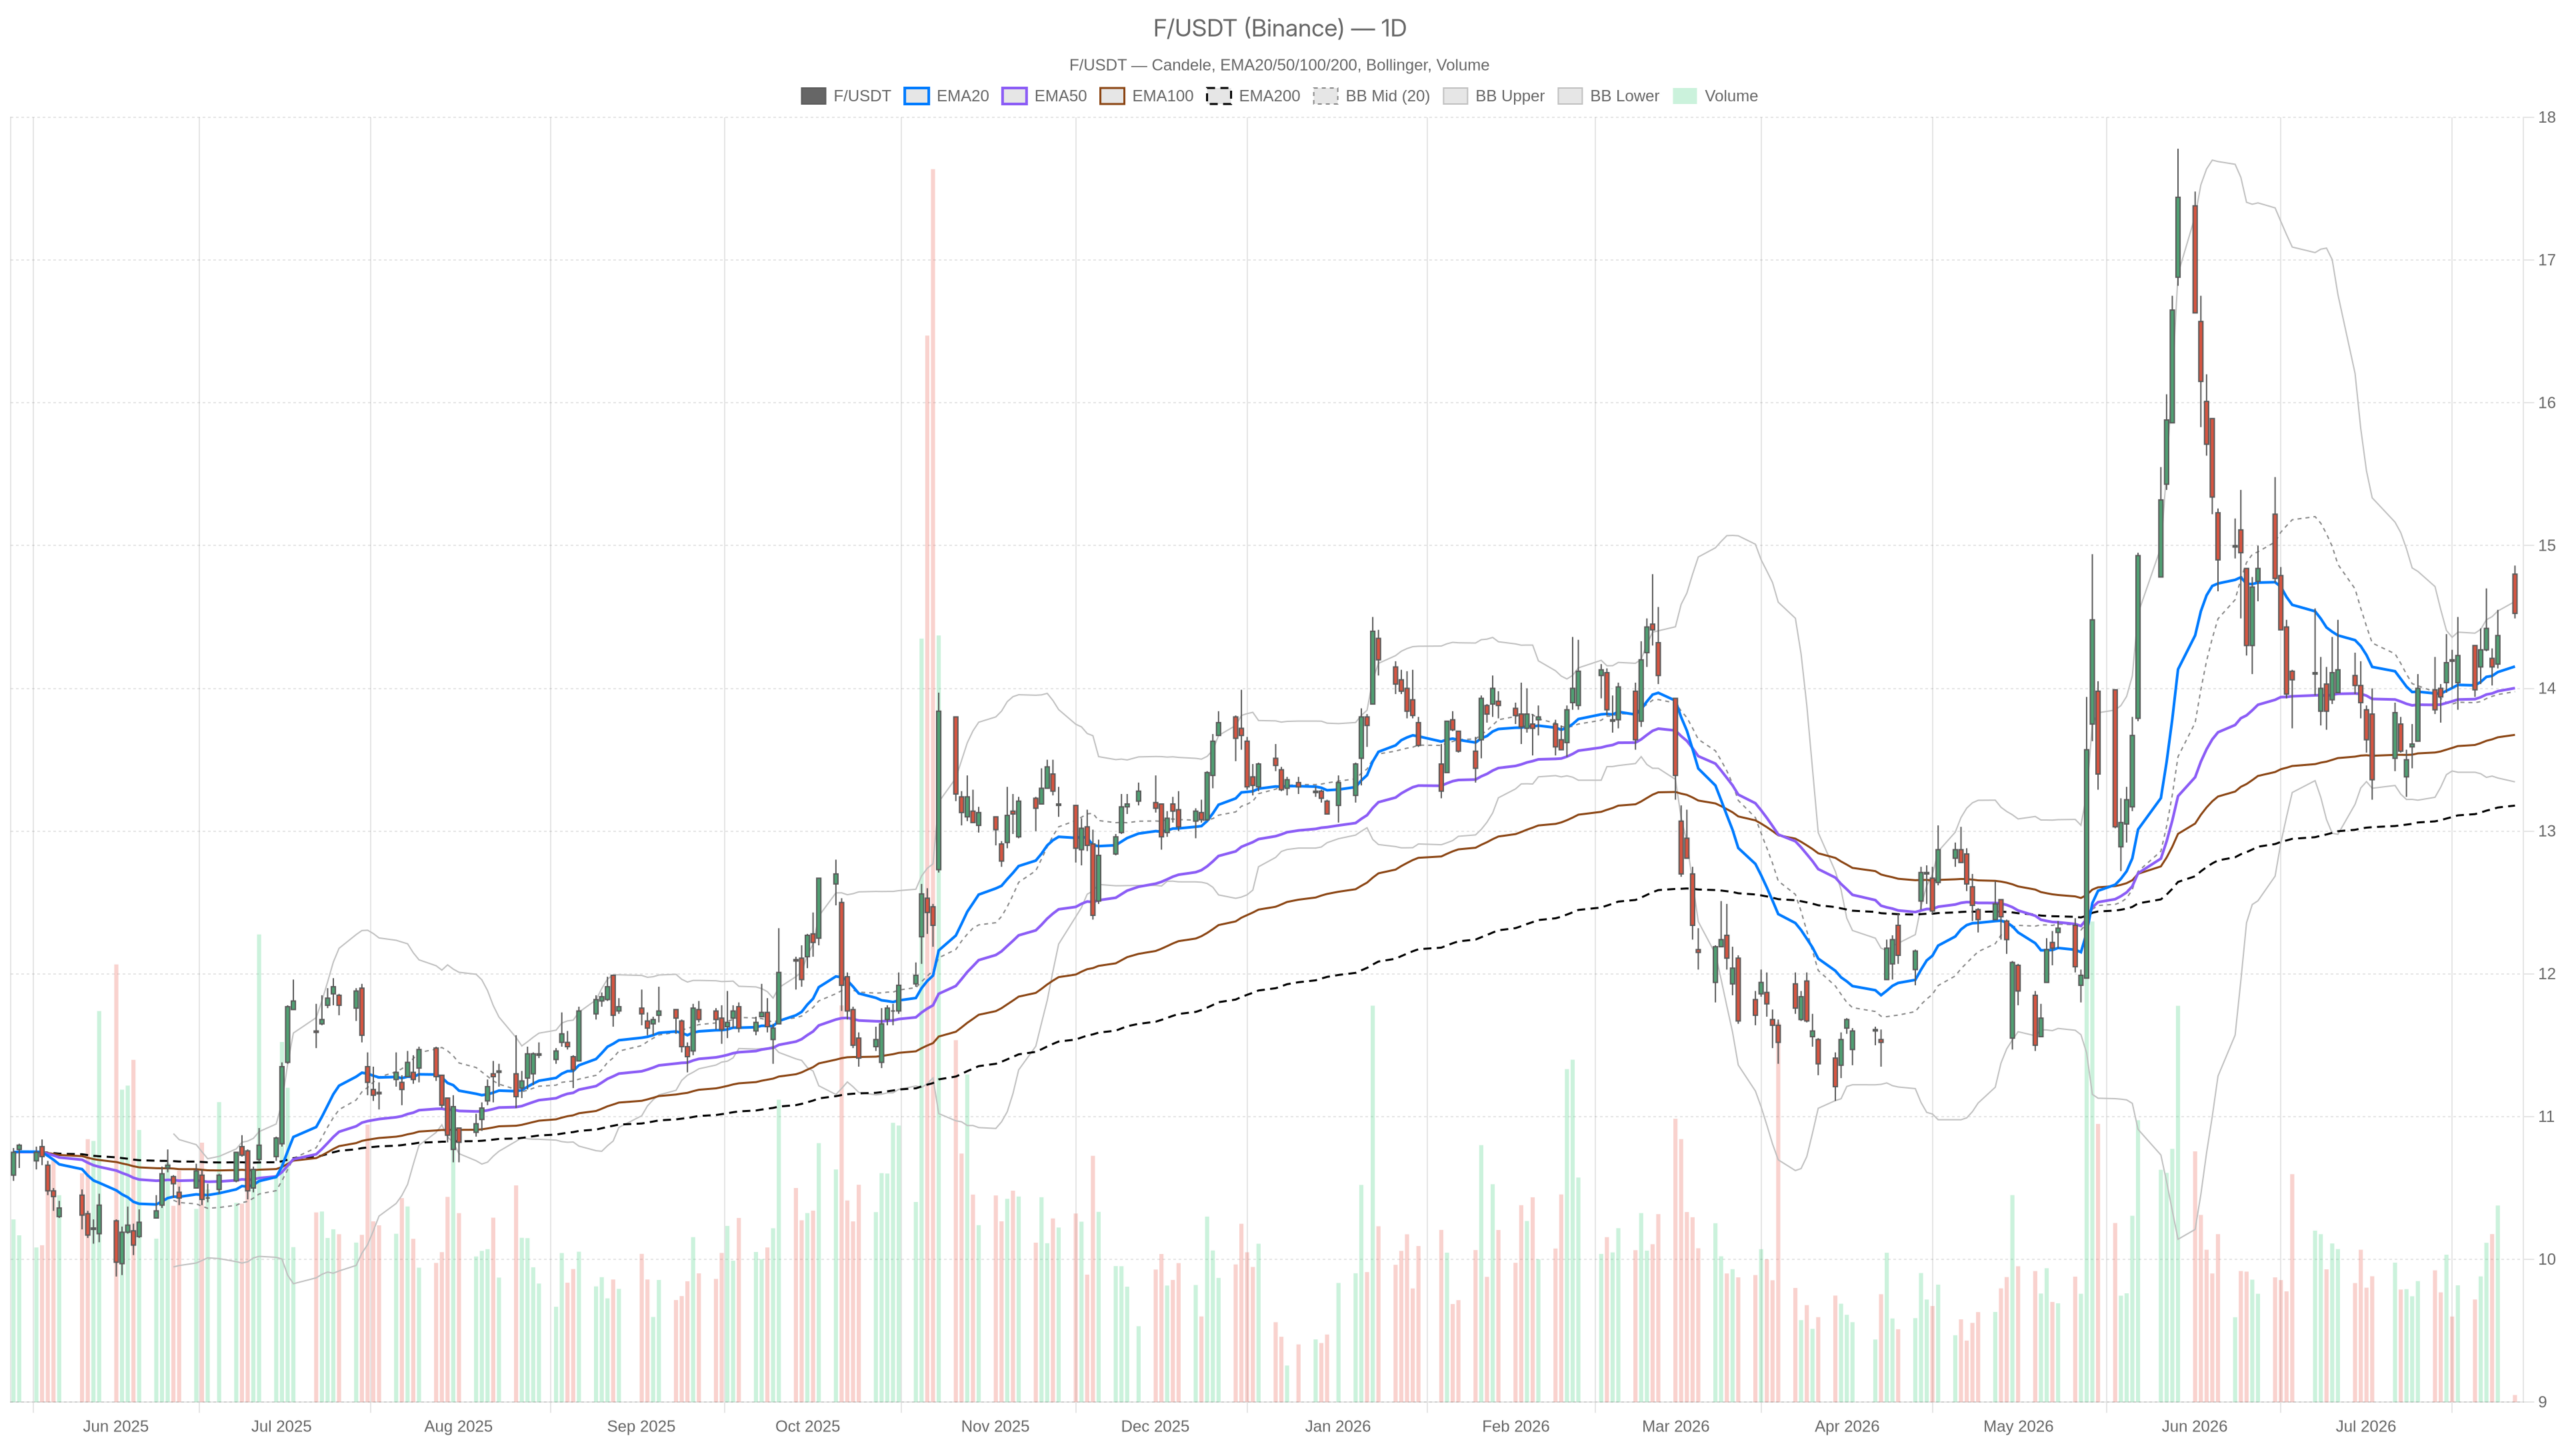 F — daily chart with candlesticks, EMA20/EMA50 and volume.
Key takeaways
- Ford stock trades at $14.53 on July 27, above its 20-day EMA ($14.15), 50-day EMA ($14.00), and 200-day EMA ($13.18).
- Daily RSI at 56.97 signals positive momentum without reaching overbought conditions.
- Jefferies upgraded Ford to buy from hold on July 27, citing stronger margins ahead of Q2 earnings.
- The daily pivot at $14.63 and R1 at $14.76 are the critical overhead resistance levels to watch.
- A close below the 50-day EMA at $14.00 would shift the technical bias from constructive to neutral.
Daily Timeframe Sets a Constructive Bias for Ford Stock
Ford stock’s daily chart confirms a bullish bias — the EMA stack is cleanly ordered and price trades above all three key moving averages. The 20-day EMA sits at $14.15, the 50-day EMA at $14.00, and the 200-day EMA at $13.18. This layered trend support reflects sustained accumulation over weeks, not a random alignment.
Meanwhile, the daily RSI at 56.97 tells a measured story. It signals positive momentum without entering overbought territory, leaving room for continuation. The MACD histogram at 0.07, with the line crossing above the signal, adds further weight to the bullish momentum read.
However, the Bollinger Band context introduces a note of caution. The daily session opened at $14.80 and closed at $14.53 — near the upper band at $14.61. The intraday high of $14.86 briefly breached that band before price pulled back. That rejection is worth watching. It does not break the bullish thesis, but it suggests the stock needs brief consolidation before any sustained push higher.
In terms of levels, the daily pivot at $14.63 acts as the immediate overhead reference. R1 sits at $14.76, while S1 at $14.39 represents the first meaningful support below current price. The ATR of $0.41 implies daily swings remain moderate, keeping risk manageable for positioning ahead of earnings.
Hourly Structure Confirms the Trend Without Adding Fuel
The 1H chart supports the bullish view for Ford stock but lacks aggressive momentum. EMAs are stacked below price — the 20 at $14.33, 50 at $14.25, and 200 at $14.24. The near-convergence of the 50 and 200 on this timeframe is notable. It signals the longer-range hourly trend has only recently turned constructive, aligning with a recovery rather than a mature trend.
In parallel, the 1H RSI at 59.09 sits comfortably in bullish territory without suggesting exhaustion. The MACD histogram remains positive at 0.03, though the signal is moderate — not a strong acceleration signal. Overall, the hourly timeframe confirms the daily bias without amplifying it. Price action is grinding rather than surging.
At the same time, the tight 1H Bollinger Band range keeps price compressed, with the upper band at $14.62 and the lower at $13.98. The hourly ATR of just $0.16 reflects subdued intraday volatility. This compression often precedes a sharper directional move, particularly into a catalyst like Q2 earnings.
Short-Term Execution Context: 15-Minute Signals Stay Aligned
The 15-minute chart reinforces the broader bullish read on Ford stock, with no divergences or reversal signals challenging the daily or hourly outlook. Price trades above the 20, 50, and 200 EMAs on this timeframe, and the regime remains bullish.
Similarly, RSI at 57.46 and a MACD histogram of 0.02 suggest mild but intact momentum. In short, the 15m view offers no reason to fade the trend heading into the close of Monday’s session. The execution context remains modestly constructive.
Analyst Upgrades and Earnings Catalyst Add Fundamental Weight
Fundamental catalysts add weight to Ford stock’s technical setup. Jefferies upgraded Ford to buy from hold on July 27, citing stronger margins ahead of earnings. That move landed during an active week of analyst reshuffling, with Wall Street rotating into legacy automakers.
Notably, one valuation analysis flags that Ford stock may be trading roughly 14% above its DCF-based fair value estimate following a Spain EV deal. Still, the same analysis acknowledges that market multiples screen as relatively inexpensive — a mixed signal for fundamental traders. Over the past five years, Ford stock has returned 39.4%, providing context for current valuation debates without resolving them.
Bullish Scenario: What Would Drive Ford Higher
Ford stock’s bullish scenario requires reclaiming the daily pivot at $14.63 on a closing basis. A sustained move above R1 at $14.76 would signal that buyers are absorbing overhead resistance with conviction. The setup rests on two pillars: a clean technical trend and a positive analyst shift entering earnings.
On the fundamental side, Q2 results confirming margin improvement — in line with Jefferies’ thesis — would provide the catalyst to close the gap to the upper band and potentially extend beyond it. In this scenario, the EMA stack below $14.15 acts as a strong buffer against any meaningful pullback.
Bearish Scenario: What Would Invalidate the Setup
The bearish case for Ford stock is not without merit. The upper Bollinger Band rejection on the daily chart was a real event. If price fails to reclaim $14.63 ahead of earnings and drifts below S1 at $14.39, the near-term momentum case weakens considerably.
Therefore, a disappointing Q2 report — particularly on margins or forward guidance — could trigger a sharp unwinding of pre-earnings positioning. Below the 50-day EMA at $14.00, the bias would shift from constructive to neutral. A close beneath the 200-day EMA at $13.18 would effectively invalidate the current bullish regime. The DCF premium flag adds another layer of vulnerability if sentiment turns on a guidance miss.
Positioning Into Earnings: Volatility and Uncertainty Remain Key
Ford stock enters Q2 earnings in a technically sound but volatility-compressed state. The alignment across daily, hourly, and 15-minute regimes is encouraging. However, the ATR profile suggests the market has not yet priced in a major directional move. Earnings will change that.
Still, the combination of an analyst upgrade, a pending catalyst, and a bullish EMA stack is notable. It creates a scenario where risk-reward skews modestly higher — provided the earnings narrative holds. Caution is warranted, however, given the valuation premium signal and the upper band resistance that capped Monday’s session.
FAQ
When does Ford report Q2 earnings?
Ford reports Q2 earnings on Tuesday after market close. The results are expected to be a significant catalyst for Ford stock, with margins and forward guidance in focus following the Jefferies upgrade.
What are the key resistance levels for Ford stock?
The immediate resistance is the daily pivot at $14.63, followed by R1 at $14.76. A sustained close above both levels would confirm buyer conviction and open the path toward the upper Bollinger Band near $14.61.
What would invalidate the bullish setup for Ford stock?
A close below the 50-day EMA at $14.00 would shift the bias from constructive to neutral. A break beneath the 200-day EMA at $13.18 would fully invalidate the current bullish regime.
What is the latest analyst rating on Ford stock?
Jefferies upgraded Ford stock to buy from hold on July 27, citing expectations for stronger margins ahead of the Q2 earnings release.
Disclaimer: This article is for informational purposes only and does not constitute financial advice, an investment recommendation, or a solicitation to buy or sell any financial instrument or cryptocurrency. The analysis provided is not indicative of future results. Investing in crypto assets and financial markets carries a high risk of capital loss. Always do your own research (DYOR) and consult a qualified financial advisor before making any decision.
Article produced with the assistance of artificial intelligence and reviewed by the editorial team.






 English (US) ·