
 1 month ago
54
1 month ago
54

GameStop Corporation stock plunged to $19.06 — its lowest since August 2024 — after the company announced a $1.4 billion convertible note exchange for Class A shares. Volume exceeded 40 million shares, confirming an active repricing event tied directly to the debt-for-equity news.
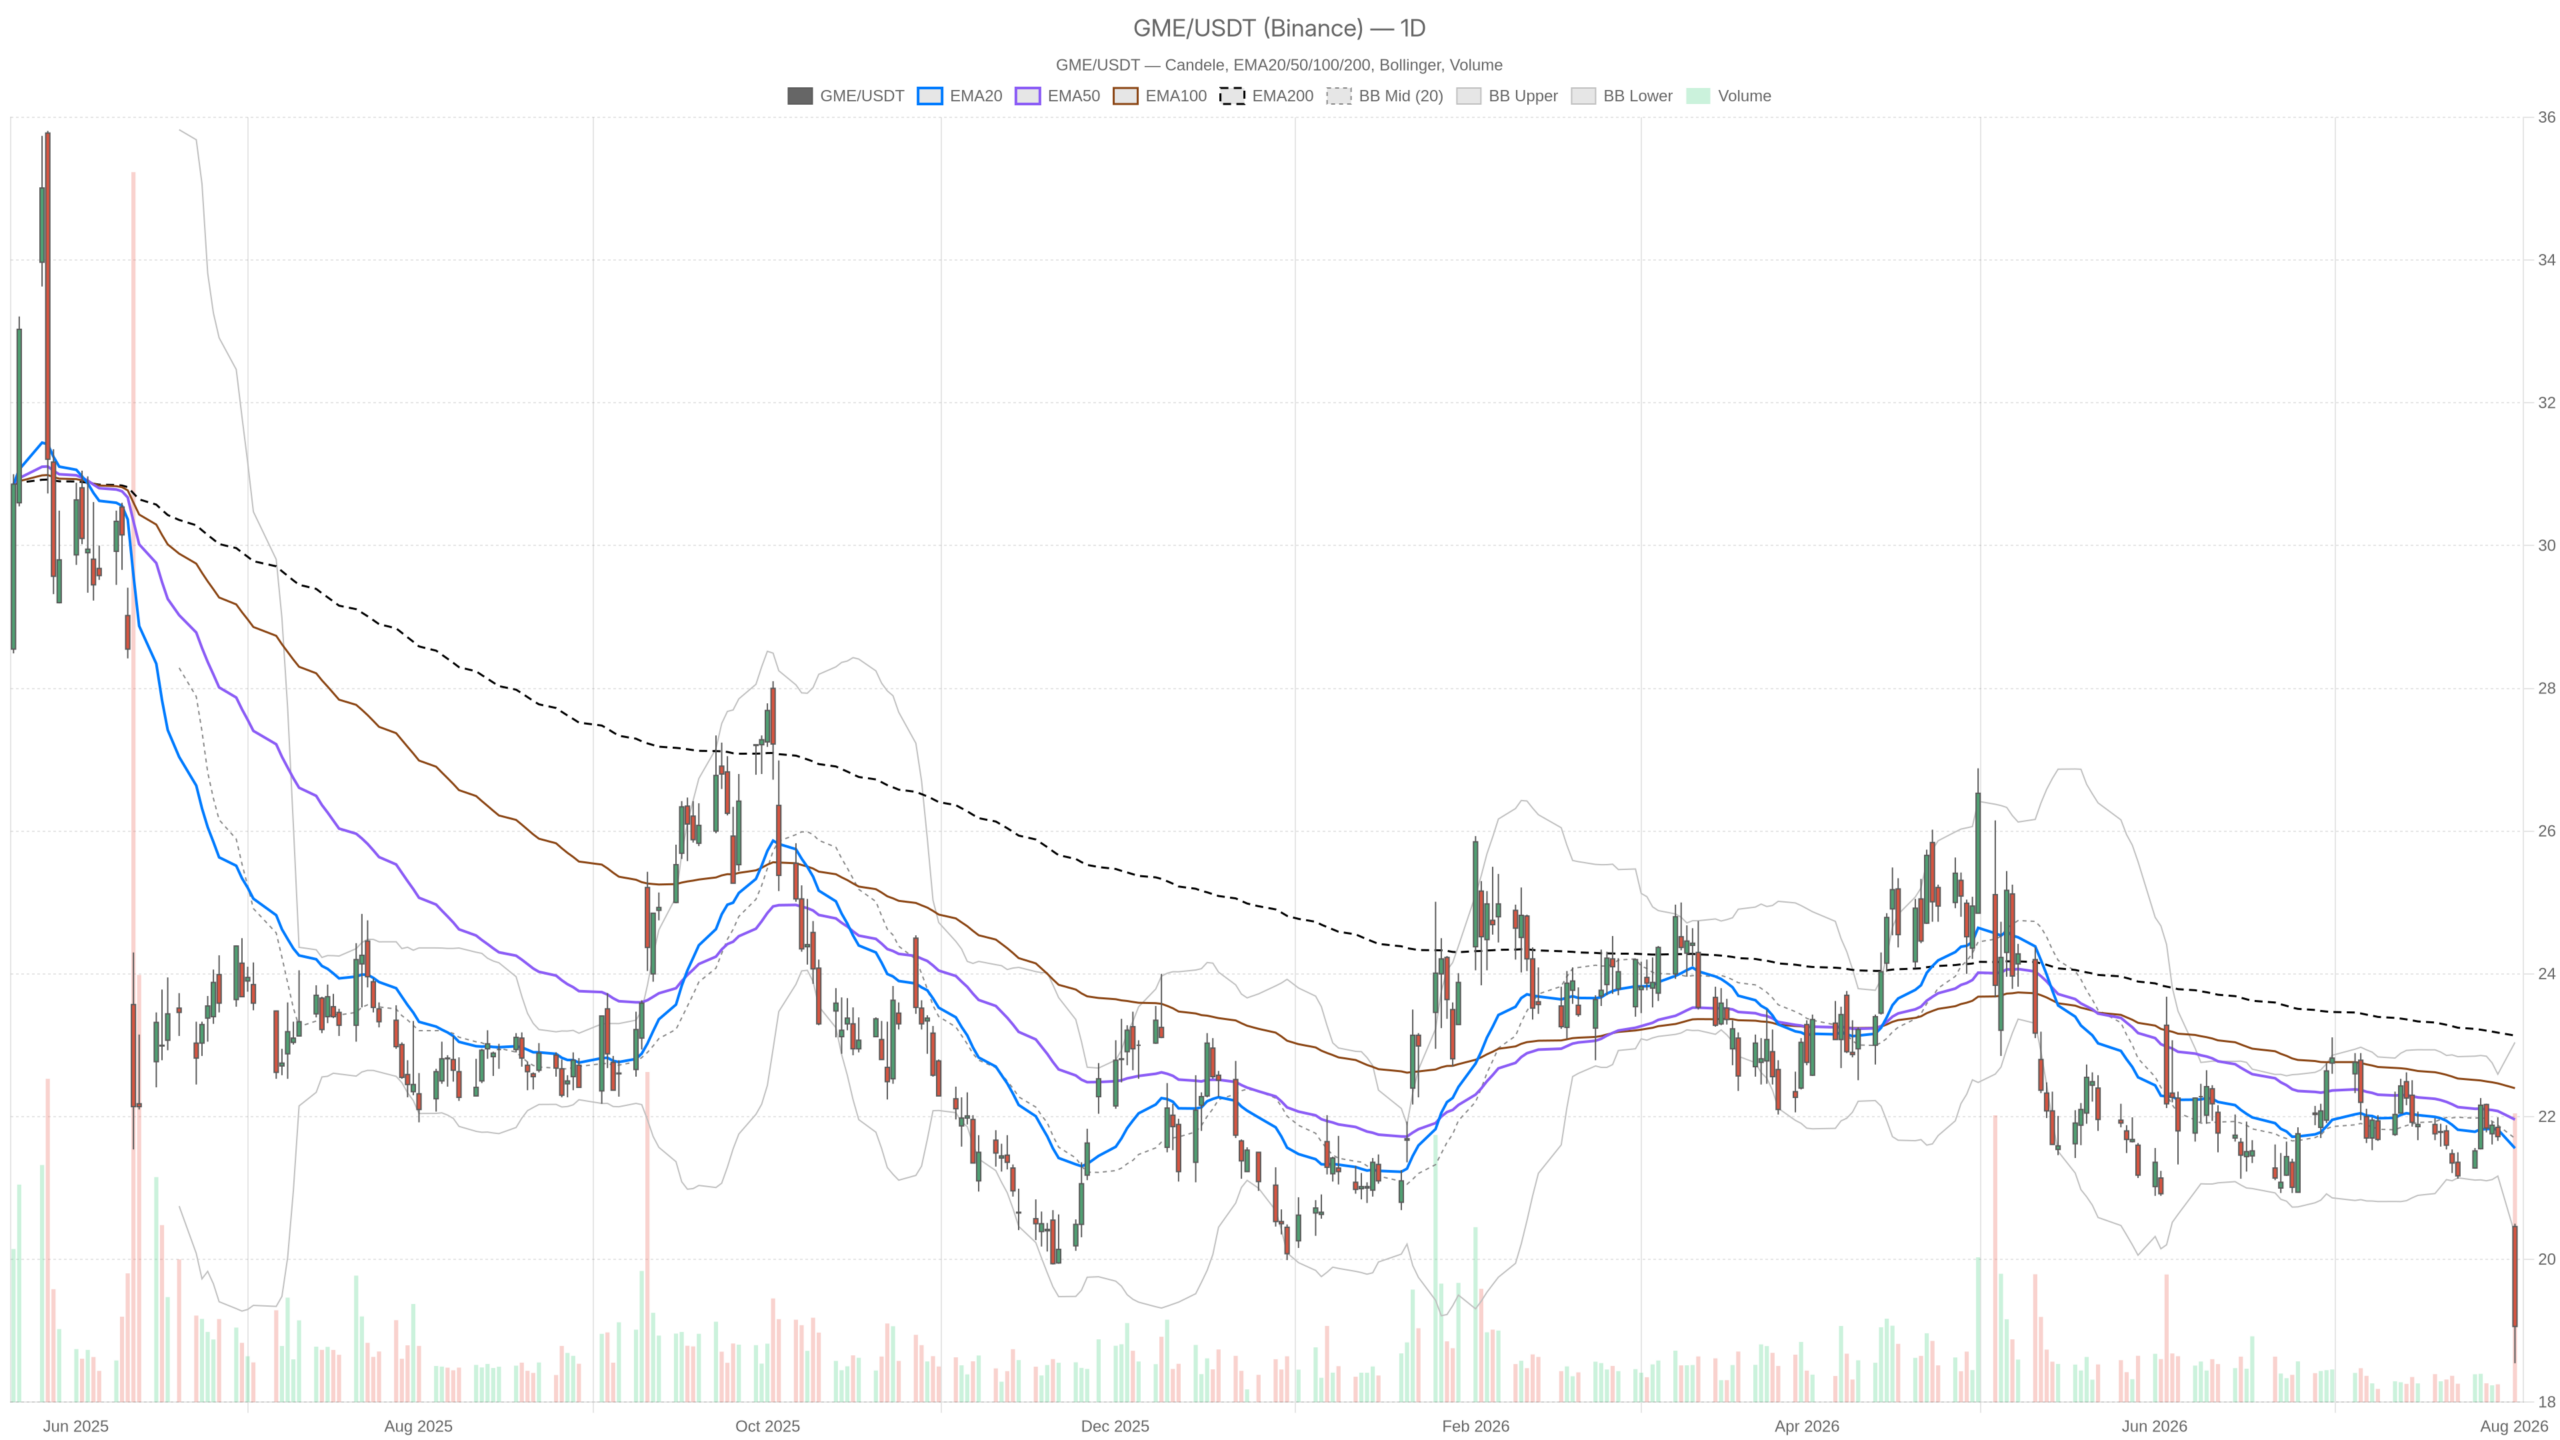 GME — daily chart with candlesticks, EMA20/EMA50 and volume.
Key takeaways
- GameStop Corporation stock closed at $19.06, marking its lowest level since August 2024.
- The selloff was triggered by a $1.4 billion convertible note exchange plan for Class A shares.
- Daily volume exceeded 40 million shares, signaling an active repricing rather than a passive drift.
- The daily RSI14 sits at 27.16, deep in oversold territory, while the MACD histogram continues to widen.
- Key support sits at 18.24 and resistance at 20.19 on the daily timeframe.
Daily Structure Confirms a Bearish Bias
The daily chart confirms a firmly bearish structure, with price trading below all three major moving averages and momentum indicators still pointing lower. On the daily timeframe, the technical picture aligns cleanly with the fundamental trigger. Price is trading well below the EMA20 at 21.56, the EMA50 at 21.96, and the EMA200 at 23.14. That stacked order, with all three moving averages above spot price, is textbook bearish structure. Momentum backs this up. The daily RSI14 sits at 27.16, deep into oversold territory. Meanwhile, the MACD line at -0.29 remains below its signal line at -0.13. The histogram of -0.16 shows that downside momentum is still building rather than fading.
Volatility has also expanded meaningfully. The daily ATR14 stands at 0.61. Price has pushed through the lower Bollinger Band at 20.35, with the close at 19.06 well beneath it. A close outside the lower band after a debt-driven selloff typically reflects a stretched, emotional move rather than an orderly trend continuation.
Therefore, the daily regime reading of bearish is justified. However, the depth of the oversold condition also raises the odds of a mechanical bounce before any further decline. For GME, the daily pivot sits at 19.37, with support at 18.24 and resistance at 20.19. These levels will matter for near-term reaction.
1H Timeframe Reinforces the Downside
The hourly chart reinforces the bearish bias, with no sign of seller exhaustion across momentum or trend indicators. EMA20 at 20.32, EMA50 at 21.05, and EMA200 at 21.59 are all stacked above the current close of 19.06. This confirms the same bearish alignment seen on the daily. RSI14 on the 1H is even more stretched, at 21.81. The MACD shows a line of -0.79 against a signal of -0.51, with a histogram of -0.28 that continues to widen. In short, sellers have not yet lost control on any meaningful timeframe above intraday.
Notably, price on the 1H remains inside the Bollinger Bands — between a lower band of 18.02 and an upper band of 23.52. This contrasts with the daily close, which pierced its lower band. The difference is subtle but important. It suggests the selloff has been persistent rather than a single violent spike.
For now, the 1H pivot at 18.93 frames a tight battle zone. Resistance sits at 19.21 and support at 18.78, right around current price. These levels define the immediate tactical landscape for the stock.
15-Minute Chart Shows Short-Term Stabilization
The 15-minute chart tells a more nuanced story than the higher timeframes. Short-term stabilization is emerging, even as the broader trend remains bearish. RSI14 here has recovered to 41.97, a neutral reading rather than an oversold one. The MACD histogram has flipped positive at 0.12. However, the MACD line at -0.39 remains below the signal at -0.51, so the recovery is tentative at best.
Price is trading just above its EMA20 of 19.04, though still beneath the EMA50 at 19.9 and EMA200 at 21.09. Meanwhile, price is pressing against the upper Bollinger Band at 19.09, with the mid-band at 18.82. This is a classic short-term stabilization pattern. Intraday buyers are testing whether the bounce off the lows can extend.
Overall, the 15m regime is labeled neutral, and that description fits. This is a pause within a larger bearish structure, not a reversal signal. The broader trend on higher timeframes remains firmly negative.
Bullish Scenario for GameStop Corporation Stock
For a bullish reversal to gain credibility, the stock would need to clear several technical hurdles across multiple timeframes. Meanwhile, a constructive case would require the daily RSI to work off its oversold extreme without making fresh lows. Ideally, this would be accompanied by a reclaim of the 20.19 daily resistance level. If the 1H chart can flip its MACD histogram positive, that would be a first step. A push above the 19.21 hourly pivot resistance would then signal short-term buyers stepping in more decisively.
A sustained move back above the daily EMA20 near 21.56 would be needed to meaningfully challenge the bearish regime tag. For now, any bounce should be treated as relief within a downtrend rather than a trend change.
Bearish Scenario Remains the Path of Least Resistance
The bearish case remains the default outlook, with the debt-exchange overhang and widening momentum supporting further downside. On the other hand, a daily close below the 18.24 support level would confirm that the debt-exchange selloff has further room to run. This is especially true given that the daily MACD histogram remains negative and widening. Should the 1H chart lose the 18.78 pivot support, that would remove the last near-term technical cushion.
In turn, such a breakdown would likely accelerate selling pressure. Continued downside would invalidate any bullish attempt seen on the 15-minute chart. This becomes even more likely if the intraday RSI rolls back over from its current neutral 41.97 toward oversold levels again.
Closing Note
GameStop Corporation stock sits in a tension zone between bearish higher timeframes and tentative intraday stabilization. The $1.4 billion note-for-share exchange has introduced a dilution overhang that markets are still digesting. Elevated ATR readings across timeframes point to continued volatility rather than calm. In contrast to the deeply oversold daily and hourly momentum readings, the intraday tape shows tentative buying interest.
Ultimately, that divergence is worth watching closely. It will likely determine whether the current move is a pause within a downtrend or the early stage of a deeper repricing. The debt restructuring is set to close in September 2026, keeping the fundamental overhang in place for the foreseeable future.
FAQ
Why is GameStop Corporation stock falling?
The stock is under pressure after the company announced a plan to exchange approximately $1.4 billion of convertible notes for Class A shares, introducing a dilution overhang that markets are still pricing in.
What are the key support and resistance levels for GME?
On the daily timeframe, key support sits at 18.24 and resistance at 20.19. The daily pivot is at 19.37. On the 1H chart, pivot support rests at 18.78 with resistance at 19.21.
Is GameStop Corporation stock oversold?
Yes. The daily RSI14 sits at 27.16, deep in oversold territory. The 1H RSI14 is even more stretched at 21.81. However, oversold conditions can persist during strong downtrends and do not guarantee an immediate reversal.
When does the debt restructuring close?
The debt restructuring tied to the $1.4 billion note-for-share exchange is set to close in September 2026, leaving the dilution overhang in place for an extended period.
Disclaimer: This article is for informational purposes only and does not constitute financial advice, an investment recommendation, or a solicitation to buy or sell any financial instrument or cryptocurrency. The analysis provided is not indicative of future results. Investing in crypto assets and financial markets carries a high risk of capital loss. Always do your own research (DYOR) and consult a qualified financial advisor before making any decision.
Article produced with the assistance of artificial intelligence and reviewed by the editorial team.






 English (US) ·