
 3 hours ago
12
3 hours ago
12

GitLab Inc. stock nears a fresh 52-week high following a strong Q2 report that beat expectations. The daily chart shows sustained strength. The shorter-term picture, however, is starting to show fatigue. That divergence between timeframes demands a closer look before deciding if this rally has legs.
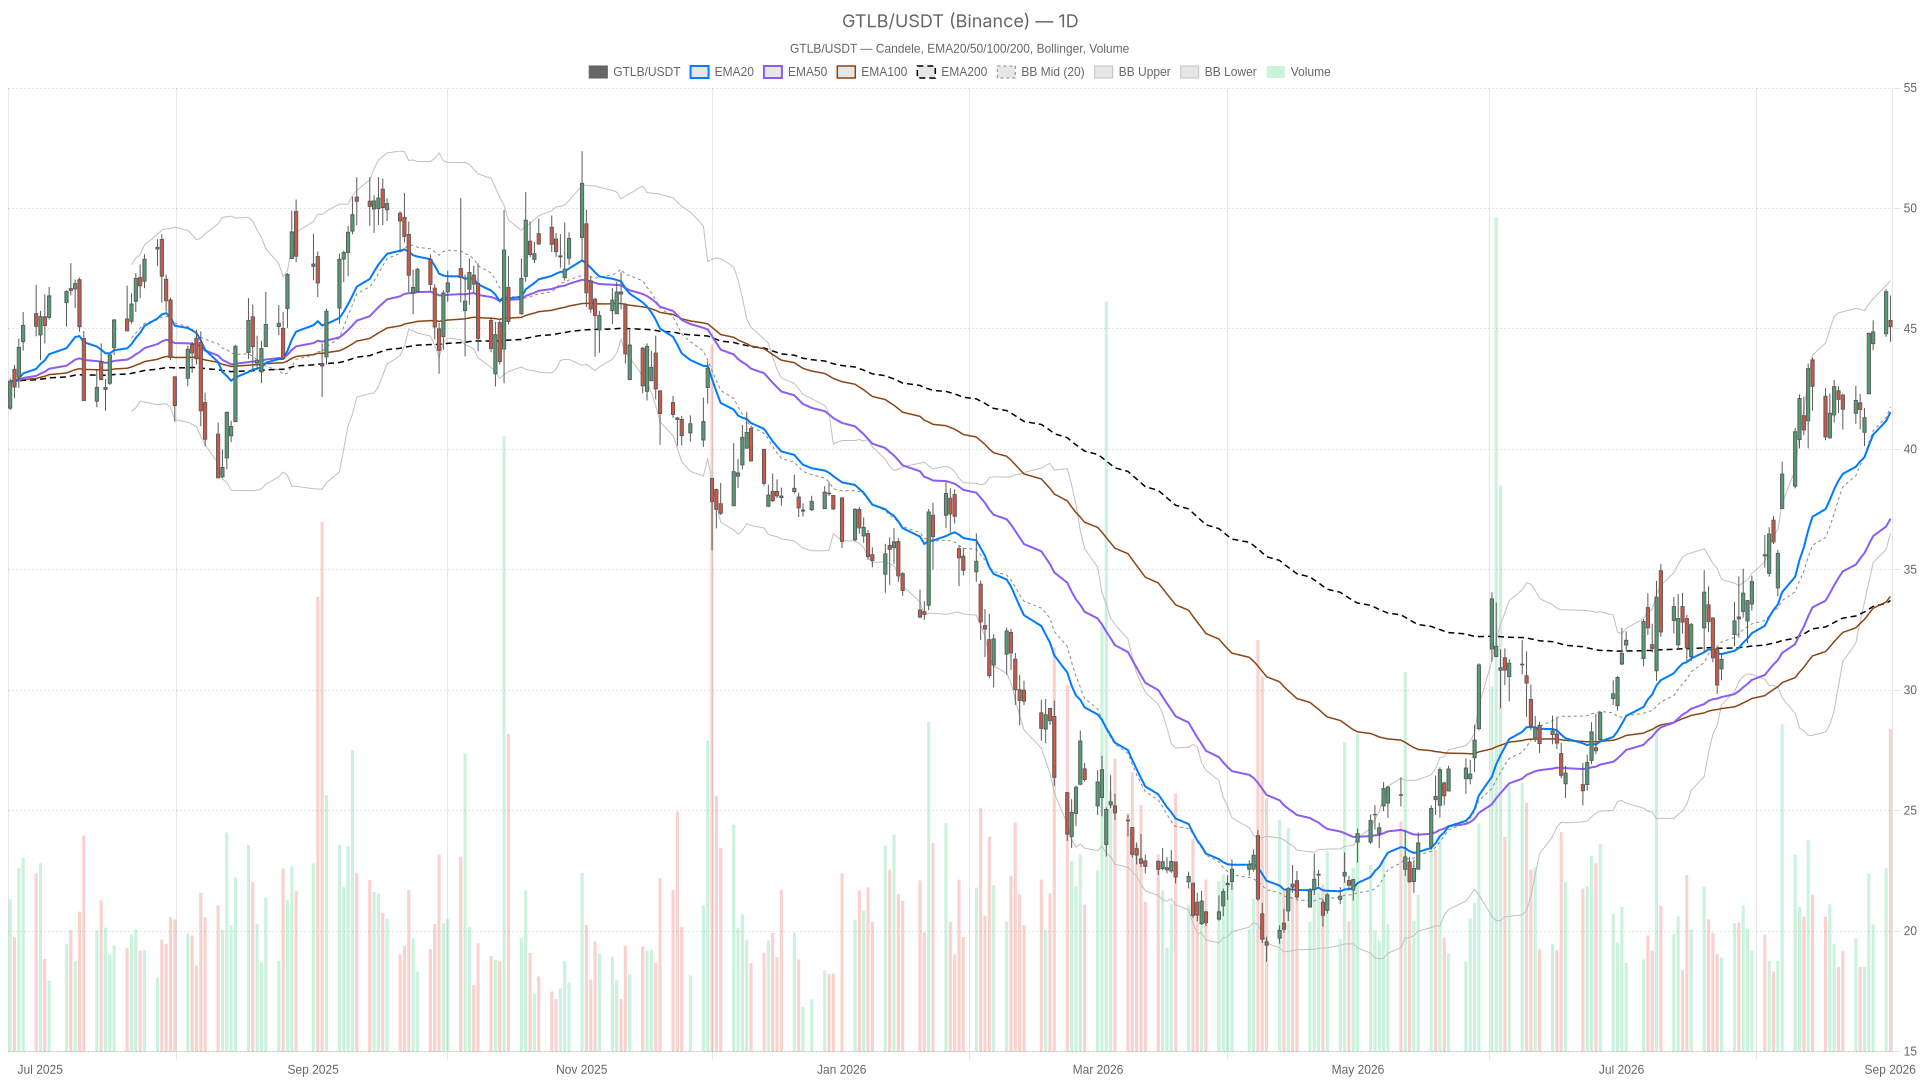 GTLB — daily chart with candlesticks, EMA20/EMA50 and volume.
Key takeaways
- GTLB’s daily trend remains bullish, with the 20, 50 and 200-period EMAs stacked in perfect alignment beneath price.
- The 1H MACD shows a bearish crossover with a negative histogram of -0.21, signaling cooling short-term momentum.
- GitLab reported Q2 FY2027 revenue of $286.3 million, up 21% year-over-year, and raised full-year guidance to between $1.129 billion and $1.133 billion.
- Key daily resistance sits at 46.16 (R1), while critical support rests at 44.24 (S1) and the daily EMA20 near 41.55.
- Short-term consolidation on the 15-minute chart suggests the stock is pausing rather than reversing after its post-earnings surge.
GitLab Inc. Stock: Daily Trend Still Points Higher
The daily trend in GitLab Inc. stock remains firmly bullish. EMA alignment confirms buyers have controlled price for weeks, and the structure shows broad support beneath current levels.
On the daily timeframe, GTLB closed at 45.09 after trading as high as 46.38. Price sits comfortably above its 20, 50 and 200-period EMAs at 41.55, 37.12 and 33.72 respectively. That stacked EMA alignment is textbook trend confirmation. It shows buyers have been in control for weeks, not days. The trend has broad support beneath current price.
Meanwhile, the daily RSI14 reads 66.2, firmly in bullish territory but not yet flashing an extreme overbought warning. Momentum is strong, yet it still has room before hitting exhaustion levels typically seen above 70. MACD on the daily is also constructive. The line at 2.66 sits above the signal at 2.54, with a positive histogram of 0.12. However, the thin histogram hints that the pace of upside acceleration may be slowing even as the broader trend remains up.
Bollinger Bands on the daily chart place price near the upper boundary at 46.99, with the midline at 41.76 and the lower band at 36.52. Trading close to the upper band during a strong trend often signals persistent buying pressure rather than an automatic reversal. Daily ATR14 stands at 1.98, confirming volatility has expanded alongside the move—a normal feature of a stock breaking toward new highs.
Pivot levels show resistance at 46.16 (R1) and support at 44.24 (S1). The pivot point itself sits at 45.31, essentially where price trades now. Overall, the system labels the daily regime as bullish, and the structure supports that read.
1H Timeframe: Confirmation With a Momentum Caveat
The 1-hour chart confirms the bullish daily bias but reveals cooling momentum that deserves attention. Price at 45.10 sits above the 1H EMA20 (45.01), EMA50 (43.93) and EMA200 (40.08), preserving the same bullish EMA stack seen on the daily. That alignment reinforces the broader uptrend and suggests dips are still being bought on an intraday basis.
However, momentum on this shorter timeframe is clearly cooling. The 1H RSI14 has dropped to 54.07, a meaningful pullback from the daily’s 66.2 reading. This indicates buyers have eased off after the initial post-earnings push. More notably, the 1H MACD shows the line at 0.43 below the signal at 0.64, producing a negative histogram of -0.21. That is a short-term bearish crossover inside a longer-term bullish trend. It is worth flagging clearly rather than glossing over.
Bollinger Bands on the 1H chart show price at 45.10, just under the midline of 45.33, with the upper band at 46.34 and the lower band at 44.32. In other words, price has slipped from the upper half of the range toward the middle, consistent with the momentum cooling seen in MACD and RSI. The 1H ATR14 of 0.59 confirms volatility has contracted from the prior expansion, typical of a market pausing after a sharp move. Pivot points place resistance at 45.28 (R1) and support at 44.80 (S1), a tight band mirroring the current consolidation. The system still tags the 1H regime as bullish, though underlying momentum signals suggest this label is being tested.
15-Minute Chart: Execution Context Points to Consolidation
The 15-minute chart provides the clearest evidence of near-term hesitation. Price at 45.10 is wedged between the EMA20 at 45.11 and the EMA50 at 45.18. It is essentially flat, offering no directional edge on this timeframe. The EMA200 at 43.82 remains well below price, so the broader short-term trend is not broken—it is simply pausing.
RSI14 on the 15-minute chart sits at 48.16, right around the neutral midpoint. MACD is essentially flat, with the line and signal both at -0.15 and a histogram of zero. That is about as clear a “no momentum” reading as this system produces. Bollinger Bands are tight here too. The midline sits at 45.06, with the upper band at 45.53 and the lower band at 44.59, reflecting the same low-volatility compression. The 15-minute ATR14 of 0.37 is the lowest reading across all three timeframes. This confirms intraday volatility has genuinely dried up. Pivot support and resistance sit at 44.82 and 45.27 respectively, a narrow range traders watching entries should keep in view. The regime here is labeled neutral, which fits a market catching its breath after a strong earnings-driven move.
The Fundamental Backdrop
GitLab’s strong technical picture is backed by a Q2 report that beat expectations and prompted raised full-year guidance. The technical picture did not emerge in a vacuum. GitLab reported second-quarter fiscal 2027 revenue of $286.3 million, up 21% from a year earlier, citing record gross bookings and accelerating net annual recurring revenue growth. The company also raised its full-year outlook. It now projects FY2027 revenue between $1.129 billion and $1.133 billion, while targeting over $100M paid CRR. That combination of a beat and a raise explains why GTLB eyed a new 52-week high in premarket trading. It prompts the obvious question among holders: take profits, or stay the course.
Bullish Scenario
The bullish case for GitLab Inc. stock depends on holding above the daily EMA20 near 41.55 and breaking through daily resistance at 46.16. As long as price holds above that EMA and ideally above the pivot point at 45.31, the broader uptrend remains intact. A push through 46.16 would confirm continuation and likely draw in fresh momentum buyers reacting to the improved guidance. For this scenario to gain traction, the 1H MACD would need to curl back above its signal line. RSI on both the 1H and 15-minute charts would also need to reassert upward momentum rather than stall near the midpoint.
Bearish Scenario
The bearish case centers on the momentum divergence already visible on the 1H chart. A negative MACD histogram alongside cooling RSI readings can precede a pullback even within an intact uptrend. If price breaks below the 1H support at 44.80 and then the daily pivot support at 44.24, the immediate bullish continuation thesis would be invalidated. That would open the door to a deeper retest of the daily EMA20 near 41.55. Such a move would not necessarily break the longer-term trend. However, it would signal that short-term buyers have stepped back meaningfully after the earnings pop.
Closing Take
GitLab Inc. stock’s daily trend remains constructive, but short-term momentum is fading, creating a mixed picture that demands patience near current levels. Overall, the daily trend is supported by strong earnings, raised guidance, and a bullish EMA structure that has held for weeks. At the same time, the 1H and 15-minute timeframes show clear signs of consolidation and fading short-term momentum. This is a natural pause after a sharp post-earnings advance rather than a trend reversal on its own.
Volatility has compressed sharply on the shorter timeframes, and that compression often precedes a decisive move in either direction. Positioning around current levels therefore requires patience. The daily pivot and support zones near 45.31 and 44.24 serve as the key lines separating continuation from a deeper pullback. Given the mixed signals across timeframes, uncertainty in the near term should not be underestimated.
FAQ
What is the outlook for GitLab Inc. stock after Q2 earnings?
The daily trend remains bullish, supported by strong Q2 results and raised guidance. However, short-term momentum is cooling, with the 1H MACD showing a bearish crossover. The stock appears to be consolidating after its post-earnings surge rather than reversing. Key support at 44.24 and resistance at 46.16 will likely determine the next directional move.
Is GTLB stock overbought right now?
Not exactly. The daily RSI14 reads 66.2, which is firmly in bullish territory but still below the typical overbought threshold of 70. On the 1H chart, RSI has cooled to 54.07, suggesting buying pressure has already eased. The stock is not flashing extreme overbought warnings on any timeframe.
What are the key support and resistance levels for GTLB?
Key resistance sits at 46.16 (daily R1), with the daily Bollinger upper band at 46.99. Support levels to watch include 44.80 (1H S1), 44.24 (daily S1), and the daily EMA20 at 41.55. The daily pivot point at 45.31 serves as a near-term inflection level.
What did GitLab report for Q2 fiscal 2027?
GitLab reported Q2 FY2027 revenue of $286.3 million, up 21% year-over-year, citing record gross bookings and accelerating net annual recurring revenue growth. The company raised its full-year revenue guidance to between $1.129 billion and $1.133 billion.
Disclaimer: This article is for informational purposes only and does not constitute financial advice, an investment recommendation, or a solicitation to buy or sell any financial instrument or cryptocurrency. The analysis provided is not indicative of future results. Investing in crypto assets and financial markets carries a high risk of capital loss. Always do your own research (DYOR) and consult a qualified financial advisor before making any decision.
Article produced with the assistance of artificial intelligence and reviewed by the editorial team.







 English (US) ·