
 2 hours ago
15
2 hours ago
15

The post Has Bitcoin Started Its Next Major Rally? Is BTC Price Preparing for a Rally Back to $100K? appeared first on Coinpedia Fintech News
Ever since rebounding from lows below $60,000, the Bitcoin price has continued to display strong resilience despite repeated selling pressure. BTC recently reclaimed the crucial $80,000 level ahead of the weekly close, helping maintain bullish momentum across the broader crypto market. While the short-term price action hints at a possible interim pullback, the long-term market structure continues to support the possibility of a larger bullish expansion in the coming weeks.
Bitcoin Price Analysis in the Short Term
The Bitcoin price in the short term continues to trade within a rising wedge pattern after rebounding strongly from the February lows. BTC recently reclaimed the $80,000 range and is now testing a major resistance zone near the 200-day SMA around $82,600. This level has acted as a key barrier over the past few months, making the current price action extremely important for the next directional move.
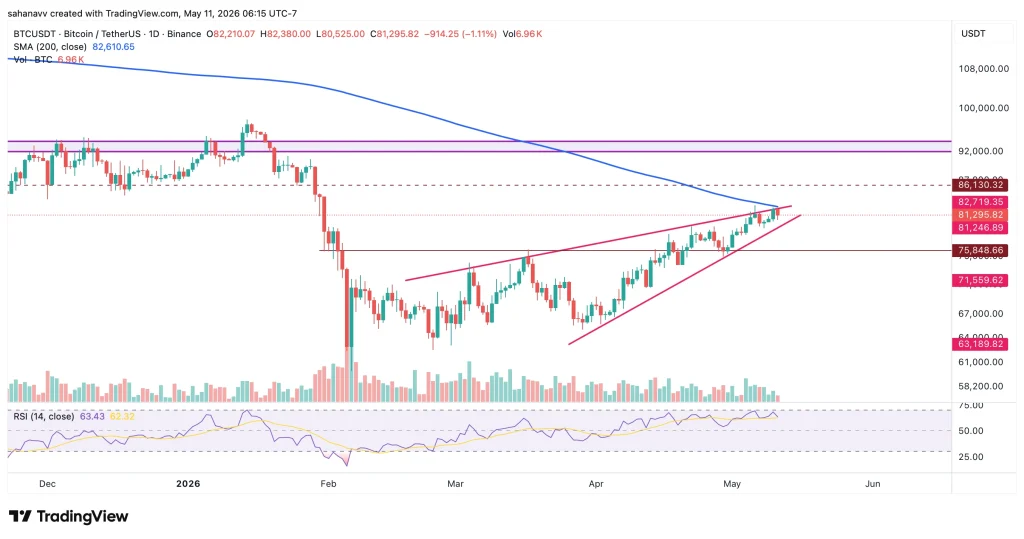
At the same time, the RSI remains elevated above the average range, suggesting growing bullish momentum without entering extreme overbought conditions yet. However, the rising wedge pattern also hints at the possibility of a short-term pullback if Bitcoin fails to break above the immediate resistance zone. In such a case, BTC could revisit the support range near $75,800 before attempting another breakout.
On the bullish side, a decisive breakout above the 200-day SMA and the $82,700 resistance zone could strengthen the ongoing recovery rally and open the doors for a move toward $86,000 and eventually the psychological $90,000 milestone.
Long-Term Bitcoin Structure Continues to Support a Bullish Outlook
As seen in the monthly chart above, Bitcoin continues to trade within a long-term ascending parallel channel that has historically guided the broader market cycle. Despite the sharp correction earlier this year, BTC successfully defended the lower trendline support near the $56,000–$65,000 region and has now rebounded strongly back above $80,000. The chart suggests that the recent pullback may have been part of a broader bullish continuation structure rather than the beginning of a long-term reversal.
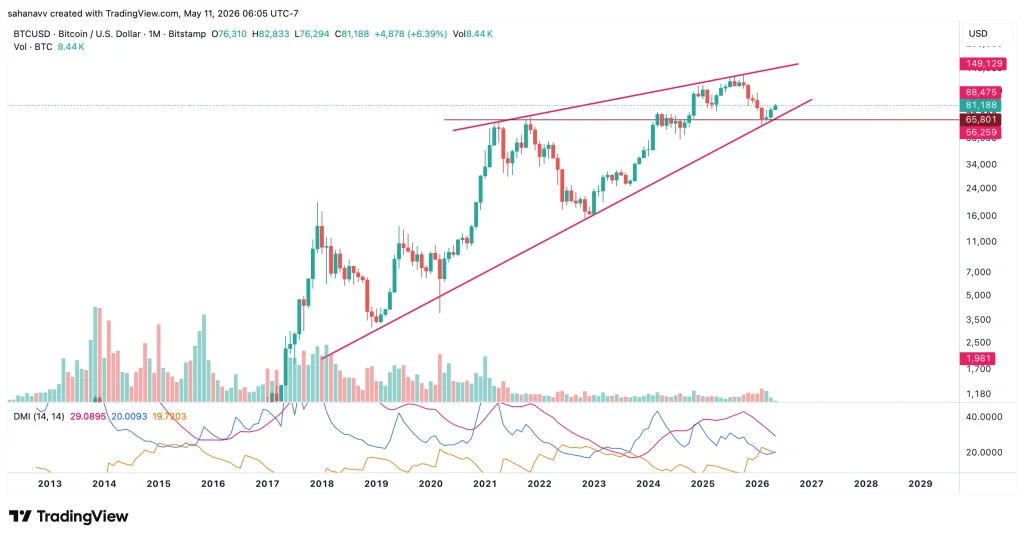
Bitcoin is currently attempting to reclaim the mid-range resistance within the channel, while the upper trendline continues to project potential upside targets toward the $100,000 and $149,000 zones over the longer term. The DMI indicator also hints at improving bullish momentum, as the buying pressure gradually strengthens after a prolonged cooling phase.
However, BTC still needs to maintain support above the $75,000–$76,000 range to preserve the current bullish structure. A sustained breakout above the $88,000 resistance zone could strengthen the long-term rally and potentially revive the path toward six-figure price targets in the coming months.
Is Bitcoin Preparing for Its Next Major Rally?
Bitcoin continues to display a strong long-term bullish structure despite short-term consolidation below key resistance levels. While an interim pullback toward the $75,000 range remains possible, the broader market setup suggests BTC may be preparing for a larger breakout phase. If BTC price successfully reclaims the $82,000–$88,000 resistance zone, bullish momentum could accelerate further, potentially reviving the path toward the psychological $100,000 milestone in the coming months.


 English (US) ·