
 2 hours ago
12
2 hours ago
12

Johnson & Johnson stock enters this session at 259.24, above every major daily moving average. The daily trend holds firm. Yet momentum is quietly fading beneath price, and that divergence is the real story for traders right now.
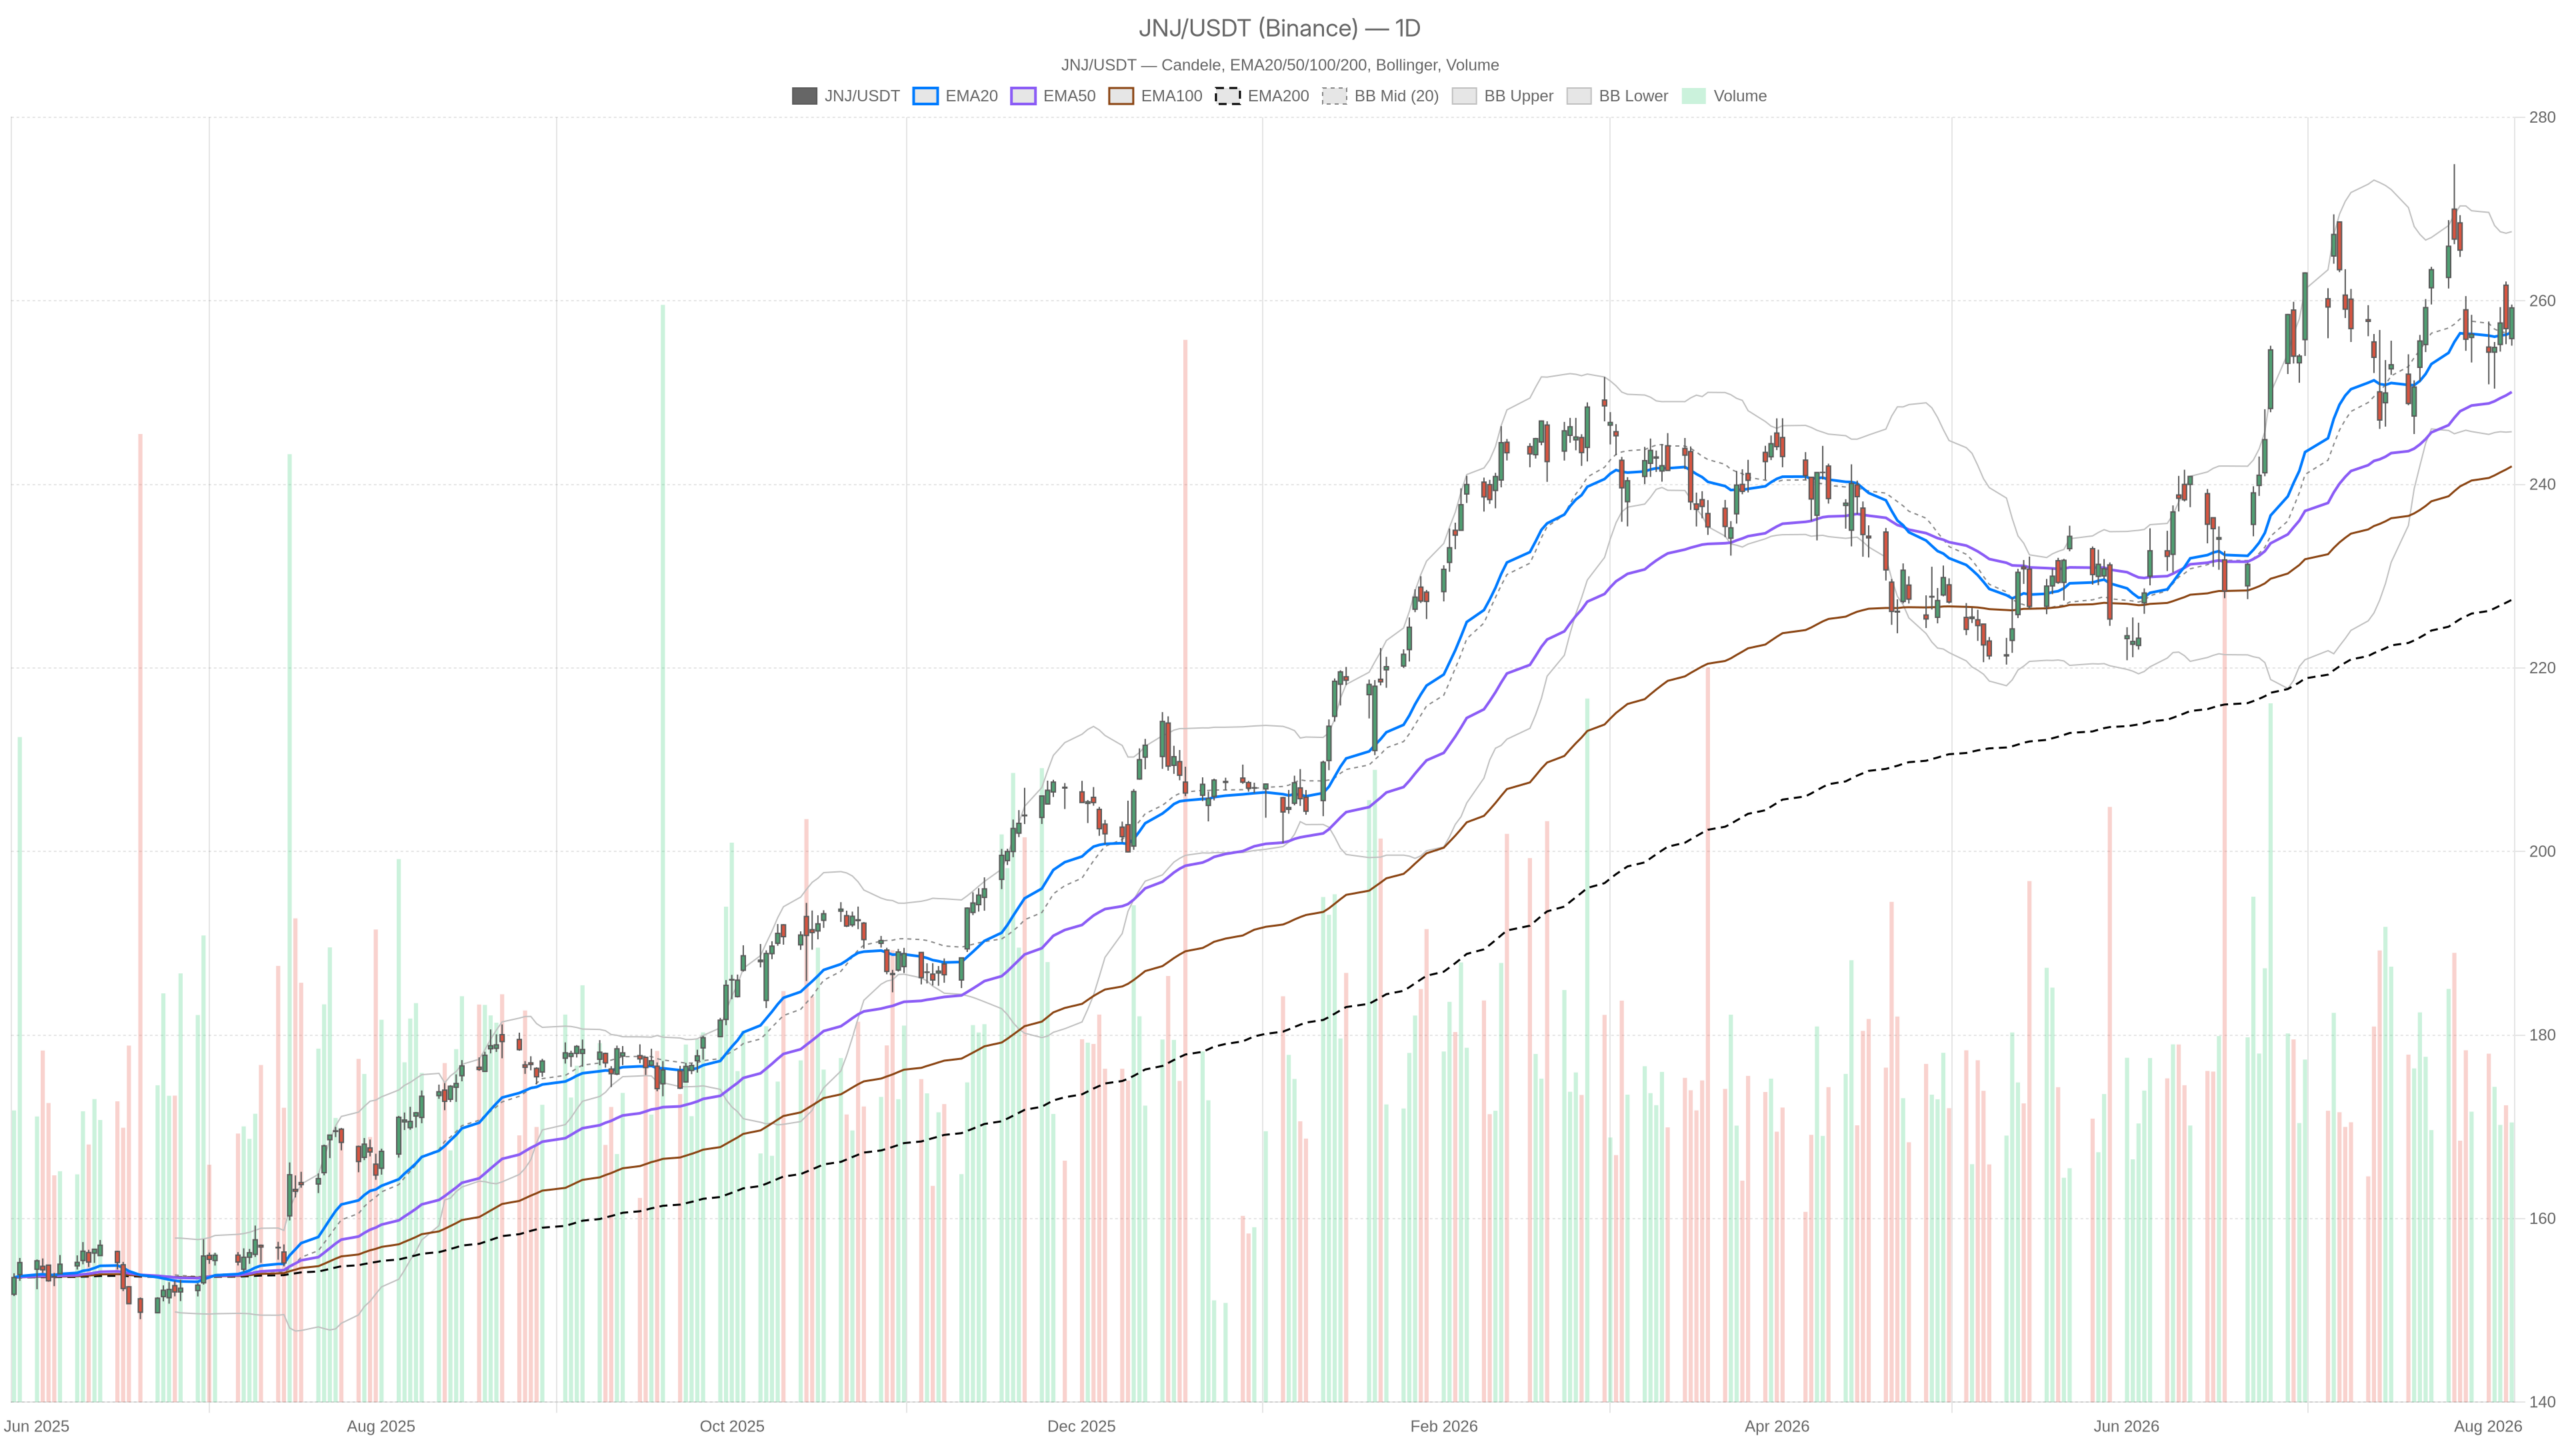 JNJ — daily chart with candlesticks, EMA20/EMA50 and volume.
Key takeaways
- Johnson & Johnson stock closed at 259.24 on 7 August, above EMA20, EMA50, and EMA200—confirming a textbook daily bullish structure.
- The daily MACD shows a negative histogram of -0.86, signalling momentum has rolled over while price continued drifting higher.
- The immediate decision zone sits between 256.37 support and 260.85 resistance on the daily timeframe.
- The hourly regime reads neutral despite improving intraday momentum, with RSI14 at 63.03 and MACD turning positive.
- A daily close above 260.85 would confirm bullish intent toward the daily upper Bollinger Band at 267.55.
The main scenario remains constructive but late-stage. This is a trend that deserves respect, not chase. Buyers are still in control of the higher timeframe, while short-term indicators are stretched into resistance. That combination usually resolves through consolidation rather than an immediate vertical extension.
Daily structure sets a bullish bias for Johnson & Johnson stock
The daily moving average configuration leaves no room for doubt: the trend is bullish. EMA20 at 256.59, EMA50 at 250.07, and EMA200 at 227.43 form a textbook alignment with price above all three. This distance from the 200-day line also signals how mature the advance already is.
Notably, the daily candle itself was solid. The session opened at 255.89, held a 255.12 low, and closed at 259.24, near the 259.60 high. Buyers absorbed the early dip and finished in control. Volume of roughly 6.53 million shares supported the move without signalling anything extreme.
However, RSI14 on the daily sits at 55.45. That is mildly positive, not powerful. A trend this well-aligned would normally carry a higher reading. The message is a market grinding higher rather than accelerating.
MACD complicates the picture further. The line is at 2.39 against a 3.25 signal, leaving a negative histogram of -0.86. Momentum peaked earlier and has been rolling over while price kept drifting up. That is classic loss of thrust inside an ongoing uptrend. It is the main argument against aggressive continuation trades.
Volatility and levels: where the daily battle sits
The daily Bollinger Bands frame the active range clearly. The midline sits at 256.65, the upper band at 267.55, and the lower band at 245.74. Price sits above the midline but well short of the upper band. There is still headroom before the move looks statistically overextended.
Meanwhile, ATR14 of 6.21 is the number to internalise for risk sizing. That is the daily breathing room for Johnson & Johnson stock. A two-point pullback means nothing in that context. Traders working with tight stops on this name will be stopped out by noise.
In parallel, daily pivots keep the immediate map simple. The pivot point is 257.99, resistance sits at 260.85, and support at 256.37. Price closed between the pivot and R1. Therefore, 260.85 becomes the first genuine test of intent. A loss of 256.37 would shift the short-term balance back toward sellers.
The 1H chart confirms strength but labels the regime neutral
Hourly data supports the daily bias with an important nuance: the 1H regime reads neutral, not bullish. Price at 259.23 sits above EMA20 at 256.85, EMA50 at 257.16, and EMA200 at 254.80. The short-term averages are tightly clustered, which is typical of range behaviour rather than trend expansion.
At the same time, hourly momentum is clearly improving. RSI14 stands at 63.03, and MACD has turned positive with the line at 0.29 above the 0.08 signal. The histogram reads +0.21. That is a fresh intraday impulse working against the fading daily momentum.
Here is the conflict, stated plainly. The daily MACD is deteriorating while the hourly MACD is improving. One reflects a tiring multi-week advance, the other a short-term breakout attempt. Until the daily histogram turns back up, the hourly strength should be treated as a bounce inside a maturing trend.
Meanwhile, the hourly Bollinger structure flags immediate stretch. The upper band sits at 258.94 and price closed above it. Hourly ATR of 1.76 confirms modest volatility, so this is not a violent expansion. Hourly pivots place resistance at 260.06 and support at 257.96, which brackets a narrow decision zone.
15m execution context: strong, but extended
The 15-minute chart closed at 259.23 after printing a 259.63 high, right at the session extreme. RSI14 at 72.43 is firmly overbought, and price trades above the upper Bollinger Band at 258.21. MACD remains positive with a 0.25 histogram, so the push is real. Still, this is not an attractive entry area for late buyers.
One detail deserves attention. EMA200 on the 15-minute sits at 257.41, above both EMA20 at 257.08 and EMA50 at 256.84. That reflects a market that spent recent hours chopping sideways before breaking higher. With ATR at just 0.60, any retest toward 258.14 support or the 256.80 midline would be routine rather than damaging.
Bullish scenario
The bullish path requires acceptance above 260.06 on the hourly chart and a daily close through 260.85. That would confirm the intraday impulse carries real weight and open the path toward the daily upper band at 267.55.
Fundamentally, the news flow leans in that direction. Price targets have been moving higher, with bullish analysts citing a range from roughly US$260 to US$305. Street commentary has pointed to solid execution in new medicines and MedTech, alongside reduced legal uncertainty. In other words, the technical breakout attempt is not happening in a vacuum.
For this scenario to hold, dips must be shallow. Defending 257.96 and, more importantly, 256.37 would keep the structure clean. A rising daily MACD histogram would be the missing confirmation.
Bearish scenario
The bearish case begins with the daily MACD divergence. If price fails at 260.85 and slips back below the 257.99 pivot, the current push looks like a false break. A break of 256.37 would then invalidate the near-term bullish setup. It would expose the daily midline at 256.65 from below.
Below that, the reference zone shifts toward EMA50 at 250.07. Given a daily ATR of 6.21, that distance can be covered quickly once the trend loses its footing. The lower daily band at 245.74 marks the deeper extension of that scenario.
On the other hand, sellers also have a narrative hook. One commentary flagged Johnson & Johnson as potentially 10% overvalued following the leadership change. Jennifer Taubert retired as Executive Vice President, Worldwide Chairman, Innovative Medicine, with Tom Cavanaugh set to succeed her. Valuation debates rarely move price alone, but they can amplify a technical failure.
Positioning takeaway
Johnson & Johnson stock presents a bullish daily chart, a neutral hourly regime, and an overbought 15-minute reading. That is a configuration rewarding patience over urgency. The trend favours buyers, but the entry location currently favours nobody.
The decision zone is tight: 256.37 to 260.85 on the daily. Volatility is contained across all three timeframes, which keeps risk manageable but also limits immediate follow-through. Until the daily momentum picture repairs itself, the honest read is a strong trend running on reduced fuel. The next daily close will do most of the talking.
FAQ
Is Johnson & Johnson stock still in a bullish trend?
Yes. The daily chart maintains a bullish structure with price at 259.24 above EMA20 (256.59), EMA50 (250.07), and EMA200 (227.43). This textbook alignment confirms buyers remain in control of the higher timeframe.
What is the key resistance level for Johnson & Johnson stock?
Immediate resistance sits at 260.85, the daily R1 pivot. A confirmed close above this level would open the path toward the daily upper Bollinger Band at 267.55.
Is the daily MACD divergence a concern for Johnson & Johnson stock?
Yes, it warrants attention. The daily MACD shows a negative histogram of -0.86, with the line at 2.39 below the 3.25 signal. This indicates momentum peaked earlier and has been rolling over while price continued drifting higher—a classic loss of thrust inside an ongoing uptrend.
What support levels should traders watch on Johnson & Johnson stock?
Key support sits at 256.37 (daily S1). Below that, EMA50 near 250.07 becomes the reference, with the daily lower Bollinger Band at 245.74 marking the deeper extension.
Disclaimer: This article is for informational purposes only and does not constitute financial advice, an investment recommendation, or a solicitation to buy or sell any financial instrument or cryptocurrency. The analysis provided is not indicative of future results. Investing in crypto assets and financial markets carries a high risk of capital loss. Always do your own research (DYOR) and consult a qualified financial advisor before making any decision.
Article produced with the assistance of artificial intelligence and reviewed by the editorial team.









 English (US) ·