
 5 hours ago
21
5 hours ago
21

Lumentum Holdings Inc. stock closed the 12 August session at 947.88, finishing above the upper Bollinger Band at 944.54 after opening at 899.76. This is trend expansion driven by fresh information, not a routine drift higher. Volume of 302,786 shares confirms real participation.
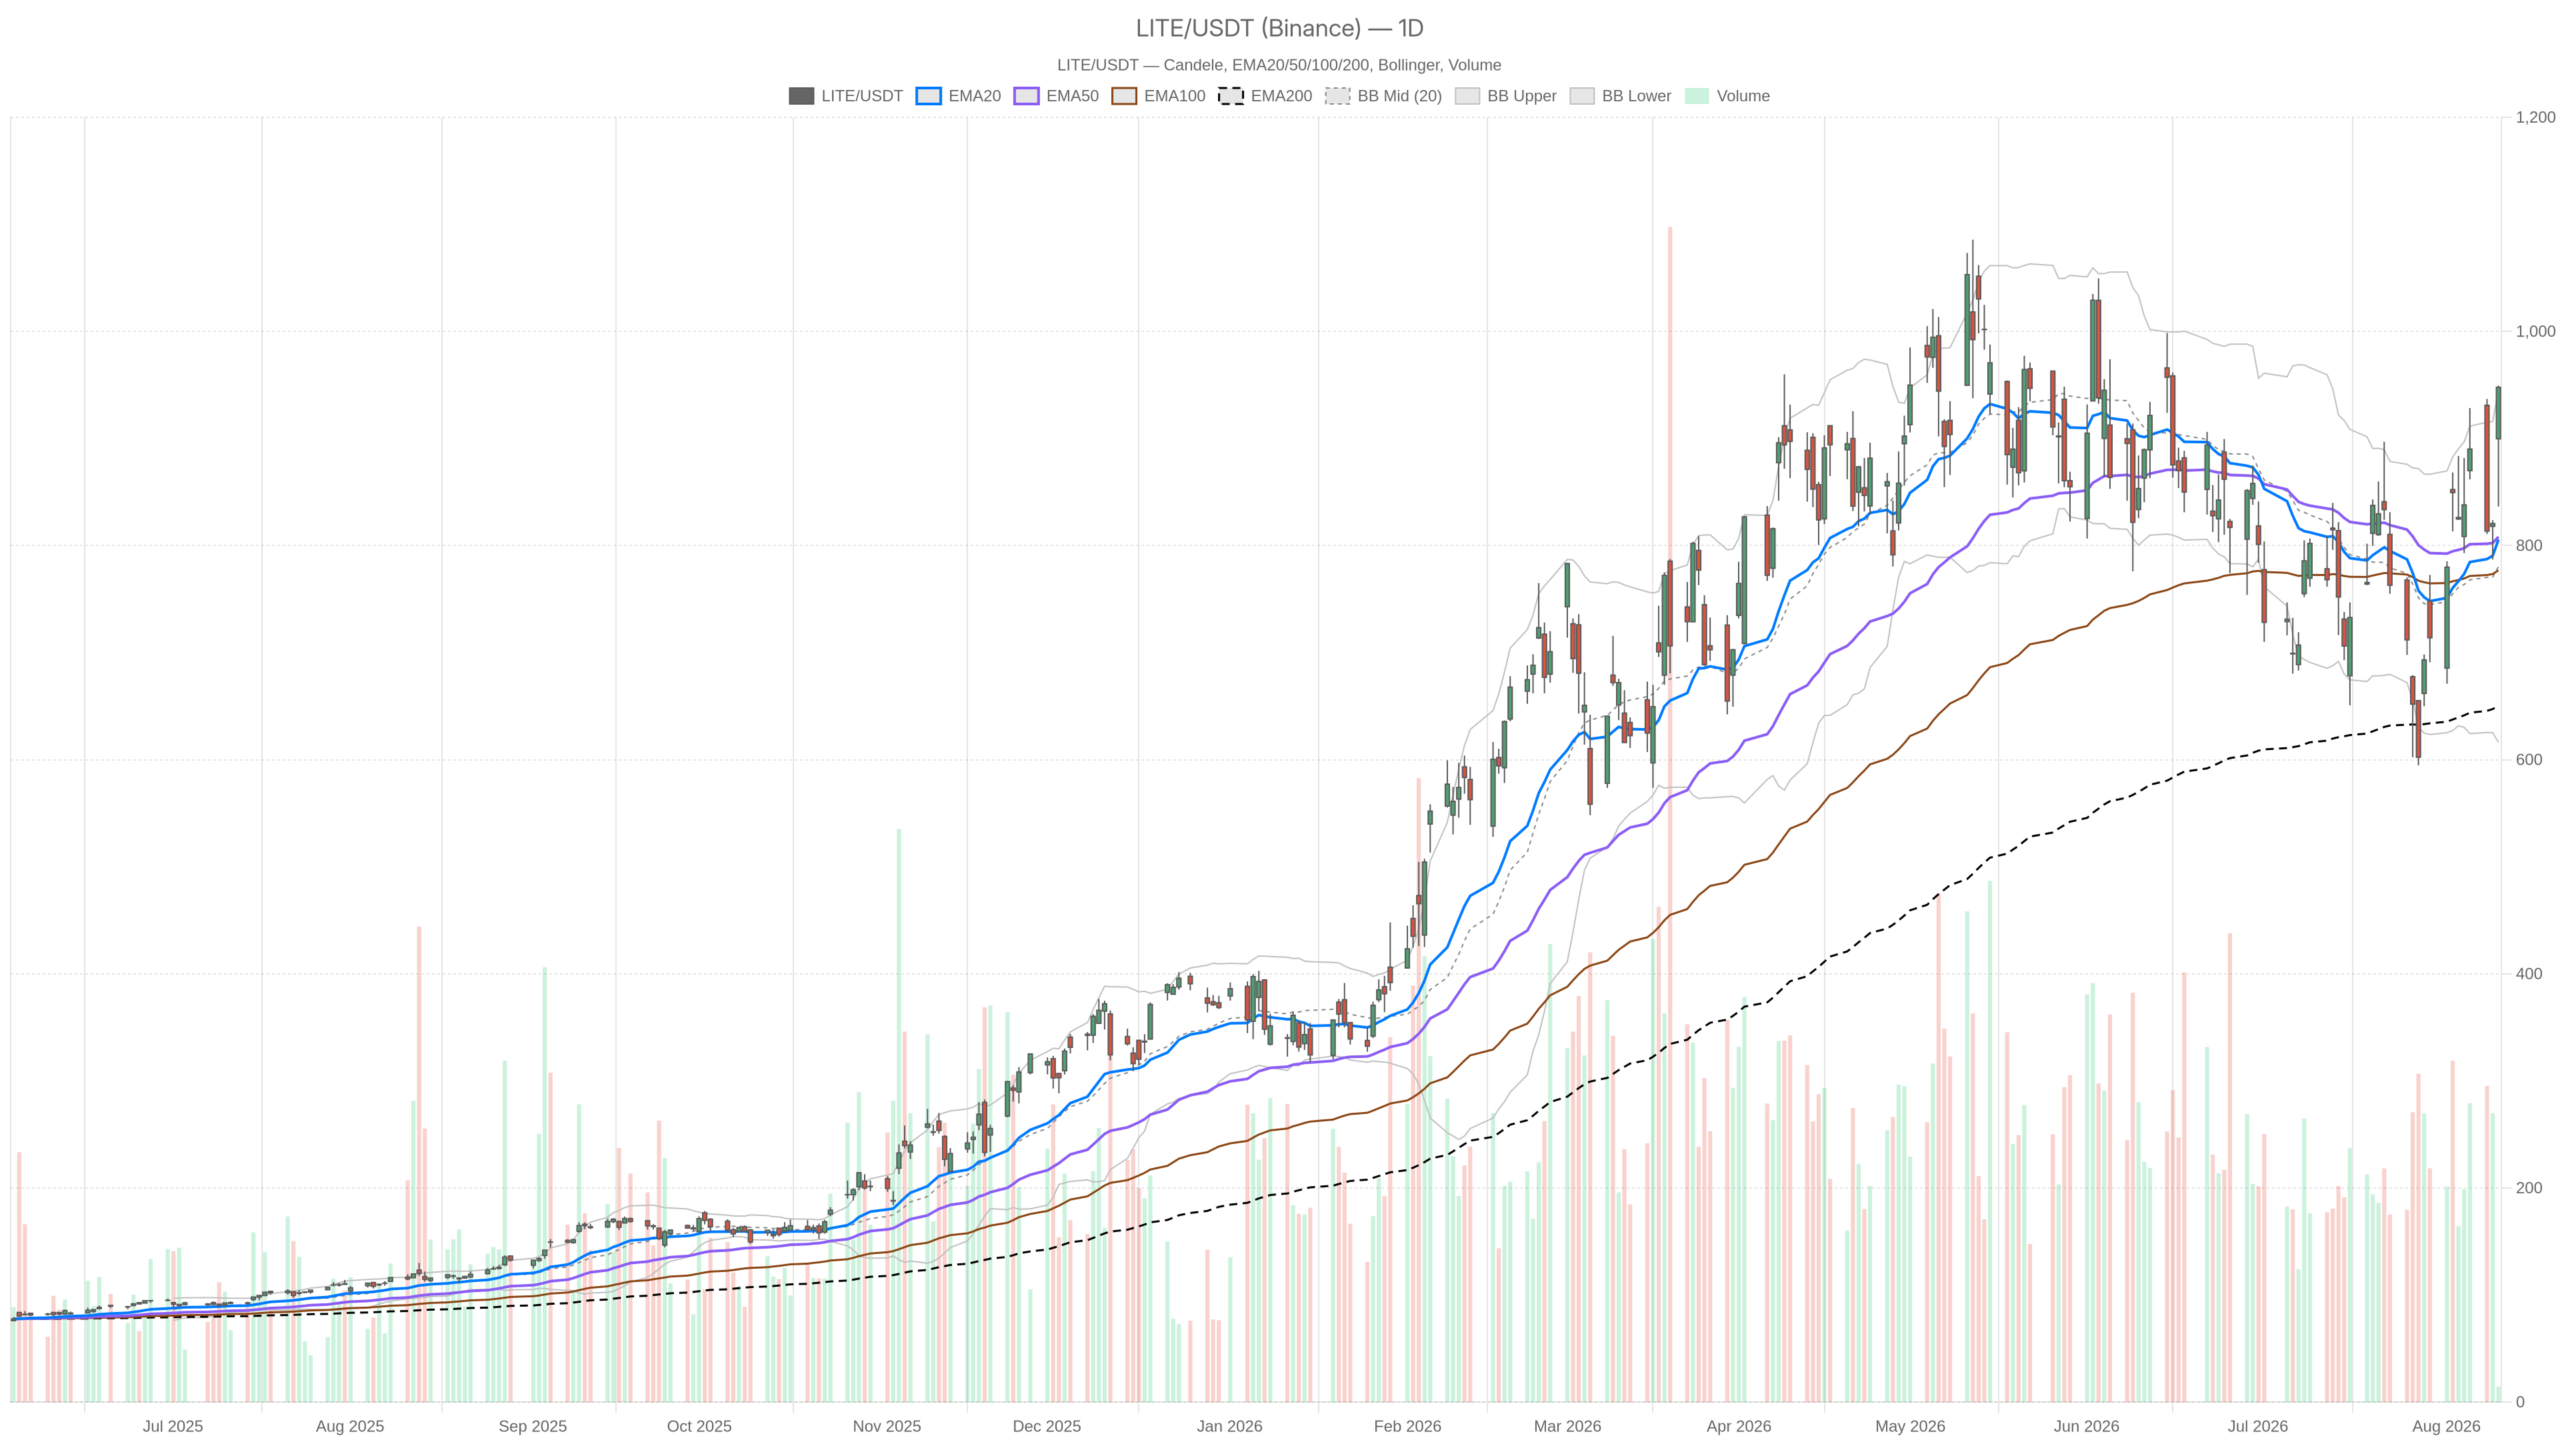 LITE — daily chart with candlesticks, EMA20/EMA50 and volume.
Key takeaways
- Lumentum Holdings Inc. stock closed at 947.88, above the daily upper Bollinger Band at 944.54, on volume of 302,786 shares.
- Daily RSI sits at only 61.35, well below overbought, leaving room for further upside if the breakout holds.
- Hourly RSI at 76.09 and 15m RSI at 84.27 flag extreme short-term stretch, warning the easiest part of the move may be behind.
- A $7.2 billion unadjusted net loss — driven by a one-time, non-cash $7.8 billion charge — triggered an after-hours fade.
- Daily ATR near 88 points demands wide tolerances for any level-based framework; a single average-range day can span support to resistance.
The catalyst is documented. Lumentum guided Q1 FY2027 revenue to $1.225B–$1.275B with an operating margin of 39.5%–40.5%. The earnings call emphasised AI-driven revenue growth, margin expansion, 1.6T transceivers, OCS and NPO/CPO. Analysts had already framed the quarter around AI optical networking demand. Therefore the breakout has a fundamental anchor, which matters when price sits this far above its own moving averages.
Why the daily chart still frames Lumentum Holdings Inc. stock as constructive
The daily chart remains constructive because price trades far above all major moving averages while MACD momentum has only just begun to turn positive. RSI at 61.35 still has ample room before registering overbought.
Price at 947.88 trades far above the EMA20 at 805.56, the EMA50 at 808.18 and the EMA200 at 650.36. The EMA20 and EMA50 are effectively flat against each other, which tells you the market spent time consolidating before this expansion. That gap between price and those averages is the tension in the chart.
Momentum shift and volatility context
Daily MACD supports the shift. The line has turned up to 19.21 against a signal still negative at -2.10, leaving a histogram of 21.31. That is a momentum regime change rather than a mature trend. Notably, daily RSI sits at only 61.35, well below overbought territory. Momentum has room before the daily chart looks exhausted.
Volatility, however, is the complicating variable. Daily ATR at 87.98 is enormous relative to the pivot structure. The daily pivot sits at 911.25, with R1 at 986.00 and S1 at 873.12. A single average-range day can travel from resistance to support and back. Consequently, any level-based framework here needs wide tolerances.
Meanwhile, the automated daily regime read is still classified as neutral. That is consistent with the flat EMA20/EMA50 pairing. Price has broken out, but the daily trend architecture has not yet caught up with price.
The 1H chart confirms trend but flags stretch
The 1H chart confirms a textbook bullish trend alignment with EMA20 above EMA50 above EMA200, but flags overbought momentum. RSI at 76.09 sits deep in overbought territory, requiring caution despite the clean bullish structure.
On the hourly timeframe the picture is cleanly bullish. EMA20 at 862.52 sits above EMA50 at 835.32, which sits above EMA200 at 797.62. That is textbook trend alignment, and price is decisively above all three. The hourly regime is bullish and there is no structural contradiction with the daily bias.
Momentum, on the other hand, is running hot. Hourly RSI at 76.09 sits deep in overbought territory. MACD at 18.87 against a 5.15 signal gives a histogram of 13.72, so acceleration is still positive. Price at 947.88 has also closed above the hourly upper band at 940.83. The hourly mid band sits far below at 849.88. Bands are being ridden, not merely tagged.
Hourly ATR of 23.36 sets a more realistic intraday expectation than the daily figure. Meanwhile the hourly pivot cluster is extremely tight, with PP at 947.02, R1 at 949.38 and S1 at 945.51. That compression reflects a market pressed against the session high with almost no recent two-way trade. In practice, tight pivots plus overbought momentum often precede a sharp resolution in either direction.
15m execution context: momentum at an extreme
The 15-minute chart shows momentum at an extreme, with RSI at 84.27 and fading MACD acceleration. This signals that the easiest part of the move is already behind, even as price continues to hold its gains.
The MACD line at 33.19 remains above its 26.25 signal, but the histogram has narrowed to 6.94. Acceleration is fading even as price holds up.
Structurally, price remains above the 15m EMA20 at 894.54, EMA50 at 862.68 and EMA200 at 825.86. Yet the 15m upper band sits at 984.50 with the mid at 879.78. That is a very wide envelope for a short timeframe. The last 15m candle was narrow, spanning 944.65 to 948.52 on 1,089 shares. Buyers are holding the gains, but they are no longer pressing aggressively.
Bullish scenario
The bullish continuation case requires acceptance above the session high at 949.38. From there, daily R1 at 986.00 becomes the logical objective, with the psychological 1,000 area just beyond.
What would support it: hourly closes staying above the 940.83 band and above the 947.02 pivot. The daily MACD histogram would also need to continue expanding. Fundamentally, the AI optics narrative, the 39.5%–40.5% margin guide and the 1.6T ramp all give buyers a reason to defend dips. Daily RSI at 61.35 leaves headroom for that scenario to develop.
Bearish scenario
The bearish case centres on a failed breakout, with a one-time $7.8 billion non-cash charge and post-earnings fade providing both fundamental and technical reasons for rejection. Headline risk of that magnitude can trigger reflexive selling regardless of the operating story.
LITE gained then faded after hours as a $7.2 billion unadjusted net loss overshadowed the beat. That loss stems from a one-time, non-cash $7.8 billion charge. It is tied to converting certain 2026, 2028 and 2029 convertible notes into common shares. Management commentary also flagged supply constraints as a potential cap on upside.
Technically, a rejection back below the daily pivot at 911.25 would weaken the immediate breakout claim. A slide through daily S1 at 873.12 would put the 836.50 low back in play. Loss of the hourly EMA20 at 862.52 would invalidate the short-term bullish alignment outright. Given a daily ATR near 88 points, such a retracement would not require unusual selling pressure.
Positioning, volatility and the honest read on Lumentum Holdings Inc. stock
The signals align on direction but conflict on timing. The daily bias is constructive, and the hourly trend confirms it. However, the 15-minute and hourly RSI readings at 84.27 and 76.09 warn that the easy part of the move is behind. The daily regime remains neutral by classification, a reminder that one expansion candle does not rebuild a trend.
Volatility is the dominant risk factor here, not direction. With daily ATR near 88 points and price pinned against band resistance, drawdown potential inside an intact uptrend is substantial. The 949.38–986.00 zone and the 911.25–873.12 band are the levels that will settle the argument. Until one side breaks, patience is worth more than conviction.
FAQ
What drove Lumentum Holdings Inc. stock higher on 12 August?
The stock surged on AI-driven revenue growth guidance. Lumentum guided Q1 FY2027 revenue to $1.225B–$1.275B with an operating margin of 39.5%–40.5%, supported by demand for 1.6T transceivers and optical networking infrastructure.
Is Lumentum Holdings Inc. stock overbought after the breakout?
Daily RSI at 61.35 is not overbought, leaving room for continuation. However, the 1H RSI at 76.09 and 15m RSI at 84.27 indicate extreme short-term stretch, suggesting the easiest part of the move may already be priced in.
What are the key levels to watch for Lumentum Holdings Inc. stock?
Bullish continuation needs acceptance above 949.38, targeting 986.00 and the psychological 1,000 area. Support sits at the daily pivot of 911.25, with 873.12 and the 836.50 low below. Loss of the hourly EMA20 at 862.52 would invalidate the short-term bullish structure.
Why did LITE fade after hours despite strong earnings?
A one-time, non-cash $7.8 billion charge tied to convertible note conversions created a $7.2 billion unadjusted net loss. This overshadowed the operating beat and triggered reflexive selling, despite the strong AI-driven fundamental narrative.
Disclaimer: This article is for informational purposes only and does not constitute financial advice, an investment recommendation, or a solicitation to buy or sell any financial instrument or cryptocurrency. The analysis provided is not indicative of future results. Investing in crypto assets and financial markets carries a high risk of capital loss. Always do your own research (DYOR) and consult a qualified financial advisor before making any decision.
Article produced with the assistance of artificial intelligence and reviewed by the editorial team.








 English (US) ·