
 2 months ago
43
2 months ago
43

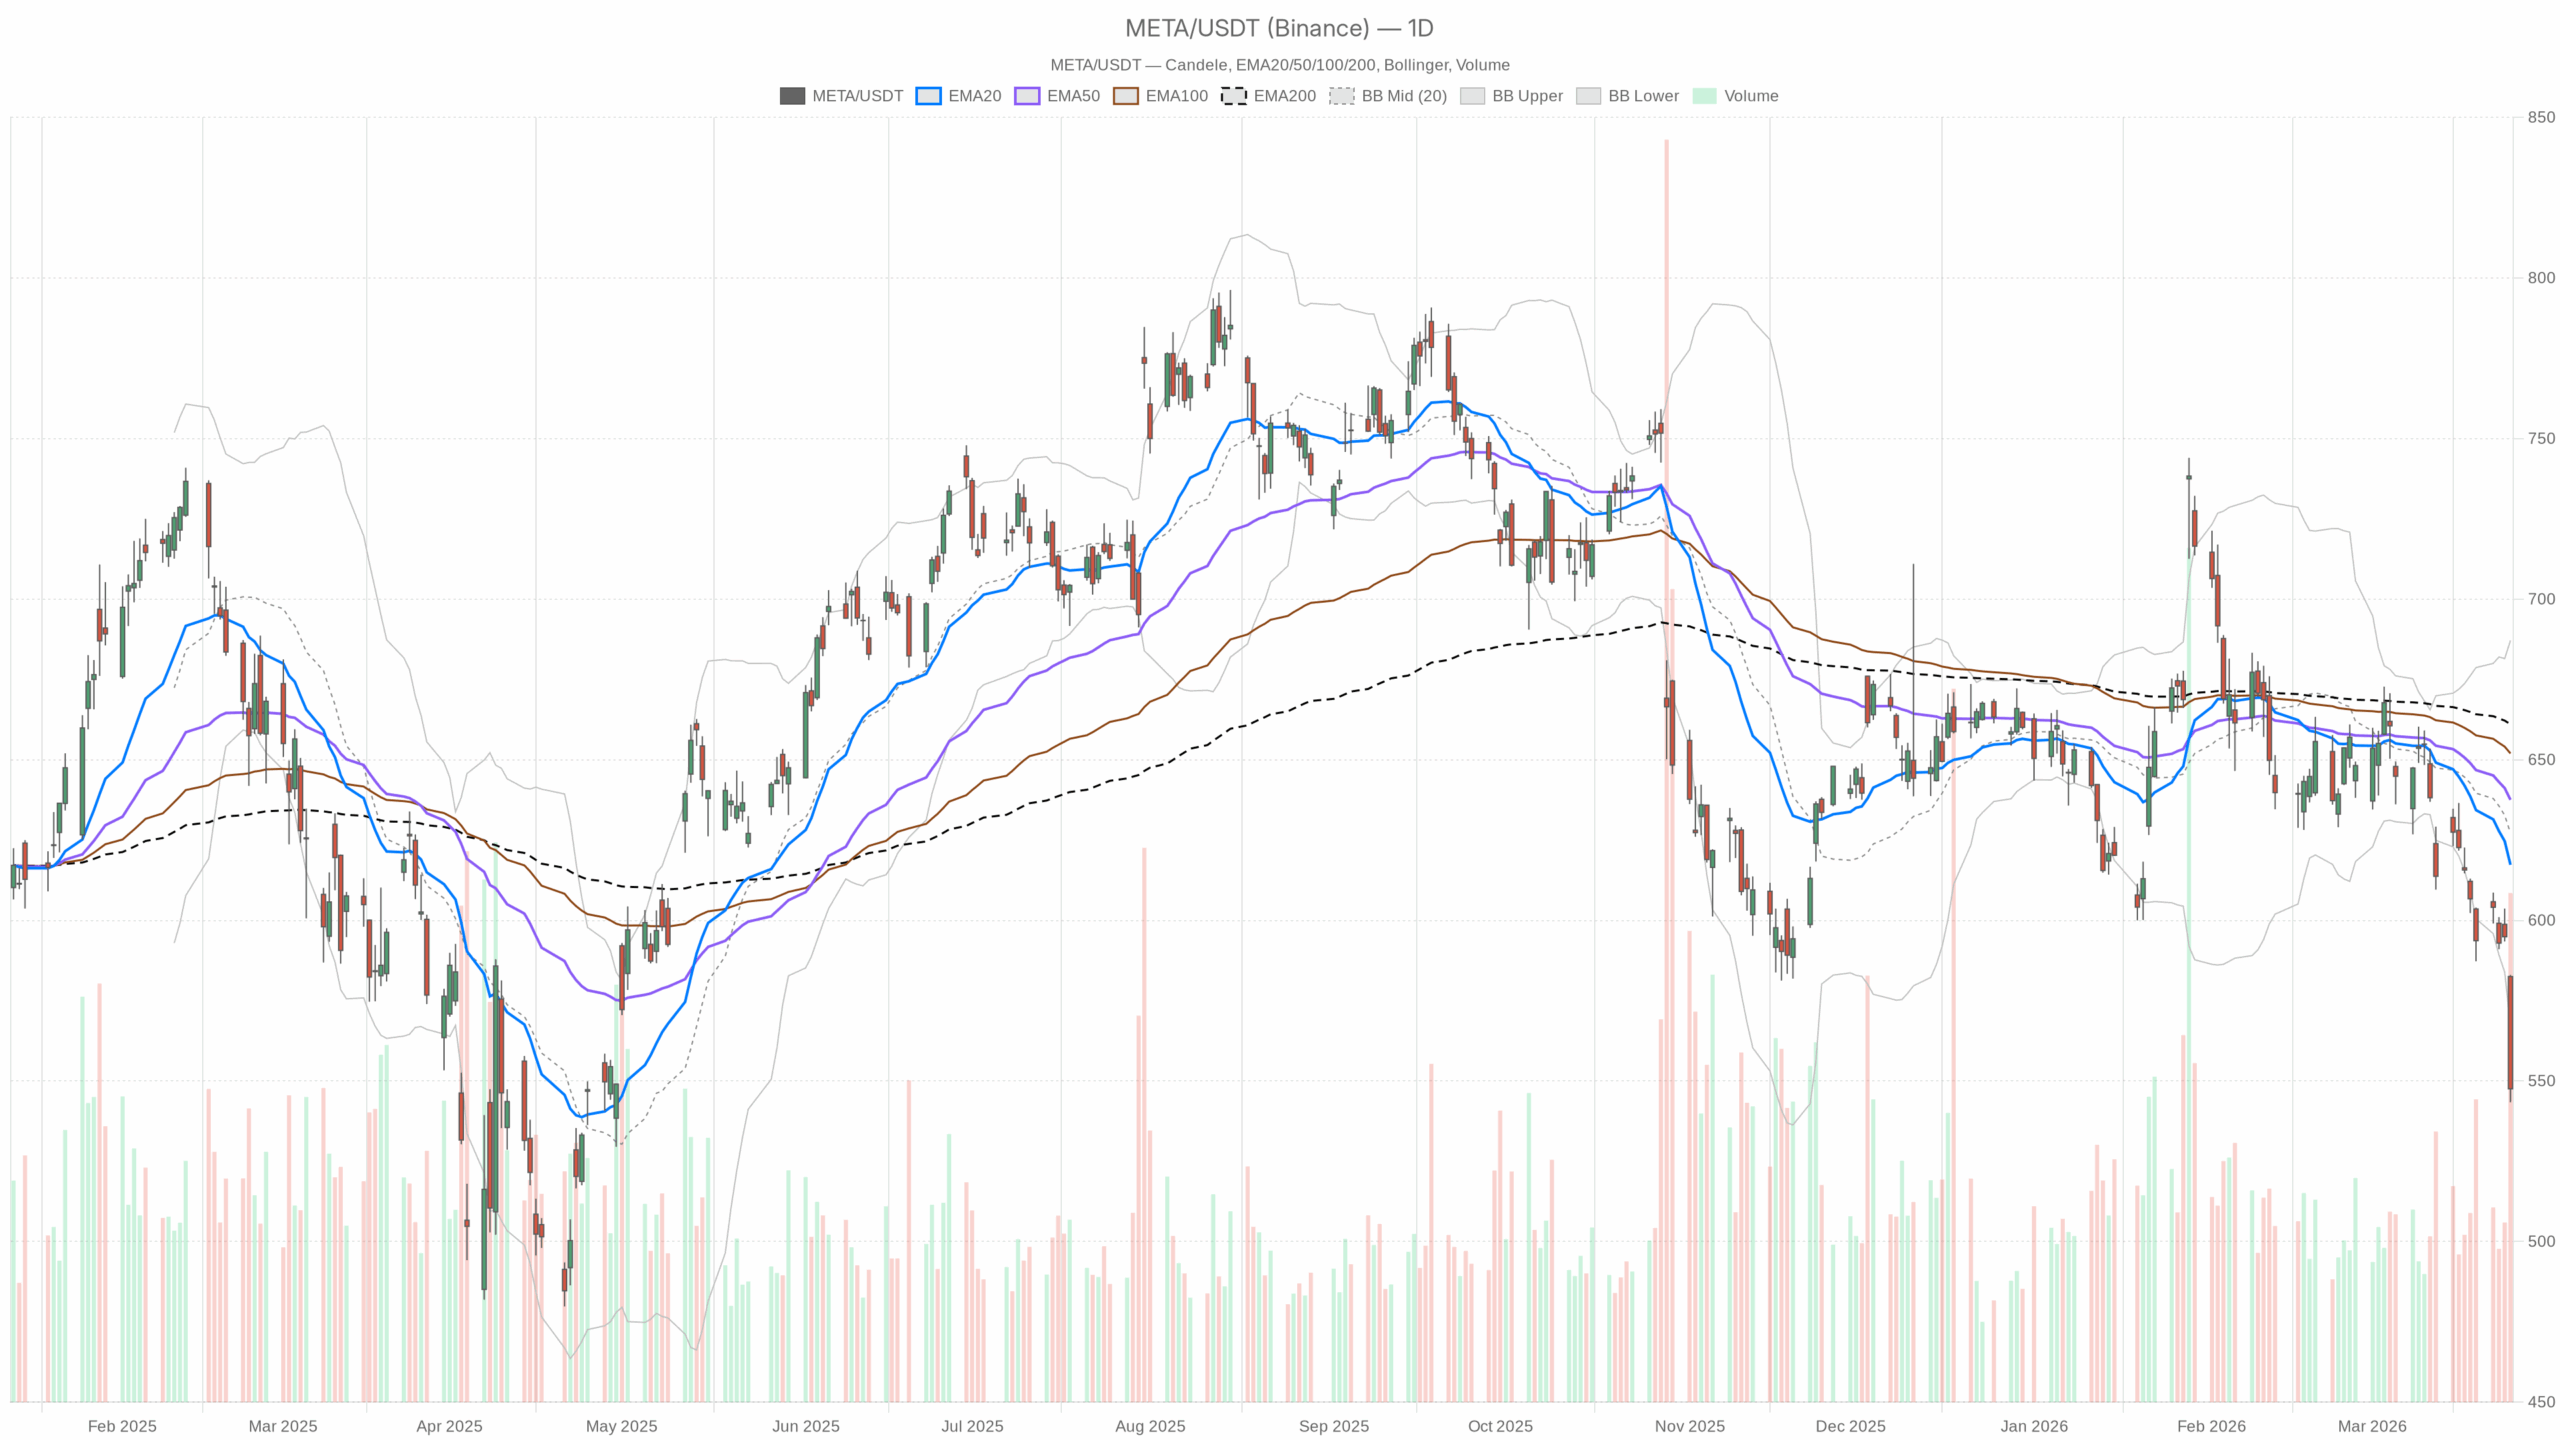 META — daily chart with candlesticks, EMA20/EMA50 and volume.
Meta Stock Under Legal Fire: Deep Oversold, But No Technical Bottom Yet
Meta stock has been hit hard, and the charts now reflect a market that is clearly in a bearish phase but also deeply oversold. The daily setup points to a dominant downside trend driven by sharp repricing of legal risk, while shorter timeframes show selling pressure still intact with only early hints of short-term stabilization.
The backdrop is ugly. Meta stock fell more than 7–8% after US jury verdicts found the company liable for harm to young users, sparking broad fears of a wave of social media addiction lawsuits and potential changes to the core design of its ad-driven products. At the same time, long-term narratives remain bullish, with Evercore ISI reiterating an Outperform rating and management dangling ambitious incentives tied to a potential multi-trillion-dollar market cap. However, the tape is telling a different story right now: legal risk is being priced in aggressively, and buyers are stepping aside.
Daily Chart: Bearish Regime with Extreme Oversold Conditions
On the daily timeframe, Meta stock closed at $547.54 after trading as low as $543.35, well below the day’s open at $582.49. That large intraday range, combined with heavy volume of roughly 35.7 million shares, signals institutional participation in the selloff rather than a retail-only flush. The current daily regime is explicitly flagged as bearish, and the price is trading well beneath all major moving averages. In practical terms, the primary trend is down and rallies are, by default, suspect until proven otherwise.
The 20-day EMA sits at $617.29, the 50-day EMA at $637.50, and the 200-day EMA at $661.03, all meaningfully above the last close around $547.50. This wide gap between price and its key EMAs indicates price has detached from its recent mean and is now in a momentum-driven downswing. In human terms, Meta stock is not just below trend; it has been punished away from its recent average levels, reflecting a sudden repricing rather than a slow grind lower.
Meanwhile, the daily RSI at 25.65 has fallen firmly into oversold territory (below 30). That confirms the intensity of the selloff. It shows downside momentum has been stretched and that short-term selling may be reaching exhaustion levels. However, oversold on its own does not equal a buy signal. In strong downtrends, RSI can stay depressed longer than contrarian traders expect.
The daily MACD is also leaning hard to the downside. The MACD line is at -19.76 versus a signal line at -12.82, producing a negative histogram of -6.94. The widening spread between line and signal underscores persistent negative momentum in Meta stock. Selling has not yet meaningfully slowed on the daily timeframe despite the oversold RSI.
Bollinger Bands on the daily chart highlight how far price has moved away from its recent mean. The mid-band is at $627.19, with the upper band near $687.15 and the lower band at $567.23. Meta stock is now trading below that lower band after closing around $547.54. Trading beneath the lower Bollinger Band indicates an overshoot to the downside. It often appears during panic or forced liquidation phases. However, such moves can persist if the underlying news flow, here legal risk, remains unresolved.
The daily ATR stands at $18.45, pointing to elevated volatility in Meta stock. Average daily price swings are now materially larger than during quieter periods. For traders, that means wider intraday ranges and potentially more slippage around stops and entries. Volatility is high because the market is still trying to find a new equilibrium after the legal shock.
Finally, short-term daily pivot levels frame the immediate technical battlefield. The daily pivot point (PP) is at $557.96, with first resistance (R1) near $572.58 and first support (S1) at $532.93. Because Meta stock closed below the pivot and relatively close to S1, the balance of intraday forces remains skewed to the downside. In practice, rallies back toward the $558–573 zone now represent the first overhead band where supply may reappear.
Overall, the daily chart for Meta stock is clearly bearish in trend, strongly oversold in momentum, and high in volatility. The story is a forced repricing lower, not a gentle correction. Oversold conditions raise the odds of sharp countertrend bounces, but the burden of proof for a true bottom remains high.
Hourly Chart: Selling Pressure Confirmed, With No Clear Base Yet
On the 1-hour timeframe, Meta stock closed the last observed bar at $547.15, just off the intraday low. This aligns with the daily weakness and confirms that sellers retained control into the close rather than allowing a strong late-session recovery. The hourly regime is also marked as bearish, so the intermediate trend is decisively aligned with the daily downtrend.
The hourly EMAs reinforce that alignment. The 20-period EMA is at $575.24, the 50-period EMA at $593.34, and the 200-period EMA at $627.92. Price is trading well under all three. This structure, a clean staircase of EMAs above price, characterizes a strong downtrend even on the intraday scale. For Meta stock, that means any rallies into the $575–595 band are currently more likely to be sold than to trigger a sustainable reversal.
The hourly RSI is down at 23.14, again deep in oversold territory. That shows intraday momentum is stretched to the downside much like the daily chart. When both daily and hourly RSIs sit in oversold zones, the market is vulnerable to violent short-covering rallies. Yet the absence of any real bounce into the close argues that bearish conviction has not yet cracked.
Furthermore, the hourly MACD is negative, with the line at -14.30 versus a signal of -9.78 and a histogram of -4.52. The MACD line below the signal line with a strongly negative histogram underscores ongoing intraday downside momentum. From a trader’s lens, Meta stock remains in a falling channel on the hourly chart, with no clear bullish cross or flattening yet that would confirm a shift.
Bollinger Bands on the 1-hour chart show the mid-band near $581.46, with the upper band at $623.33 and the lower band at $539.60. Meta stock is hovering close to that lower band, trading near $547.15. Staying pinned near the lower band tells us that selling pressure is continuous. It is not a one-off spike. It also means any bounce back toward the mid-band around $581 would, for now, be a countertrend move against the prevailing hourly downtrend.
The hourly ATR at $7.74 captures the intraday volatility that traders have been facing in Meta stock. Average one-hour swings are sizable relative to price, which can complicate tight stop placement and short-term execution. Elevated ATR in conjunction with a directional move usually signals an emotionally charged market, and that is consistent with the legal headlines driving sentiment.
The hourly pivot point is at $547.76, with R1 around $549.36 and S1 close to $545.55. Meta stock finished the last bar at $547.15, essentially right around the hourly pivot but below R1. That location suggests a minor intrahour equilibrium after a heavy slide, not a convincing recovery. The very tight range between these levels also highlights that, into the last hour, price had compressed somewhat after a larger downside move earlier in the session.
Taken together, the hourly chart confirms the daily bearish bias in Meta stock rather than challenging it. Conditions are oversold, but the structure shows no mature base or clear reversal signal yet. For now, H1 acts as confirmation of the daily downtrend with a modest warning that a short-covering rebound could emerge once sellers tire.
15-Minute Context: Micro Signs of Stabilization, Not a Trend Change
On the 15-minute timeframe, Meta stock’s last bar closed at $547.15 after trading between $546.16 and $547.94. This narrow intrabar range reflects a pause in selling rather than a dynamic bounce. The 15-minute regime is still labeled as bearish, so even at this execution level, the microtrend is pointed down.
The 15-minute EMAs show the 20-period at $554.21, the 50-period at $569.12, and the 200-period at $595.75, all above spot price. That configuration matches the higher timeframes: price under all key short-term averages in Meta stock indicates that any upticks are still occurring within a downward-sloping structure. Short-term traders treating this timeframe as an execution lens will see rallies toward $554–569 as initial supply zones.
Notably, the 15-minute RSI sits at 26.92, again in oversold territory. This echoes the daily and hourly oversold readings. When RSI is depressed across D1, H1, and M15 simultaneously, it often marks a late phase in a downside swing. However, it does not, by itself, guarantee an immediate reversal. It only tells us that short-term selling has become crowded and that risk-reward for fresh shorts at current levels is deteriorating.
One nuance appears in the 15-minute MACD. The MACD line is at -8.18, the signal at -9.44, and the histogram is slightly positive at 1.26. That positive histogram indicates the MACD line has ticked above the signal line on this very short timeframe. In other words, there is a tentative micro-bullish crossover in Meta stock. Traders will recognize this as the first concrete intraday sign that downside momentum is easing and that a small bounce or consolidation phase could be underway.
Bollinger Bands on the 15-minute chart show the mid-band at $551.73, with the upper band at $562.48 and the lower band at $540.98. Price around $547.15 trades between the mid and lower bands. That placement indicates Meta stock is no longer pressing the extreme intraday lows with every bar, but it is still trading in the lower half of its short-term volatility envelope. The selling pressure has paused, yet it has not truly reversed.
The 15-minute ATR at $2.99 reflects meaningful but not extreme price noise at this scale. For scalpers and short-term traders, it highlights that Meta stock can move several dollars per 15-minute bar when volatility spikes, which requires disciplined risk controls.
Finally, on this execution timeframe, the pivot point is at $547.08, with R1 at $548.01 and S1 at $546.23. The last price is almost exactly on the pivot at $547.15. That indicates short-term indecision in Meta stock right at a minor balance point. Bulls and bears are temporarily in a stalemate after the prior drop, consistent with the small positive MACD histogram and stabilized RSI.
In summary, the 15-minute chart offers the first hint of stabilization through a tiny MACD improvement and flat price action around the pivot. However, this backdrop remains nested inside a clearly bearish hourly and daily trend, so any intraday bounce at this stage would be tactical rather than structural.
News and Price Action: Legal Shock vs. Long-Term Ambition
Recent news around Meta stock provides a clear catalyst for the technical breakdown. Reuters reports that Meta shares dropped about 7% after verdicts holding it liable for harm to young users, raising concerns about broader legal exposure and potential changes to design practices critical to its advertising model. Yahoo Finance highlights that Meta stock fell more than 8% and dragged other social media names down on the lawsuit fallout. The market is not merely reacting to a single verdict; it is re-evaluating the company’s risk profile.
In contrast, fundamental sentiment from some analysts and management remains constructive. Evercore ISI reiterated an Outperform rating on Meta stock, and recent commentary from The Motley Fool underscores ambitious internal targets, including incentives tied to reaching a very large potential market capitalization over the coming years. That long-term bullish narrative sits uneasily beside the current legal overhang. The charts show which story dominates in the short run: legal risk and uncertainty.
Therefore, the current technical damage in Meta stock is best interpreted as a repricing of legal and regulatory risk rather than a broad collapse in faith in the business model. Yet until the market gains clarity on the scale and scope of potential lawsuits and any required platform changes, volatility is likely to remain elevated and rallies subject to skepticism.
Bullish Scenario: Oversold Rebound and Repair Phase
The bullish scenario for Meta stock begins with the idea that the current move is an overshoot to the downside driven by fear, not a fundamental collapse. Multiple timeframes show RSI below or near 30, indicating that selling has been exhaustive across daily, hourly, and 15-minute charts. Bulls will look for this exhaustion to trigger a short-covering rally and then a gradual repair of the technical structure.
On the daily chart, a first constructive step would be for Meta stock to hold or reclaim the $532.93–$547.54 zone, which brackets the recent close and the daily S1 support. Stabilizing above that band would signal that the initial legal shock has been absorbed. A sustained push back above the daily pivot at $557.96, and then toward the first resistance at $572.58, would strengthen the argument that a tradable low is forming.
From there, bulls would want to see Meta stock challenge the 20-day EMA near $617.29 over time. Reclaiming the 20-day EMA and holding above it would mark a more meaningful shift from panic to repair. It would also likely coincide with the daily RSI lifting back into the 40–50 range, consistent with a transition from oversold to neutral. A flattening and eventual bullish crossover in the daily MACD would further validate that the worst of the downside momentum is past.
On the hourly chart, a bullish pathway requires Meta stock to build a base above recent lows, followed by a series of higher lows and higher highs. The early sign would be a sustained push back above the hourly pivot at $547.76 and hourly R1 near $549.36, accompanied by an RSI recovery above 30 and a MACD crossover toward positive territory. If price then reclaims the hourly 20-EMA around $575.24 and starts compressing between there and higher levels, short-term traders could begin to treat dips as buying opportunities rather than automatic shorts.
At the micro level, the 15-minute chart already hints at the first stage of this bullish script. The small positive MACD histogram and flat price near the pivot show that intraday sellers are no longer in complete control. If Meta stock can extend that stabilization into a series of constructive 15-minute candles that break above R1 at $548.01 and press toward the Bollinger mid-band at $551.73, short-term momentum would start to flip.
Crucially, the bullish case will gain real traction only if legal headlines stabilize and investors begin to focus back on earnings power, cash flow, and Meta’s longer-term AI and advertising initiatives. In that environment, the current oversold condition would look more like a buying opportunity that emerged from a temporary bout of headline-driven fear.
Bearish Scenario: Legal Overhang Extends the Downtrend
The bearish scenario for Meta stock centers on the possibility that recent verdicts represent the beginning of a longer, more expensive legal cycle rather than an isolated event. If investors conclude that Meta faces a steady stream of lawsuits, potential regulatory changes, and costly redesigns of engagement mechanics, the multiple assigned to its earnings could compress further. Technically, that would translate into a continuation and possible acceleration of the downtrend.
On the daily chart, a failure to hold above the S1 support at $532.93 would be the next major warning. A decisive break below that zone on strong volume would indicate that oversold conditions in Meta stock are not sufficient to attract meaningful dip buying. RSI could remain depressed or even make new lows, confirming that the market is entering a sustained bearish phase rather than a quick flush.
If price remains stuck below the daily pivot at $557.96 and cannot reclaim the lower Bollinger Band near $567.23 over the coming sessions, it would show that sellers still control the tape. In that case, the 20-day EMA at $617.29 would stay well above price and continue to slope downward. That would reinforce the view that rallies are trapped within a broader bear trend and are best framed as relief moves rather than new upswings.
On the hourly timeframe, persistent trading beneath the pivot at $547.76 and repeated failures near hourly resistance at $549.36 would highlight intraday selling on every small rally. An hourly RSI that cannot regain the 40–50 zone and a MACD that fails to hold any bullish cross would indicate that the downtrend is simply consolidating before the next leg lower in Meta stock.
At the execution level, the 15-minute chart would likely shift back from mild stabilization to renewed weakness if price falls below S1 at $546.23 and presses toward the lower Bollinger Band around $540.98. A rollover in the 15-minute MACD back to a negative histogram, combined with another dive in RSI, would signal that the short-covering bounce has failed and sellers are back in control.
For the bearish scenario to persist, legal news and commentary would need to stay negative or escalate. Additional judgments, new lawsuits, or signals from regulators about more stringent oversight could all serve as catalysts. Under that backdrop, the current oversold readings would not mark a bottom, but rather a waypoint in a longer and more volatile downtrend in Meta stock.
What Would Invalidate the Bearish Case?
For the immediate bearish thesis to be meaningfully challenged, Meta stock needs more than an oversold bounce. It requires clear technical repair and some easing in perceived legal risk.
First, on the charts, a multi-day stabilization above the recent lows with higher daily closes would be key. A break back above the daily pivot at $557.96, sustained for several sessions, would be an early sign. Subsequent follow-through toward and then above the lower Bollinger Band at $567.23 would confirm that the panic leg lower has been rejected.
Second, recapturing the 20-day EMA at $617.29 and holding above it would significantly undermine the bearish narrative. It would show that the market is willing to buy Meta stock not just for quick trades, but to rebuild positions at higher reference levels. This move should be accompanied by a daily RSI recovering toward neutral and a MACD line curling higher and crossing its signal line.
Third, on the intraday front, a transition where the hourly EMAs flatten and then turn higher, with price consistently trading above the 20- and 50-period EMAs, would indicate a shift in short- and medium-term control from sellers to buyers. If, at the same time, volatility (ATR) starts to contract from elevated levels, Meta stock would be signaling a move from a liquidation phase to an accumulation phase.
Finally, from a narrative standpoint, any legal or regulatory developments that reduce perceived tail risk, such as settlements that clarify cost ceilings, favorable appeals, or guidance indicating limited future exposure, would help investors look through the current headlines. Combined with the technical improvements above, those developments would substantially weaken the bearish case and allow the long-term growth story, including management’s ambitious targets, to reassert itself.
Positioning, Volatility, and Uncertainty
Meta stock is in a technically bearish environment marked by deep oversold readings, heavy volume, and headline-driven volatility. The daily and hourly charts align in pointing to a strong downtrend. The 15-minute chart only hints at short-term stabilization, not a confirmed turn. Oversold conditions across timeframes open the door to sharp rallies, but the prevailing trend and news flow remain negative.
For portfolio managers and traders, the key themes now are positioning and risk management rather than aggressive directional conviction. Volatility is elevated, legal uncertainty is high, and the technical picture has not yet formed a durable bottom. Until price can rebuild above key pivots and short-term moving averages, Meta stock should be treated as a name in a correction phase, where both downside spikes and sharp countertrend rallies are likely to continue.


 English (US) ·