
 2 months ago
89
2 months ago
89
Micron stock faces a conflicted technical setup after an abrupt 8% drop on July 16. MU now sits below key moving averages, with the daily chart turning decidedly cautious. Yet AI-driven memory demand keeps the long-term story intact, leaving traders to weigh short-term pressure against structural growth.
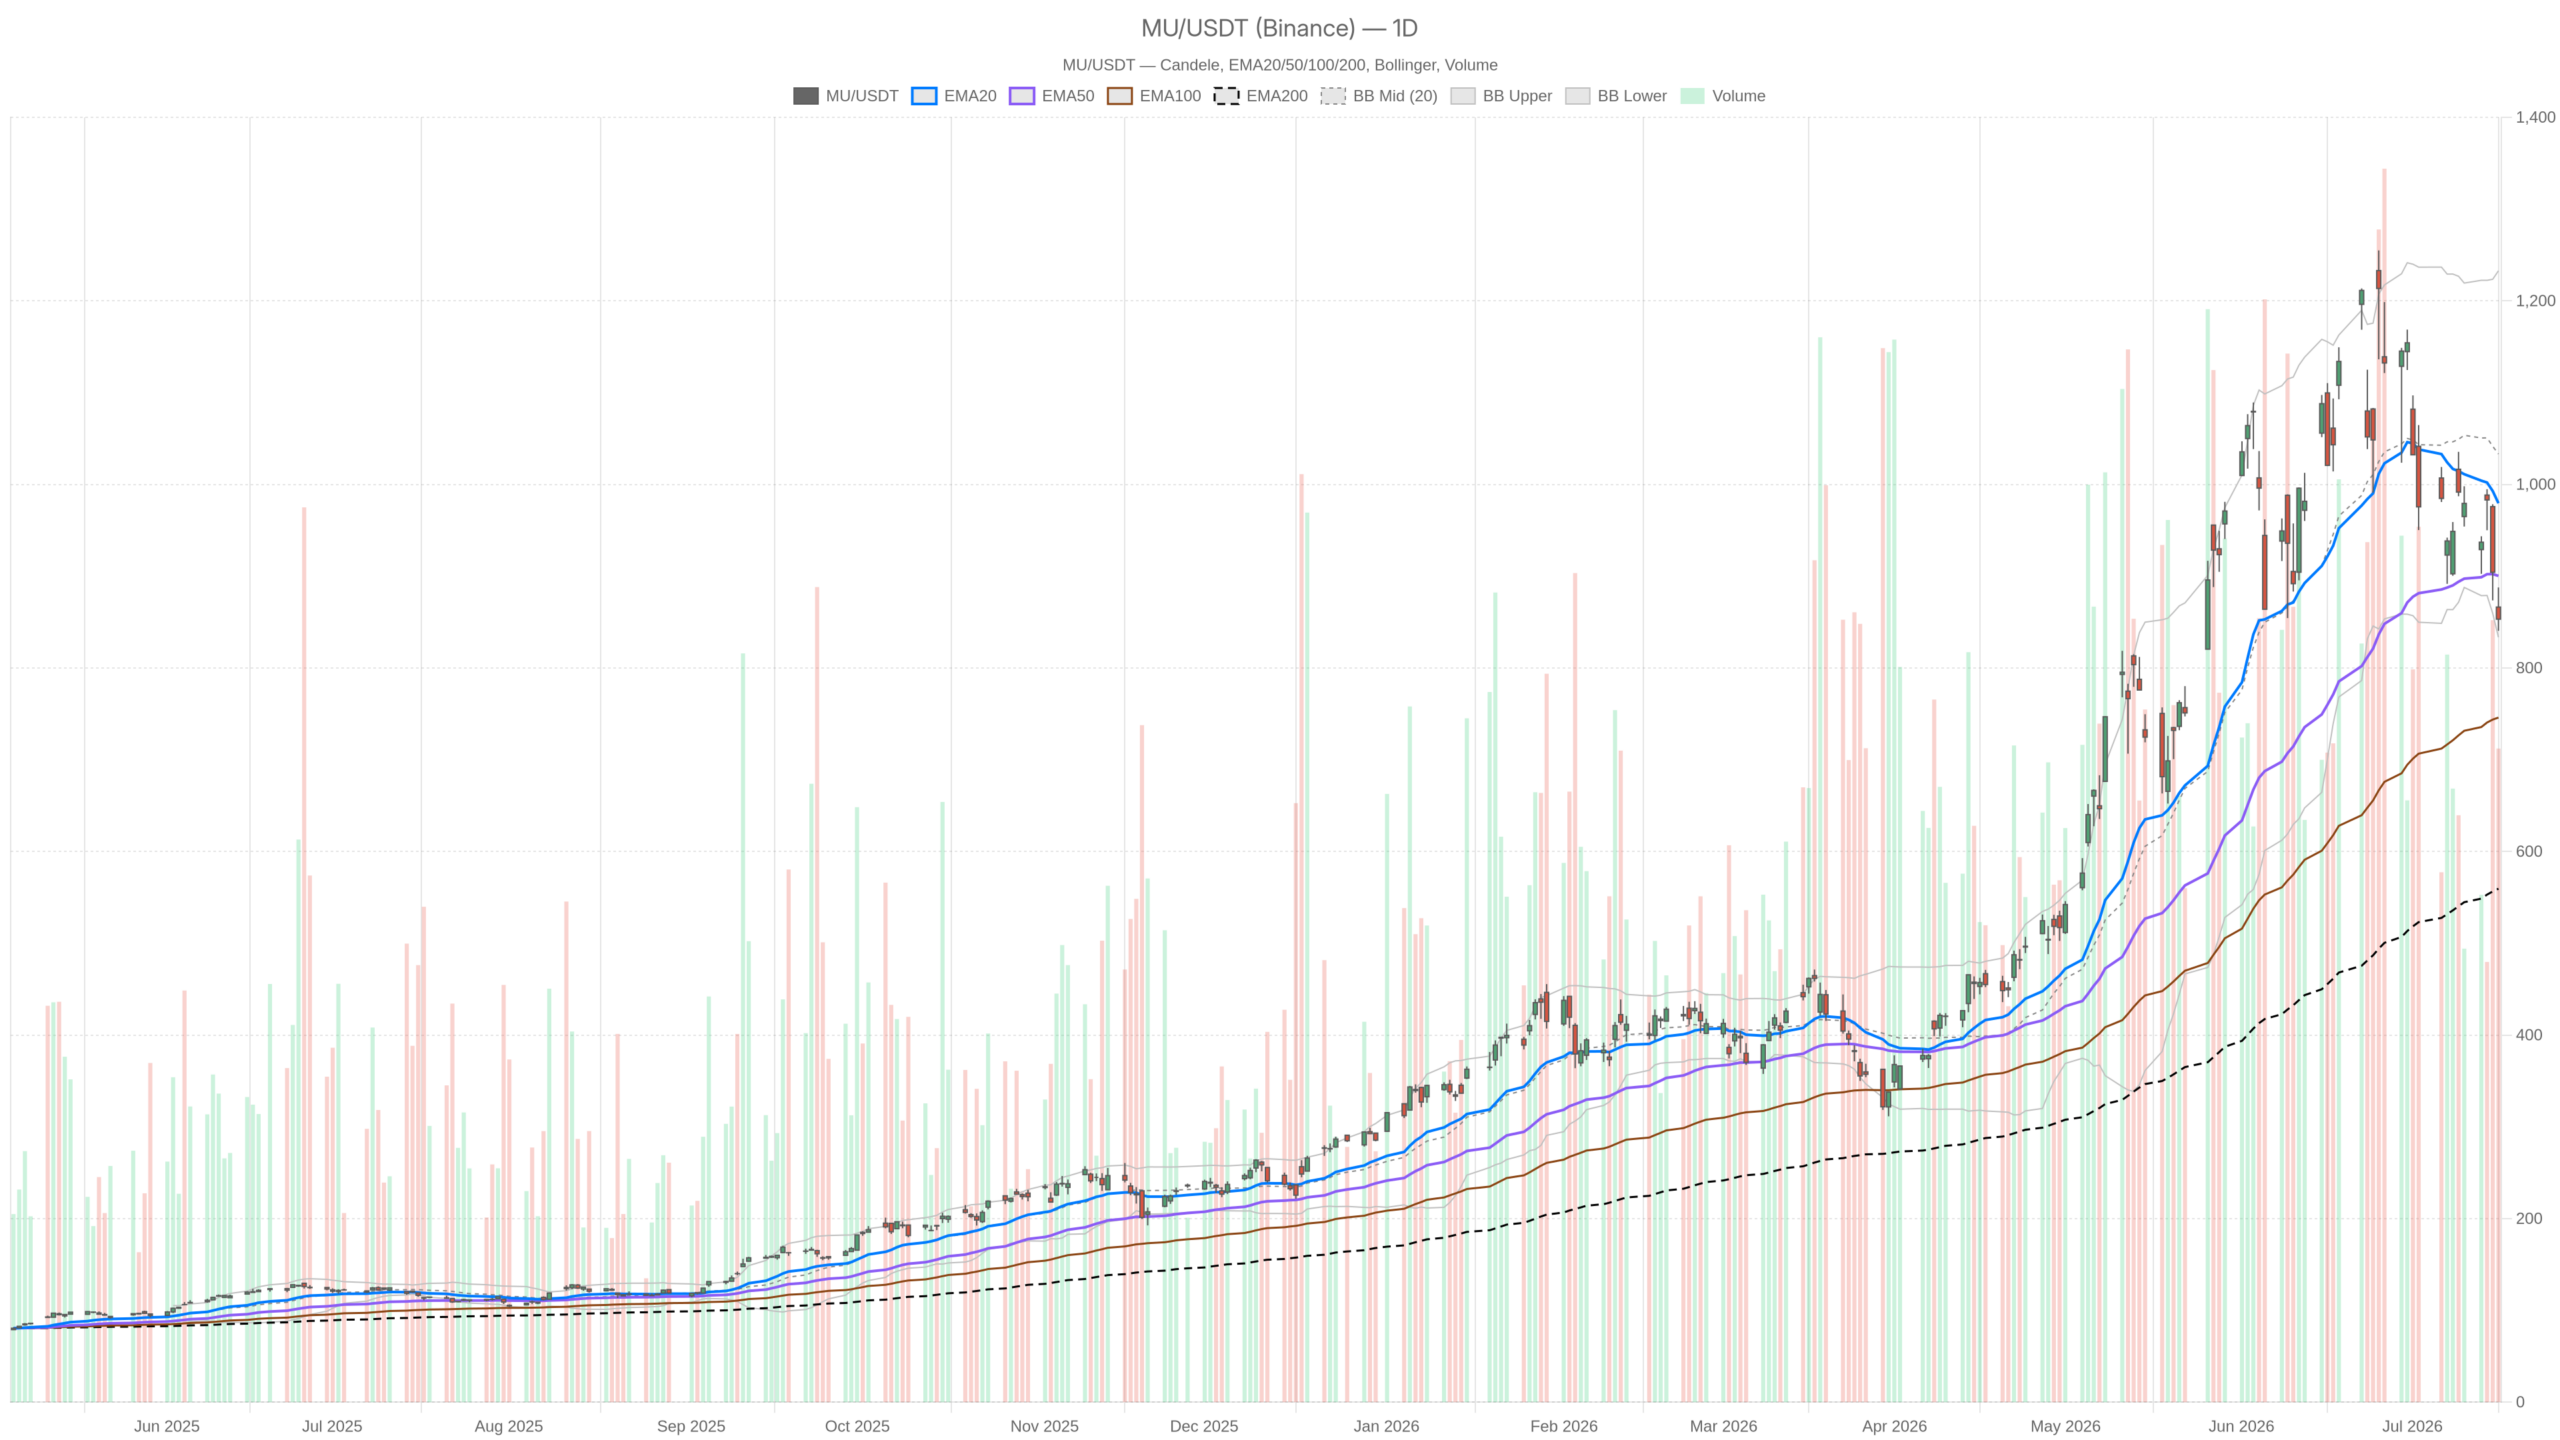 MU — daily chart with candlesticks, EMA20/EMA50 and volume.
Key takeaways
- MU dropped 8.0% on July 16 with no fundamental catalyst, while the S&P 500 gained 0.4%
- MU closed at $853.20, well below the 20-day EMA at $979.47 and the 50-day EMA at $900.34
- Daily RSI at 41.26 signals deteriorating momentum, with MACD histogram at -29.72 confirming sustained selling
- The 200-day EMA at $559.45 remains far below price, keeping the long-term uptrend structurally intact
- Key support sits at $833.24, with a daily ATR of $80.80 underscoring elevated volatility risk
Micron Stock Daily Bias: Bearish Below Key Moving Averages
The daily chart leans decisively bearish for Micron stock. MU closed at $853.20 on July 16, well below both the 20-day EMA at $979.47 and the 50-day EMA at $900.34.
The gap between price and those averages is not a marginal deviation. It reflects a stock in a meaningful downtrend from its recent highs. Meanwhile, daily RSI sits at 41.26 — not oversold, but clearly drifting toward it. Momentum is deteriorating without yet signaling an exhaustion low.
The MACD reinforces this reading. The line is at -9.38, the signal at 20.34, and the histogram at -29.72. This wide negative spread confirms sustained selling pressure across the session structure.
Notably, the daily Bollinger Bands offer some nuance. The lower band sits at $833.45, and price closed just above it. When price hugs the lower band without breaking through, it can signal compression rather than a full breakdown.
However, the midline at $1,033.13 leaves an enormous gap to recover. Any mean-reversion story remains distant. The daily pivot sits at $860.47, with R1 at $880.44 and S1 at $833.24. Price closed below the pivot — a soft bearish signal.
The $833 support level is the first line of defense. A break below would push Micron stock into unambiguous breakdown territory. Still, the 200-day EMA at $559.45 remains far below current price. The broader uptrend off the longer-term base stays technically intact.
Hourly Confirmation: The 1H Chart Deepens the Bearish Case
The 1-hour chart does not provide relief for Micron stock. If anything, it reinforces the daily weakness. MU’s hourly close sits at $853.66, below the 20H EMA at $895.79, the 50H EMA at $937.71, and the 200H EMA at $980.19.
That full stacking of moving averages above price — in sequential bearish order — confirms trend compression to the downside. The hourly RSI at 32.20 is approaching oversold. It has not yet triggered a reversal signal, but the proximity to the 30 threshold bears watching.
Meanwhile, the hourly MACD histogram at -5.15 remains negative. Yet the gap between the line and signal is narrowing. That convergence is worth monitoring. It is not a buy signal, but it suggests the selling impulse may be losing velocity on this timeframe.
In contrast, the hourly Bollinger lower band at $807.21 sits well below current price. Room remains for further downside before any statistical mean-reversion band is touched. The hourly pivot is $851.27, with R1 at $857.89 and S1 at $847.03. Price closed above the hourly pivot — a minor stabilization within an otherwise bearish regime.
Short-Term Execution: 15-Minute Stabilization Signals
The 15-minute chart shows tentative stabilization, not yet a reversal. The 15m MACD histogram turned positive at 2.60, suggesting the very short-term selling pressure is pausing.
RSI on this timeframe sits at 43.75 — neutral, not oversold. However, price on the 15m chart remains below its 50-period and 200-period EMAs. The bearish regime classification therefore holds.
Notably, the 15m Bollinger Bands are narrowing. The upper band sits at $859.23 and the lower at $842.02. This contraction in volatility after the explosive move often precedes the next directional leg.
Overall, the 15m setup supports short-term range trading near the $847–$858 zone. Any push above $857.60 — the R1 level — could test the broader hourly resistance cluster. For now, this is a stabilization, not a turnaround.
What Triggered Micron Stock’s Sell-Off?
No fundamental misstep triggered Micron stock’s sell-off. MU dropped 8.0% on July 16 while the broader S&P 500 gained 0.4%, according to Yahoo Finance reporting.
The company had made no error. Analysts publicly weighed in on the move, and the prevailing interpretation frames it as profit-taking rather than fundamental deterioration. A Seeking Alpha rating downgrade explicitly casts the move in that light.
At the same time, AI-driven memory pricing continues to boost the growth outlook. The reset risk flagged — the possibility that memory pricing could roll over — is a longer-term concern, not an immediate one.
Meanwhile, a separate analysis predicts Micron stock could nearly double by late 2027 as the memory chip shortage persists. That kind of long-duration bullish framing is common in stocks experiencing short-term volatility atop a structural AI-demand thesis.
Bullish Scenario: Can Micron Stock Recover?
A reclaim of the $880–$900 zone would mark the first meaningful recovery for Micron stock. That range houses the daily 50 EMA and the S1 pivot cluster.
Above that, the daily 20 EMA at $979 would need to be cleared. Only then would the daily bias shift back toward neutral-to-bullish. On momentum, daily RSI would need to turn higher from the current 41 level without slipping into oversold.
On the momentum front, a positive MACD histogram crossover on the daily — still some distance away — would add confirmation. The fundamental backdrop remains supportive. AI memory demand, a memory chip shortage narrative, and analyst defense of the name post-sell-off all provide a floor for sentiment.
In this scenario, the 8% drop becomes a shakeout rather than a trend change. It would represent a violent but ultimately repairable episode in an ongoing structural bull market for memory.
Bearish Scenario: What Would Deepen the Decline?
A break below the daily S1 pivot support at $833.24 would signal that selling pressure is accelerating beyond a simple profit-taking event. At that point, the next significant technical reference becomes harder to identify cleanly.
Meanwhile, the hourly regime is already classified as bearish. If the 15m stabilization fails and price loses the $847 hourly support, another leg lower becomes the path of least resistance. The daily ATR of $80.80 makes clear that MU is a high-volatility instrument. A single session can cover enormous ground in either direction.
In the broader context, the reset risk cited in the Seeking Alpha downgrade would be the fundamental catalyst to monitor. If memory pricing reverses as AI capex cycles normalize, the bearish technical picture could find fundamental alignment.
Positioning and Volatility: A High-Stakes Setup for MU
Micron stock presents a high-stakes setup. The daily chart defines a bearish short-term bias. The hourly chart confirms it. Only the 15-minute timeframe shows a flicker of stabilization.
At the same time, the fundamental story has not broken down. It has simply been overshadowed by a sharp, technically-driven sell-off. The ATR of $80.80 on the daily frame underscores the volatility risk on both sides. Positions in MU require wide stops and clear invalidation levels.
The $833–$887 range captures the immediate daily battleground. How price behaves at those boundaries over the coming sessions will determine whether this was a healthy shakeout or the start of something more structurally damaging.
For now, the weight of the evidence tilts bearish on the short and medium-term view. The longer-term structural case remains intact — for those with the patience and risk tolerance to hold through the noise.
FAQ
Why did Micron stock drop on July 16?
MU dropped 8.0% on July 16 with no fundamental misstep from the company. The broader S&P 500 gained 0.4% on the same day. Analysts interpret the move as profit-taking rather than a deterioration in the business outlook.
What are the key support levels for MU?
The immediate support sits at $833.24, corresponding to the daily S1 pivot and the lower Bollinger Band at $833.45. Below that, the next significant level is the hourly support at $847.03. The 200-day EMA at $559.45 provides a long-term structural anchor.
What is the near-term technical outlook for Micron stock?
The technical picture is bearish in the short term, with MU below both the 20-day and 50-day EMAs. However, the fundamental AI-driven memory demand story remains intact. A reclaim of the $880–$900 zone would mark the first step toward technical recovery.
What is the long-term outlook for Micron stock?
The 200-day EMA at $559.45 remains far below the current price of $853.20, keeping the long-term uptrend structurally intact. Some analysts project Micron stock could nearly double by late 2027, supported by persistent memory chip shortages and AI demand.
Disclaimer: This article is for informational purposes only and does not constitute financial advice, an investment recommendation, or a solicitation to buy or sell any financial instrument or cryptocurrency. The analysis provided is not indicative of future results. Investing in crypto assets and financial markets carries a high risk of capital loss. Always do your own research (DYOR) and consult a qualified financial advisor before making any decision.
Article produced with the assistance of artificial intelligence and reviewed by the editorial team.






 English (US) ·