
 3 hours ago
11
3 hours ago
11

Microsoft Corporation stock sits at a technical crossroads. At $395.63, MSFT hovers just below its daily EMA50 of $395.64. The stock trades well beneath its EMA200 at $426.22 — signaling recovery mode, not trend mode. The July 29 earnings report looms as the decisive catalyst.
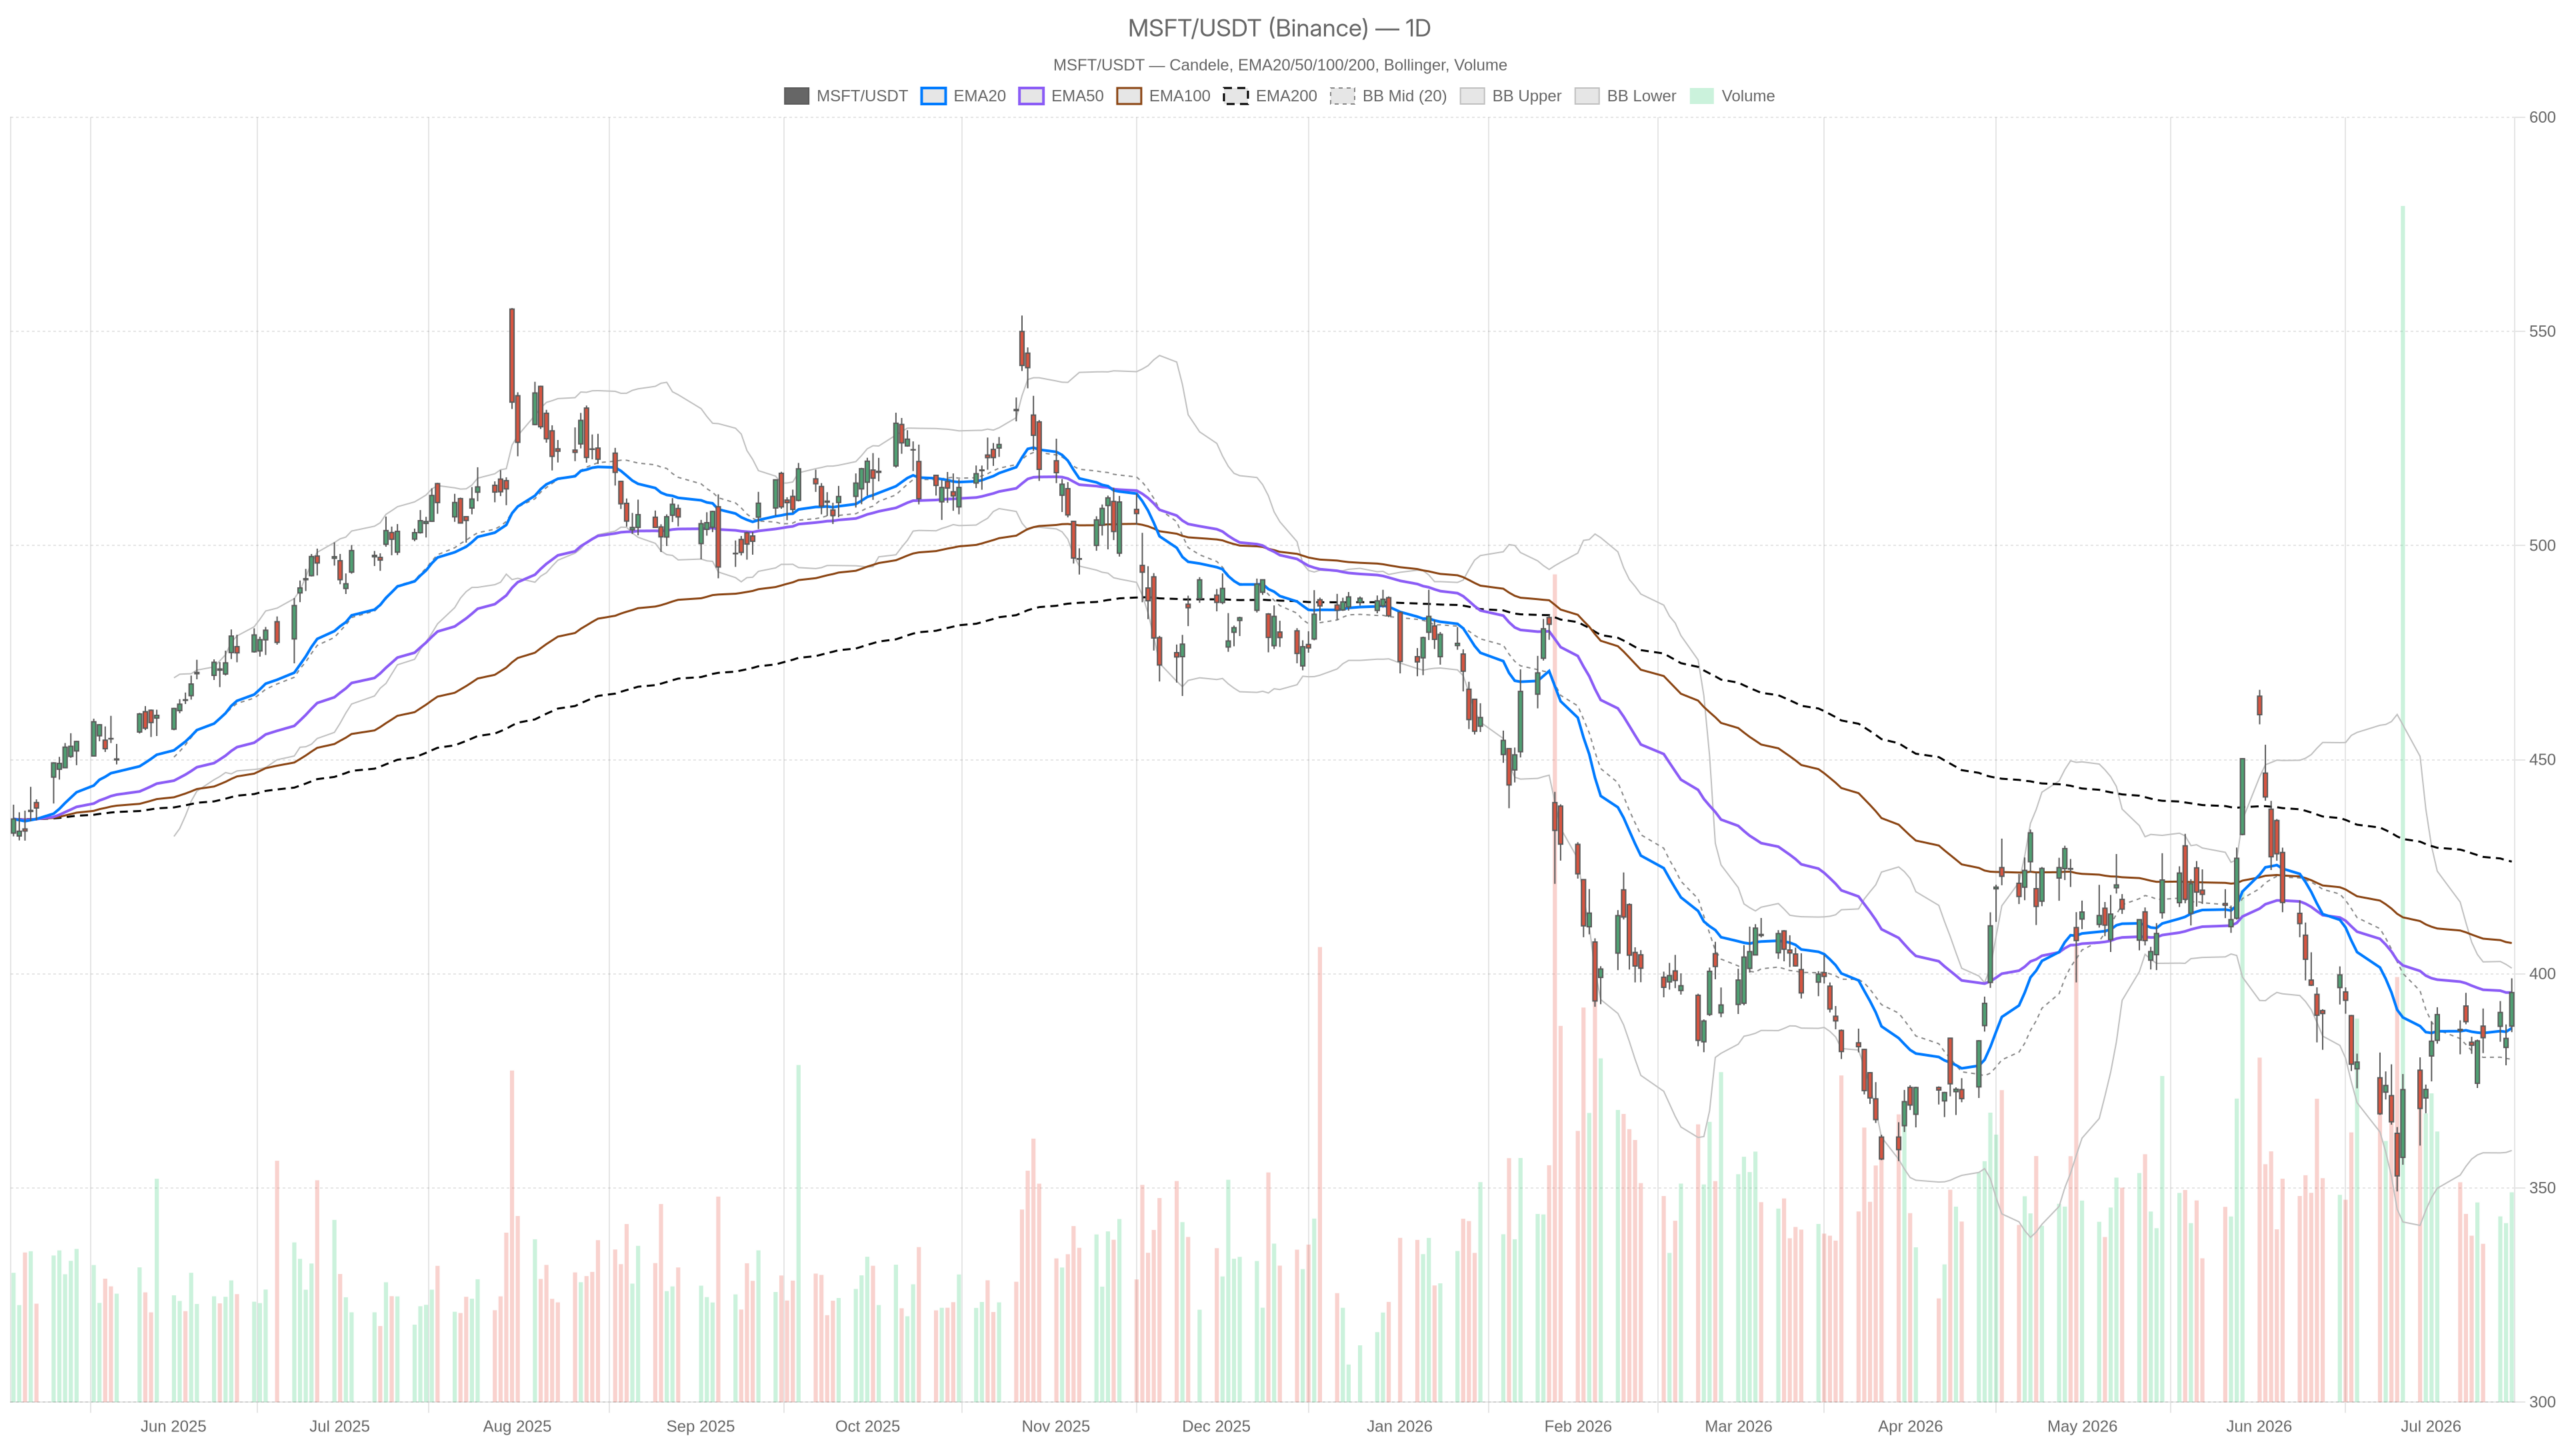 MSFT — daily chart with candlesticks, EMA20/EMA50 and volume.
Key takeaways
- MSFT closed at $395.63 on July 15, touching the daily EMA50 but remaining well below the EMA200 at $426.22.
- Daily RSI at 53.5 and MACD histogram at +2.99 signal fading bearish momentum — not yet a confirmed uptrend.
- The 1H timeframe is more constructive, with price above all three key EMAs and an RSI at 63.13.
- The $388–$401 range defines the immediate battleground ahead of the July 29 earnings report.
- Citi and Mizuho trimmed price targets while maintaining bullish ratings, reflecting tension between capex concerns and AI conviction.
Microsoft Corporation Stock: Reading the Daily Structure
The daily chart for Microsoft Corporation stock presents a neutral picture with a tentative bullish tilt. Price sits at the EMA50, short-term momentum has improved, but the EMA200 overhead at $426.22 keeps the trend firmly unconfirmed.
Trend Structure and MACD Recovery Signals
Price closed at $395.63, effectively touching the EMA50, after trading a wide intraday range between $386.40 and $398.96. That kind of range — over $12 wide — reflects genuine indecision, not conviction. The EMA20 at $387.35 is now well below price, confirming that near-term momentum has improved. However, the EMA200 at $426.22 looms as a significant overhead barrier, roughly 7.7% above current levels.
The daily MACD reinforces this cautious read. The MACD line sits at -2.96, still in negative territory. Yet the histogram has printed at +2.99, suggesting the negative momentum is actively decelerating. This is a classic early-recovery signal — not confirmation of a new uptrend, but an indication that selling pressure is losing force. The difference matters: fading bearish momentum is not the same as fresh bullish momentum.
RSI, Bollinger Bands, and Volatility Context
Meanwhile, the daily RSI at 53.5 sits comfortably in neutral territory. It is above the 50 midpoint, which gives bulls a marginal edge, but it offers no urgency. There is room for price to run higher without hitting overbought conditions. Equally, there is nothing here to rule out a pullback toward the $388.37 daily S1 support level.
Bollinger Band positioning adds another layer of nuance. The midline sits at $380.05, with the upper band at $401.34. Current price is pressing toward the upper band — a zone that historically attracts mean-reversion selling pressure. The daily ATR of $12.49 confirms that volatility remains elevated. Wide daily ranges are the norm right now, not the exception.
Hourly Momentum: The Stronger Case for Bulls
The hourly chart paints a more constructive picture for Microsoft Corporation stock. Price at $395.62 trades above all three key EMAs — the EMA20 at $391.49, the EMA50 at $387.93, and the EMA200 at $389.89. This clean alignment signals that intraday dip buyers have been active and effective.
The hourly RSI at 63.13 supports this view without yet flashing a warning. It is elevated but not overextended, leaving technical room before the 70 overbought threshold becomes a concern. The hourly MACD reinforces the case: the line at 2.74 leads the signal at 2.08, and the histogram at +0.65 remains positive. Momentum on the hourly chart is still directionally up.
At the same time, the 1H Bollinger Band upper at $399.99 acts as the next visible ceiling. Price is approaching that zone, and a stall or rejection there would not be surprising. The 1H pivot resistance at $396.45 is the immediate hurdle. A clean break and hold above that level would be the first confirming signal for any extension toward the $400 area.
15-Minute Context: Short-Term Regime Turns Bullish
The 15-minute chart is the only timeframe formally flagged with a bullish regime. Price sits above all three 15m EMAs, and the RSI at 56.4 is constructive without being stretched.
However, the 15m MACD histogram has turned slightly negative at -0.44 — a subtle sign of very short-term fading. This is not alarming. It simply suggests that the most recent micro-impulse may need to consolidate before any further push higher. For execution purposes, the $394.88 level represents the immediate 15m support to watch.
The News Backdrop: Mixed Signals into Earnings
The fundamental backdrop for Microsoft Corporation stock is mixed, with analyst price target cuts balanced against enduring AI positioning conviction. Citi and Mizuho both cut their Microsoft price targets ahead of fiscal Q4 earnings, yet both firms maintained their bullish ratings. That split signal — trimmed targets but intact conviction — speaks to a market grappling with near-term uncertainty while preserving longer-term confidence in the AI spending narrative.
The $350 billion debt figure now circulating in financial media highlights a growing concern: capital spending is accelerating so rapidly that mega-cap technology companies are borrowing at scale. For Microsoft specifically, this context matters. Heavy investment cycles can compress near-term earnings optically, even when the long-term thesis remains intact. The July 29 earnings report becomes the clearest resolution mechanism for that ambiguity.
In contrast, Citi’s identification of Microsoft as one of the top AI vendors — anchored around Azure Quantum and its cloud infrastructure — underlines why the stock retains structural interest. The tension between high capex concerns and AI positioning dominance is precisely why the stock is described as looking cheap while simultaneously facing selling pressure.
Bullish Scenario: What Would Need to Happen
A bullish resolution requires MSFT to hold above the $393.66 daily pivot point and break cleanly through the $400–$401.34 zone defined by daily R1 and the upper Bollinger Band. A strong close above $401 on meaningful volume would shift the daily narrative toward genuine trend recovery. Positive earnings guidance on July 29 — particularly any upside surprise in Azure revenue or AI monetization — could serve as the fundamental catalyst to close the gap toward the EMA200 at $426.22.
On the hourly chart, continuation above $396.45 followed by a test of $399.99 would confirm that intraday momentum is building ahead of the event. The 15m regime is already bullish. A synchronized confirmation across all three timeframes would represent a meaningful shift in the near-term probability distribution.
Bearish Scenario: What Would Invalidate the Recovery
A daily close below the EMA20 at $387.35 — particularly on rising volume — would signal that the recent bounce has failed. The $388.37 daily S1 offers a first line of defense, but a breach there opens the path toward the $380 area and the Bollinger midline. If July 29 earnings disappoint on AI cloud growth or management commentary shifts tone on capex discipline, that scenario becomes more probable.
Notably, the EMA200 at $426.22 sits roughly 8% above current price. This gap is a reminder of how much technical damage has been done. Even in a bullish resolution, reclaiming that level requires sustained effort — not a single catalyst.
Positioning and the Road to July 29
Microsoft Corporation stock is in a neutral daily regime with constructive short-term momentum, making range-aware positioning the appropriate stance ahead of earnings. The immediate range is defined — $388 on the downside, $401 on the upside — and the stock appears content to compress within that band until the earnings catalyst forces a resolution. The elevated ATR confirms that volatility is not going away. Positioning ahead of July 29 carries binary risk, as analyst price target cuts and AI-driven optimism are competing narratives with real weight. The stock is not broken, but it has not yet proven it can reclaim its prior levels either. Caution and range awareness remain the appropriate stance.
FAQ
What is the most important level for Microsoft Corporation stock right now?
The daily EMA50 at $395.64 is the immediate battleground. A close above the $400–$401.34 resistance zone would shift the narrative toward recovery. A close below $387.35 would invalidate the bounce.
What does the MACD signal indicate about MSFT’s momentum?
The daily MACD line at -2.96 remains in negative territory, but the histogram at +2.99 shows bearish momentum is decelerating. This is an early-recovery signal, not confirmation of a new uptrend.
Why are analysts cutting Microsoft price targets while staying bullish?
Citi and Mizuho trimmed targets due to near-term uncertainty around accelerating capex spending. However, both firms maintain conviction in Microsoft’s AI positioning, particularly around Azure and cloud infrastructure.
When is the next major catalyst for MSFT?
July 29, when Microsoft reports fiscal Q4 earnings. The report is expected to resolve the current tension between capex concerns and AI-driven optimism.
Disclaimer: This article is for informational purposes only and does not constitute financial advice, an investment recommendation, or a solicitation to buy or sell any financial instrument or cryptocurrency. The analysis provided is not indicative of future results. Investing in crypto assets and financial markets carries a high risk of capital loss. Always do your own research (DYOR) and consult a qualified financial advisor before making any decision.
Article produced with the assistance of artificial intelligence and reviewed by the editorial team.








 English (US) ·