
 3 months ago
44
3 months ago
44

Microsoft Stock is coiling just below the 420 handle as buyers defend short-term trend support but face supply near the 200-day average. The daily bias is neutral with a modest constructive lean, while intraday structure tilts bullish yet tentative.
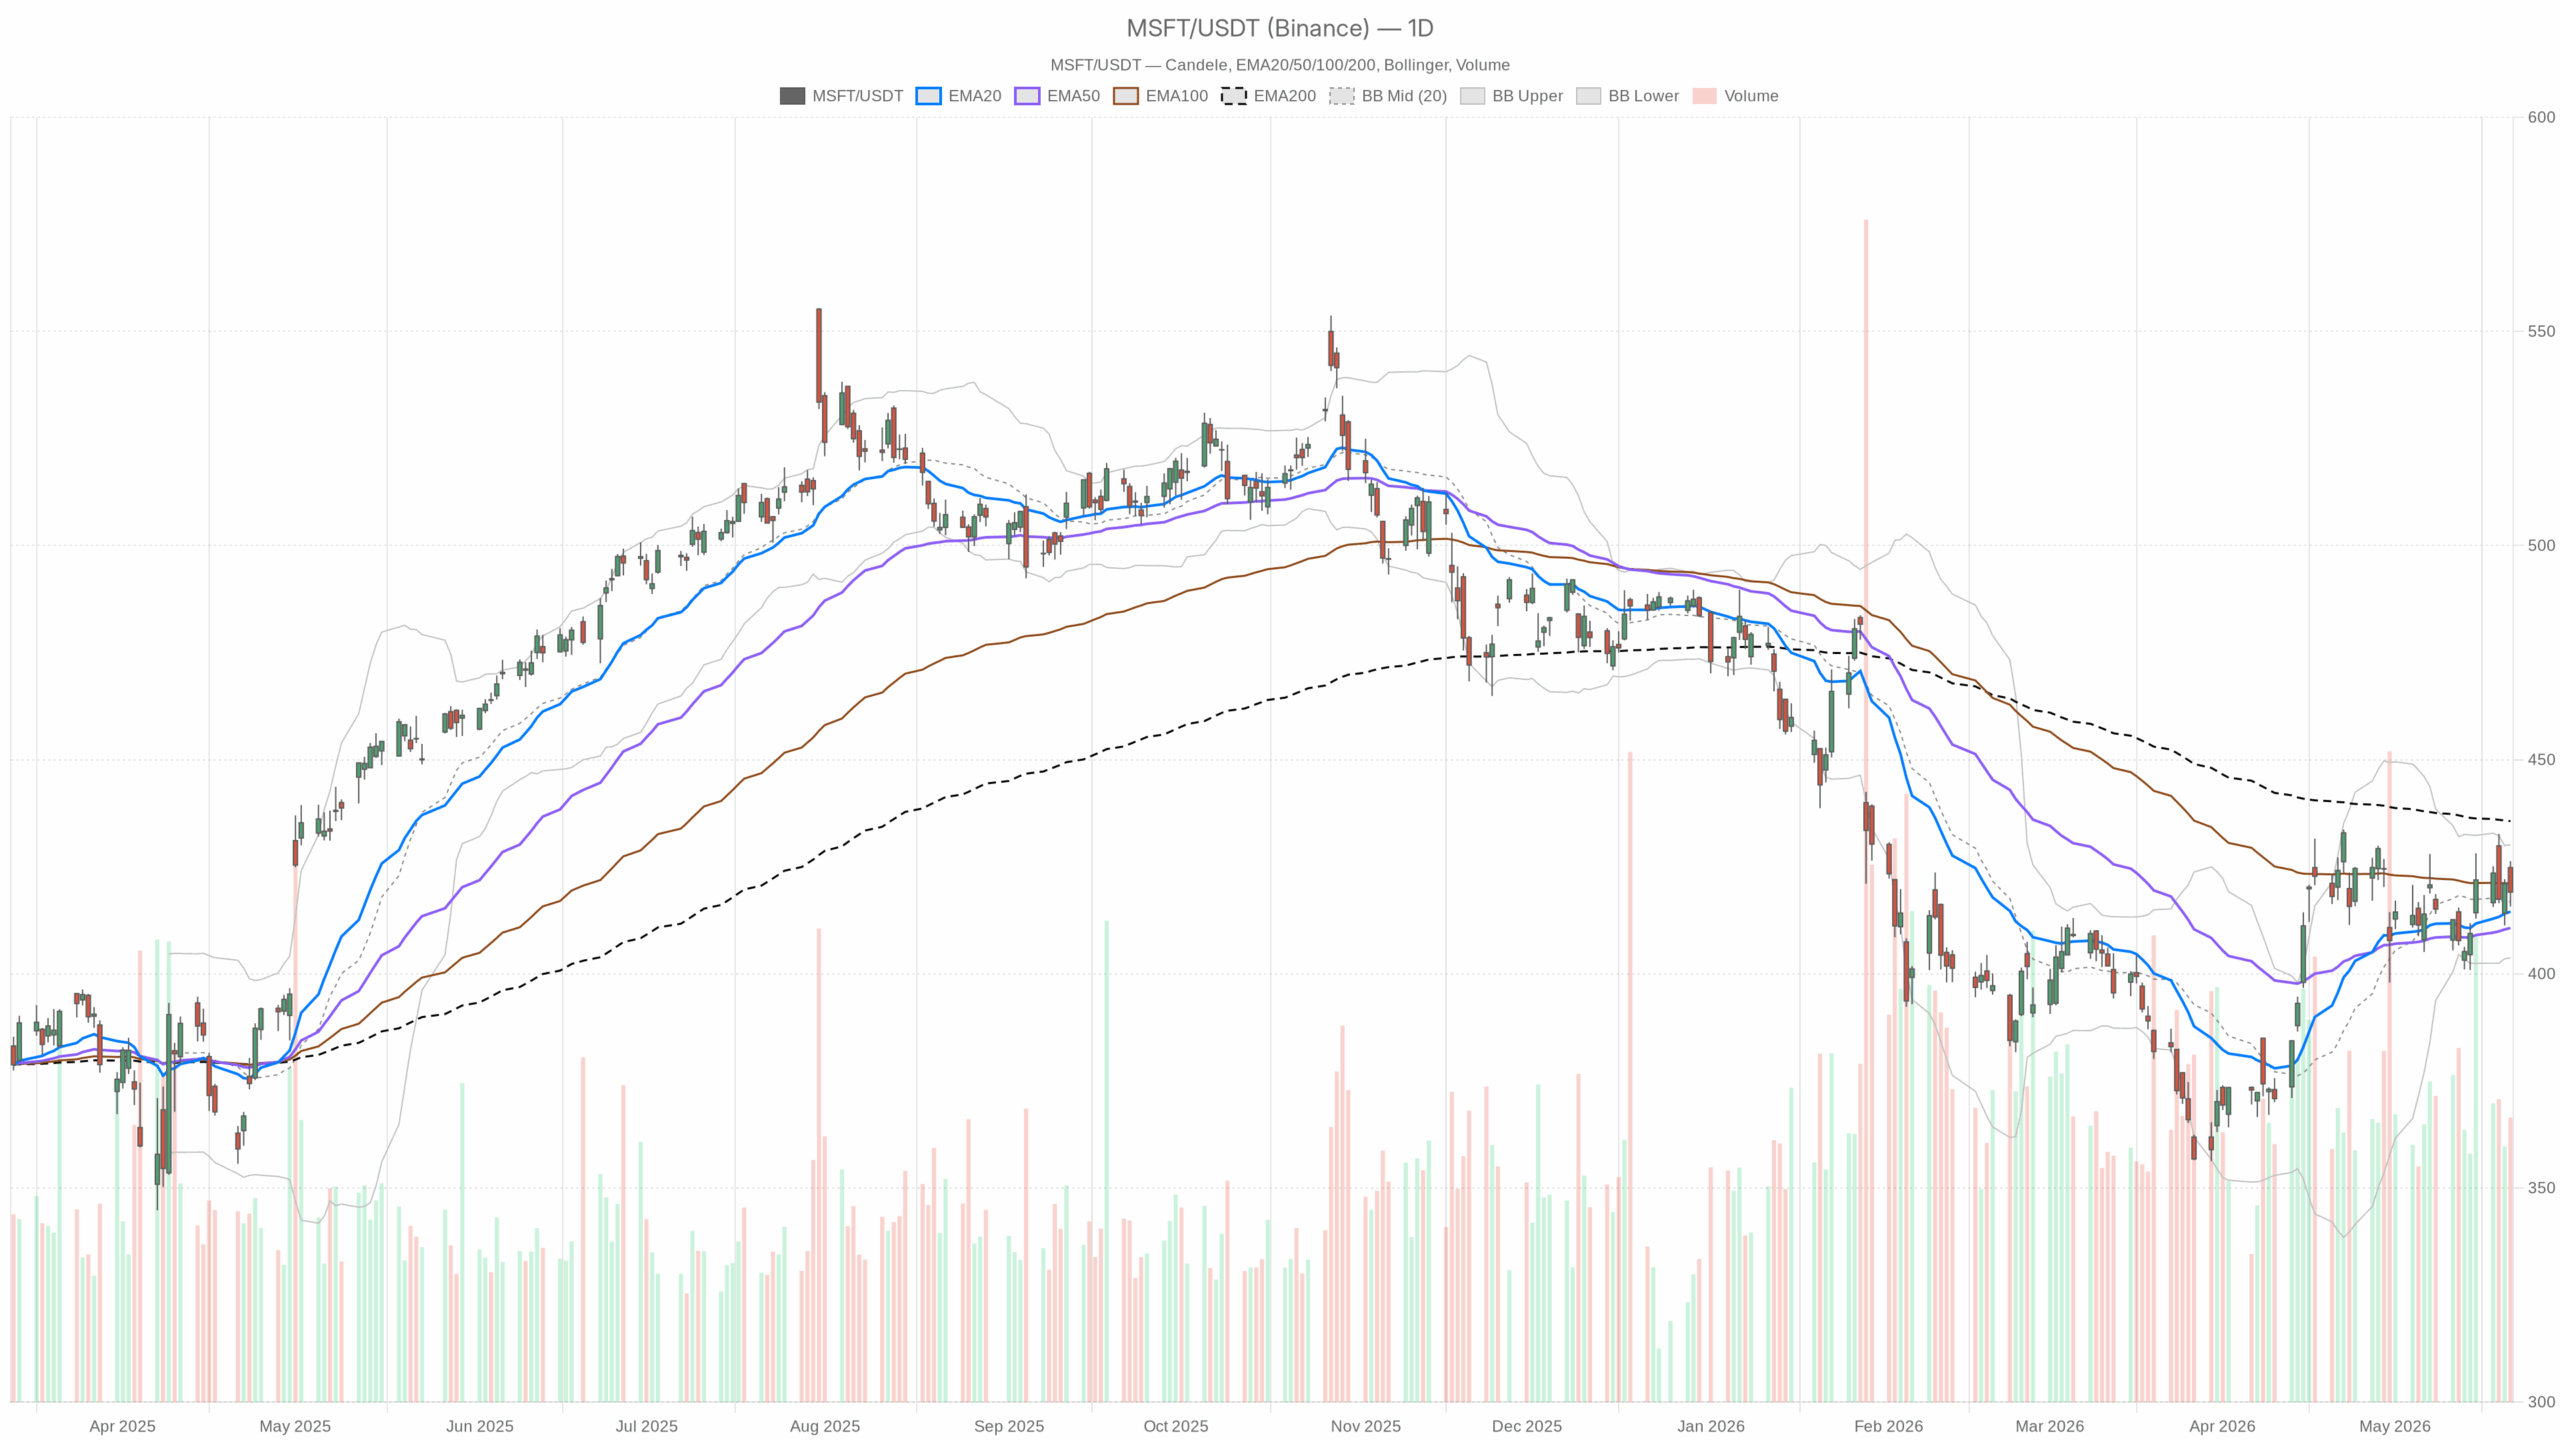 MSFT — daily chart with candlesticks, EMA20/EMA50 and volume.
Microsoft Stock Daily Technical Outlook
Structure and momentum
On the daily chart, price sits at 419.09, above the 20-day EMA 414.53 and the 50-day 410.71. That keeps the short-term uptrend intact. However, it remains below the 200-day EMA 435.65, so long-term trend resistance still dominates. RSI(14) 54.84 is mildly positive. Momentum is supportive but not forceful. The MACD line 3.91 vs signal 4.23 with a histogram of -0.32 shows a slight loss of thrust. Upside follow-through is tentative.
Volatility and range context
Bollinger Bands place the mid at 416.92 with the upper at 430.14 and the lower at 403.69. Price is in the upper half of the envelope, consistent with range trade. Meanwhile, ATR(14) 11.01 points to active daily ranges. Two-way risk remains alive.
Key daily levels
The daily pivot sits at 420.38, with R1 425.05 and S1 414.43. Therefore, 420 is the first battleground, while 414 is the first line of defense for Microsoft Stock.
Intraday 1H Outlook for Microsoft Stock
Trend and momentum
At the same time, the 1H setup leans constructive. Price at 419.04 sits above the 20-EMA 418.71 and 50-EMA 417.50, with the 200-EMA 411.01 trailing. Intraday trend support is intact. RSI(14) 51.51 is neutral-bullish, so buying pressure is present but moderate. MACD shows a small negative histogram of -0.17. Momentum is pausing rather than breaking.
Bands and swings
The 1H Bollinger mid is 418.50 with bands at 421.82 and 415.18. Price near the mid signals contained drift. Meanwhile, ATR(14) 3.32 reflects manageable hourly swings.
Intraday levels
The 1H pivot is 418.81 with R1 420.12 and S1 417.73. Notably, 418.8 is a working shelf, while 420 is the nearby ceiling.
15-Minute Execution Context
Micro-trend and momentum
The 15m view is flat to slightly firm, which fits an execution context more than a bias. EMA20 418.56 and EMA50 418.59 are nearly equal, while EMA200 417.12 trails. Short-term trend is balanced with a slight upside tilt. RSI(14) 53.54 is modestly positive. Intraday buyers have a small edge. The MACD histogram at 0.15 is green, and momentum is trying to turn up.
Immediate tape levels
The 15m Bollinger mid is 418.21 with the upper at 419.97 and the lower at 416.44. Price near the top band warns of a fade unless 420 breaks. Meanwhile, ATR(14) 1.36 signals a tight micro-range. The 15m pivot at 418.81, with R1 420.12 and S1 417.73, frames the immediate tape. Those levels mark near-term trigger points.
News and Sentiment Around Microsoft Stock
In contrast, the news flow remains mixed and keeps valuation debate front and center. Yahoo Finance highlights management’s claim that AI revenue run rate has reached $37 billion, up 123% year over year. Growth headlines are strong. However, Bloomberg calls Microsoft the market’s biggest drag as AI concerns weigh on the stock. Sentiment is conflicted. Seeking Alpha argues the case for a rerating after an Azure beat. Fundamental narratives support upside, yet positioning still respects overhead technical supply.
Trading Scenarios for Microsoft Stock
Bullish path
Therefore, the bullish path runs through 420 first, then 425. A close back above the daily pivot at 420.38 and the 1H R1 420.12 would tilt control to buyers. That would be confirmed by a positive daily MACD turn from the current negative histogram. Momentum would be re-accelerating. Next, a push toward the daily upper band at 430.14 becomes feasible, showing price acceptance in the upper envelope. A sustained challenge of the 200-day EMA 435.65 would be the bigger prize. Clearing it would mark a trend inflection.
Bearish case
However, the bearish case builds if 420 continues to cap and intraday support slips. A break below the 1H S1 417.73 and the pivot at 418.81 would hand back the initiative. Sellers would regain near-term control. On the daily, a loss of S1 414.43 alongside the 20-day EMA 414.53 would be more damaging, shifting the short-term trend to the downside. The next magnets sit near the 50-day EMA 410.71 and the lower Bollinger Band at 403.69, reflecting expanding volatility to the downside.
Bottom Line and Risk Context
Overall, the daily bias is neutral with a constructive lean, and the 1H is modestly bullish. The 15m is execution-only and balanced. Consequently, positioning likely stays light and tactical into 414–425 until a catalyst breaks the stalemate. Watch the daily pivot at 420.38 for confirmation, and respect the 200-day 435.65 as the key overhang. Volatility is active but not extreme, so whipsaws around these levels are a risk for Microsoft Stock.





 English (US) ·