
 3 months ago
41
3 months ago
41

Markets are digesting a sharp recent spike, with Bitcoin price hovering near key psychological levels while traders reassess risk and positioning.
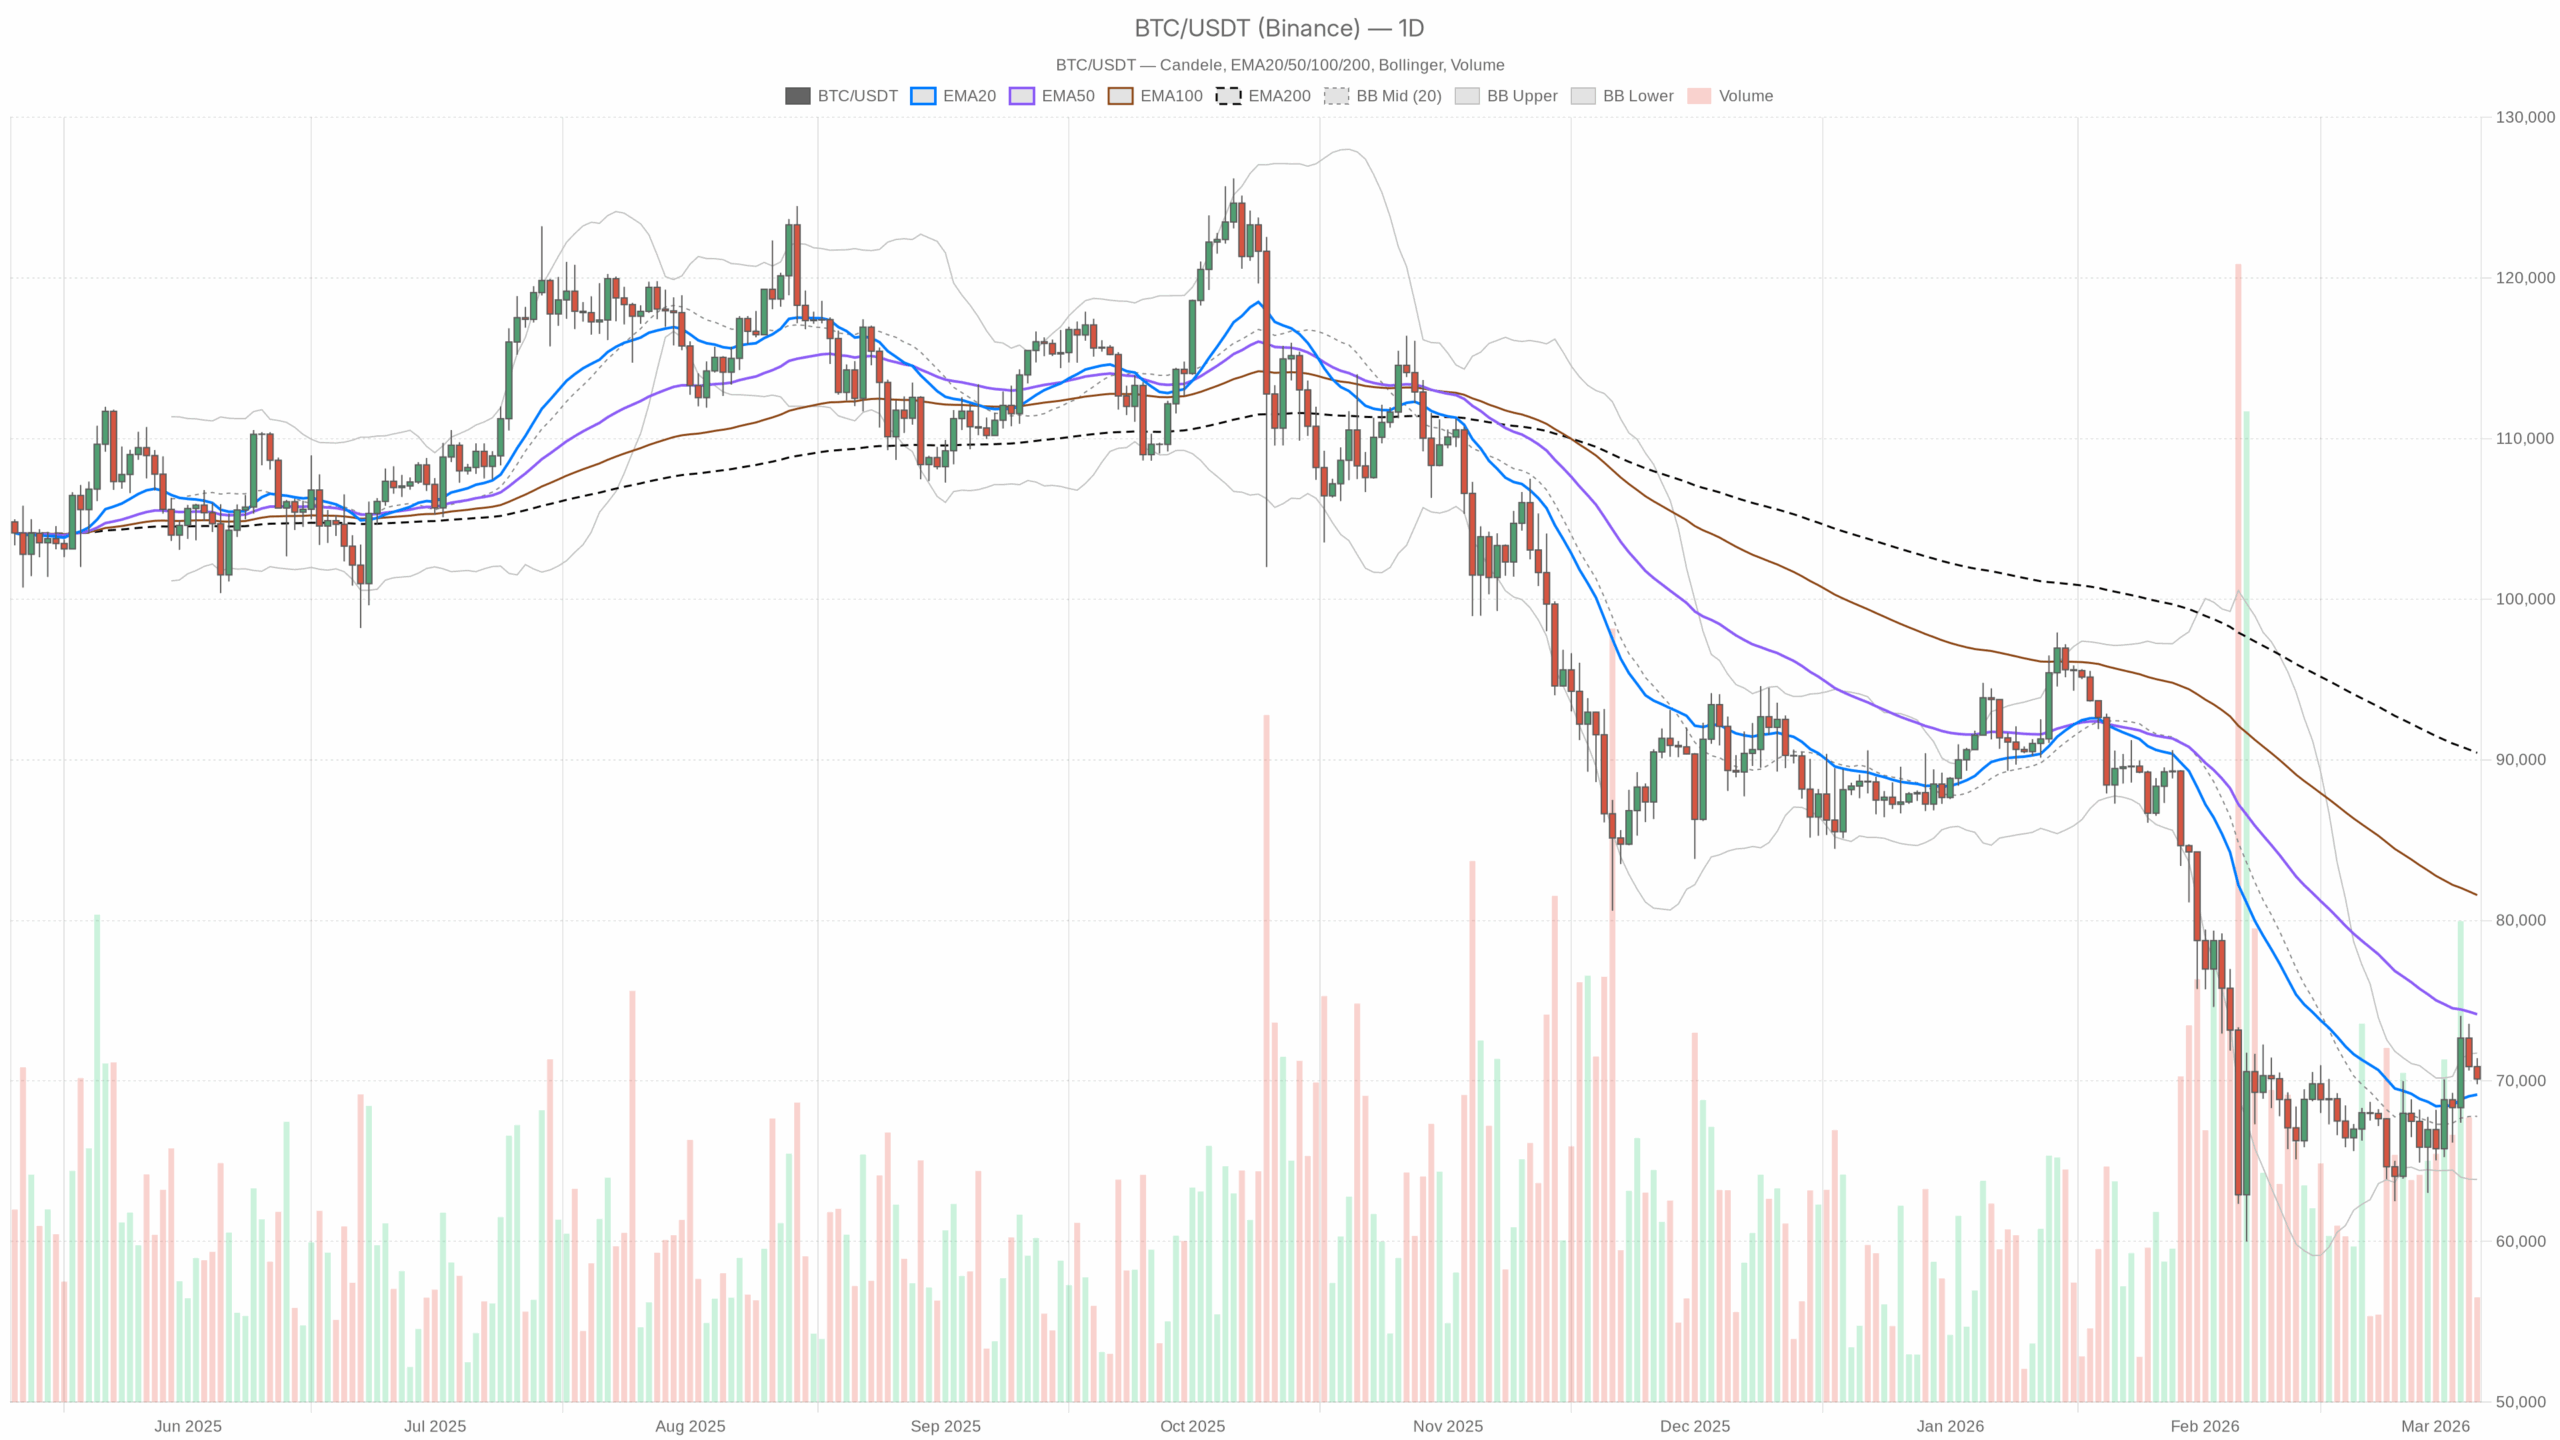 BTC/USDT — daily chart with candlesticks, EMA20/EMA50 and volume.
Bitcoin price at a crossroads: digestion after the spike
Bitcoin price is hovering around $70,000 after an 8% upside burst above $73,000 and a subsequent pullback. The broader crypto market cap is down about 3.4% over 24 hours, BTC dominance is high at ~57%, and sentiment has flipped to Extreme Fear (18) even though price is still near the highs.
That mix – elevated price, fearful sentiment, and softening momentum – shows where we really are: not in full risk-on euphoria, but in a nervous consolidation where traders are questioning whether the latest push above $70K was sustainable.
Options desks, according to recent Bloomberg coverage, remain cautious despite the rebound toward $74K. Moreover, the dominant force right now is positioning and risk management rather than aggressive trend-chasing. Bulls are trying to defend the $70K area, but they are no longer in full control on intraday timeframes.
My base case from the daily chart is a neutral-to-slightly-bullish consolidation: BTC is holding above key medium-term support, but shorter-term momentum has rolled over. That keeps both a continuation leg toward the highs and a deeper mean-reversion pullback firmly on the table.
Daily chart (D1): structure still constructive, but no clean trend
Bias from D1: Neutral with mild bullish tilt
Price vs EMAs
– Daily close: $70,119.89
– EMA 20: $69,148
– EMA 50: $74,147.66
– EMA 200: $90,428.94
Price is trading above the 20-day EMA but below the 50-day EMA, with the 200-day way above current levels, likely reflecting prior extreme highs.
What this implies: Short-term trend support holds above the 20-day, but the medium-term trendline, the 50-day, is still acting as resistance overhead. That is a textbook consolidation after a sharp move: the market is no longer in a clean uptrend, but it has not broken down either. Bulls can claim control as long as BTC holds above the 20-day EMA; bears only start to build a real case on a sustained break below that.
RSI (14-day): 50.04
RSI is almost pinned at 50, the pure middle of the range.
What this implies: There is no directional momentum edge on the daily chart. The market is neither overbought nor oversold; it is in balance. That supports the idea that we are in a digestion phase where the next leg will be driven more by break levels than by stretched conditions.
MACD (daily)
– MACD line: -1080.54
– Signal line: -2195.58
– Histogram: +1115.04
The MACD line is below zero but has crossed above the signal line, giving a positive histogram.
What this implies: Medium-term momentum has turned up from a weak patch, but from below the zero line. In practice, that is a recovery inside a consolidation, not a roaring uptrend signal. It tells you downside momentum is fading, but buyers have not yet flipped the larger structure into clear trend mode.
Bollinger Bands (daily)
– Middle band (20-day basis): $67,799.36
– Upper band: $71,732.92
– Lower band: $63,865.81
– Price: $70,119.89
BTC is trading above the middle band but below the upper band.
What this implies: Price is sitting in the upper half of the recent volatility envelope but not pressing the extremes. The prior expansion has cooled; we are not in a fresh squeeze or breakout right now. It is consistent with a range or slow grind higher rather than a blow-off or a collapse.
ATR (14-day): 3,376.37
ATR is elevated, roughly 4.8% of current price.
What this implies: Daily ranges remain wide. Position sizing matters here, since a normal day can easily swing $3–4K. Any breakout, up or down, through key levels is likely to be fast and volatile, not a gentle drift.
Daily pivot levels
– Pivot (PP): $70,444.57
– Resistance 1 (R1): $71,095.30
– Support 1 (S1): $69,469.16
Price at about $70,120 is slightly below the daily pivot, and still above S1.
What this implies: Intraday, the market is leaning a bit to the cautious side below PP, but it has not pushed into downside extension below S1. Day traders will watch $70,450 as the intraday line in the sand: above it, bull side scalps are favoured; below it, rallies may be sold.
1-hour chart (H1): momentum cooling, early mean reversion tone
Bias from H1: Short-term bearish / corrective
Price vs EMAs
– H1 close: $70,100.01
– EMA 20: $70,901.07
– EMA 50: $70,979.86
– EMA 200: $68,994.29
Price is below both the 20-hour and 50-hour EMAs, but still above the 200-hour EMA.
What this implies: Intraday momentum has shifted against the bulls: the recent jump is being unwound. However, the broader hourly trend, anchored by the 200-hour, is still intact. This is what a pullback inside an up-biased structure looks like. If price starts living below the 200-hour, the tone shifts from healthy correction to possible trend break.
RSI (14-hour): 35.78
RSI is in the low-to-mid 30s, but not at extreme oversold.
What this implies: Selling pressure dominates on the intraday timeframe, but it is not at panic levels. There is room for one more push lower before dip-buyers are naturally attracted, or for a quick relief bounce if shorts get crowded.
MACD (H1)
– MACD line: -365.93
– Signal line: -300.52
– Histogram: -65.41
Both lines are below zero, with the MACD line under the signal, giving a negative histogram.
What this implies: Short-term momentum is bearish. The push off the highs has real follow-through on the hourly chart. It is not yet showing a clean bullish cross or positive divergence, so timing a reversal here is early.
Bollinger Bands (H1)
– Middle band: $70,828.42
– Upper band: $71,505.37
– Lower band: $70,151.47
– Price: $70,100.01
Price is sitting slightly below the lower band.
What this implies: Intraday, BTC is hugging or even slipping under the lower band, which often coincides with a short-term overshoot to the downside. It does not guarantee a bounce, but it shows the current selling leg is stretched relative to recent hourly volatility. Chasing fresh shorts down here carries more whipsaw risk.
ATR (14-hour): 512.14
What this implies: Normal hourly swings of about $500 are on the table. For intraday traders, that is meaningful: stops placed too tight relative to this volatility are likely to get triggered by noise.
Hourly pivot levels
– Pivot (PP): $70,039.56
– Resistance 1 (R1): $70,285.29
– Support 1 (S1): $69,854.29
Price at around $70,100 is just above the hourly pivot, between PP and R1.
What this implies: The market is trying to stabilise around a fair-value zone on the hourly chart. Below $69,850–$69,900, the sellers regain the upper hand. Reclaiming and holding above $70,300–$70,400 intraday would be an early sign that the pullback is fading.
15-minute chart (M15): execution context, short-term pressure
Bias from M15: Bearish / corrective
Price vs EMAs
– M15 close: $70,111.54
– EMA 20: $70,492.09
– EMA 50: $70,742.81
– EMA 200: $70,945.21
Price is trading below all three intraday EMAs.
What this implies: Very short-term structure is heavy. Rallies into the 20/50 EMA band on the 15-minute chart are likely to attract sellers unless we see a decisive reclaim.
RSI (14, M15): 36.98
What this implies: Short-term RSI is weak but not capitulated, echoing the H1 picture: this is more of an orderly unwind than a panic flush.
MACD (M15)
– MACD line: -162.65
– Signal line: -104.47
– Histogram: -58.18
What this implies: Momentum on the execution timeframe is still pointing down. There is no clear intrabar reversal signature yet; scalpers are leaning short into bounces.
Bollinger Bands (M15)
– Middle band: $70,605.51
– Upper band: $71,201.42
– Lower band: $70,009.59
– Price: $70,111.54
Price is near the lower band on M15.
What this implies: Similar to the hourly picture, the current leg is stretched at the very short-term level but not breaking down into a trend cascade. Traders can expect choppy price action around the band edge, where fake breakdowns and sharp snaps back are common.
ATR (14, M15): 229.12
What this implies: A single 15-minute candle can easily cover $200–$250. Intraday entries need breathing room; tiny stops will be noise fodder.
15-minute pivot levels
– Pivot (PP): $70,075.25
– Resistance 1 (R1): $70,232.15
– Support 1 (S1): $69,954.64
Price at about $70,112 is just above PP on this micro-timeframe.
What this implies: Micro-flow is neutral-to-slight-positive right now, but any slip under $69,950–$70,000 will quickly put pressure back on intraday longs.
Sentiment, market context, and positioning
– Fear & Greed Index: 18 (Extreme Fear)
– Total crypto market cap: about $2.46T, down roughly 3.36% in 24 hours
– BTC dominance: about 56.9%
The key disconnect is clear: price is relatively high, but sentiment is extremely fearful. That is usually not what you see at macro tops, which are often characterised by greed, FOMO, and stretched leverage. Instead, this looks more like a late shakeout than euphoria.
In practice, we are probably seeing late longs shaken out by volatility, options traders hedging aggressively after the spike to $74K, and a flight to BTC within crypto, with high dominance, while the broader alt market stays fragile.
For directional traders, that combination tends to favour a buy-the-dip bias on higher timeframes, provided structural support zones hold and volatility does not trigger forced liquidations at key levels.
Bullish scenario for Bitcoin price
Thesis: The current pullback is a controlled, sentiment-driven shakeout that resets intraday indicators while the daily structure quietly prepares for another leg higher in Bitcoin price.
Technical backing:
- D1 price holding above the 20-day EMA (about $69,150) with RSI around 50 and a positive MACD histogram argues against an immediate larger breakdown.
- BTC is trading in the upper half of the daily Bollinger Band range and above the daily mid-band, around $67,800, consistent with consolidation near the top of the range, not a rejection from it.
- Intraday H1 and M15 are weak but not broken: price is still above the 200-hour EMA (around $69,000), framing this move as a pullback rather than a structural trend reversal.
- Extreme Fear at these price levels hints at under-positioned bulls and room for a squeeze if resistance starts giving way.
What bulls need to see next:
- Hold the $69,000–$69,500 support zone, near daily S1 and above the 200-hour EMA. Wicks below are fine; sustained closes below are not.
- On intraday charts, reclaim and hold above $70,800–$71,000, which is the H1 middle band and EMA cluster, near daily R1, to flip the short-term momentum back up.
- A daily close back above the 50-day EMA, around $74,150, would convert this into a clear continuation pattern and open the door toward the prior highs and potentially new peaks.
Upside roadmap if confirmed:
- First target: $72,000–$72,500, recent congestion and just under the daily upper band.
- Next: retest and potentially break the recent spike zone around $73,000–$74,000.
- If momentum and volume expand, extension toward the mid-$70Ks is plausible, but that would require broader risk-on appetite returning, not just a local short squeeze.
What invalidates the bullish case?
- A daily close below the 20-day EMA, around $69,150, followed by sustained trading under $69,000.
- H1 price establishing acceptance under the 200-hour EMA, near $69,000, with RSI remaining heavy, flipping the intraday structure from pullback to downtrend.
- In that scenario, the bias shifts from buy the dip to respecting the risk of a deeper correction.
Bearish scenario for Bitcoin price
Thesis: The bounce to $73K–$74K was a distribution rally in a weakening macro crypto environment; BTC is now rolling over, with intraday weakness as the first sign of a larger mean-reversion move.
Technical backing:
- D1 shows price below the 50-day EMA, around $74,150, which can act as a medium-term ceiling if bulls fail to reclaim it.
- The hourly and 15-minute charts show a coherent bearish structure: price below the 20 and 50 EMAs, negative MACD, soft RSI, and price flirting with or under the lower Bollinger Bands.
- Total crypto market cap is down over 3%, with volumes roughly one-third lower over 24 hours, a classic risk-off cool-down that can morph into a broader de-risking if support breaks.
What bears need to see next:
- Clean break below $69,000, turning the 200-hour EMA from support into resistance.
- Follow-through toward the daily mid-Bollinger, around $67,800. A firm daily close under this level would show that the range has tilted downward.
- If selling accelerates, watch for a test of the $65,000–$66,000 area, where prior demand likely sits and where the lower daily band, near $63,800, starts to come into play.
Downside roadmap if confirmed:
- Initial support: $69,000–$69,500.
- Next pocket: $67,500–$68,000, daily mid-band and local structure.
- Deeper correction zone: $64,000–$66,000, in line with the lower portion of the daily volatility envelope.
What invalidates the bearish case?
- A strong reclaim of $71,000+ on H1 with MACD crossing back up and RSI recovering toward 55–60.
- A daily close back above the 50-day EMA, near $74,150, turning what looked like distribution into a successful breakout retest.
- In that situation, shorts caught leaning into the pullback would be fuel for a squeeze higher.
How to think about positioning from here
The daily chart says range with a slight bullish bias; the hourly and 15-minute charts say short-term correction in progress. Those are not contradictory views, they are two layers of the same story.
If you trade higher timeframes, the key battleground is $69,000–$69,500. As long as BTC holds that zone on a closing basis, the structural bull case remains alive, and pullbacks are simply the cost of staying in the trend.
If you trade intraday, the immediate game is about whether BTC can reclaim the $70,800–$71,000 region or whether rallies into that band keep getting sold. Expect whippy behaviour near $70K given the elevated ATR on all timeframes and the fragile sentiment backdrop.
Volatility is high, sentiment is fearful, and the market is sitting right on a psychologically loaded level at $70K. That is exactly where over-sized, over-levered positions tend to get punished and where risk management matters most.
In this environment, the edge does not come from guessing whether the next $5K move is up or down, but from respecting the big levels that matter, aligning trades with the timeframe you actually manage, and allowing for the kind of intraday swings that the current ATR numbers make very likely.
BTC is not in a clean, one-sided trend right now. It is in a tug of war between macro bulls holding higher-timeframe support and short-term traders leaning into the pullback. The resolution of that fight around $69K–$71K will set the tone for the next major move in Bitcoin price.


 English (US) ·