
 8 hours ago
13
8 hours ago
13

SpaceX stock (SPCX) remains structurally bullish near $185, but short-term cracks are surfacing. An ESG rating downgrade from MSCI and a sharp valuation critique from Morningstar are injecting uncertainty into an otherwise clean daily uptrend.
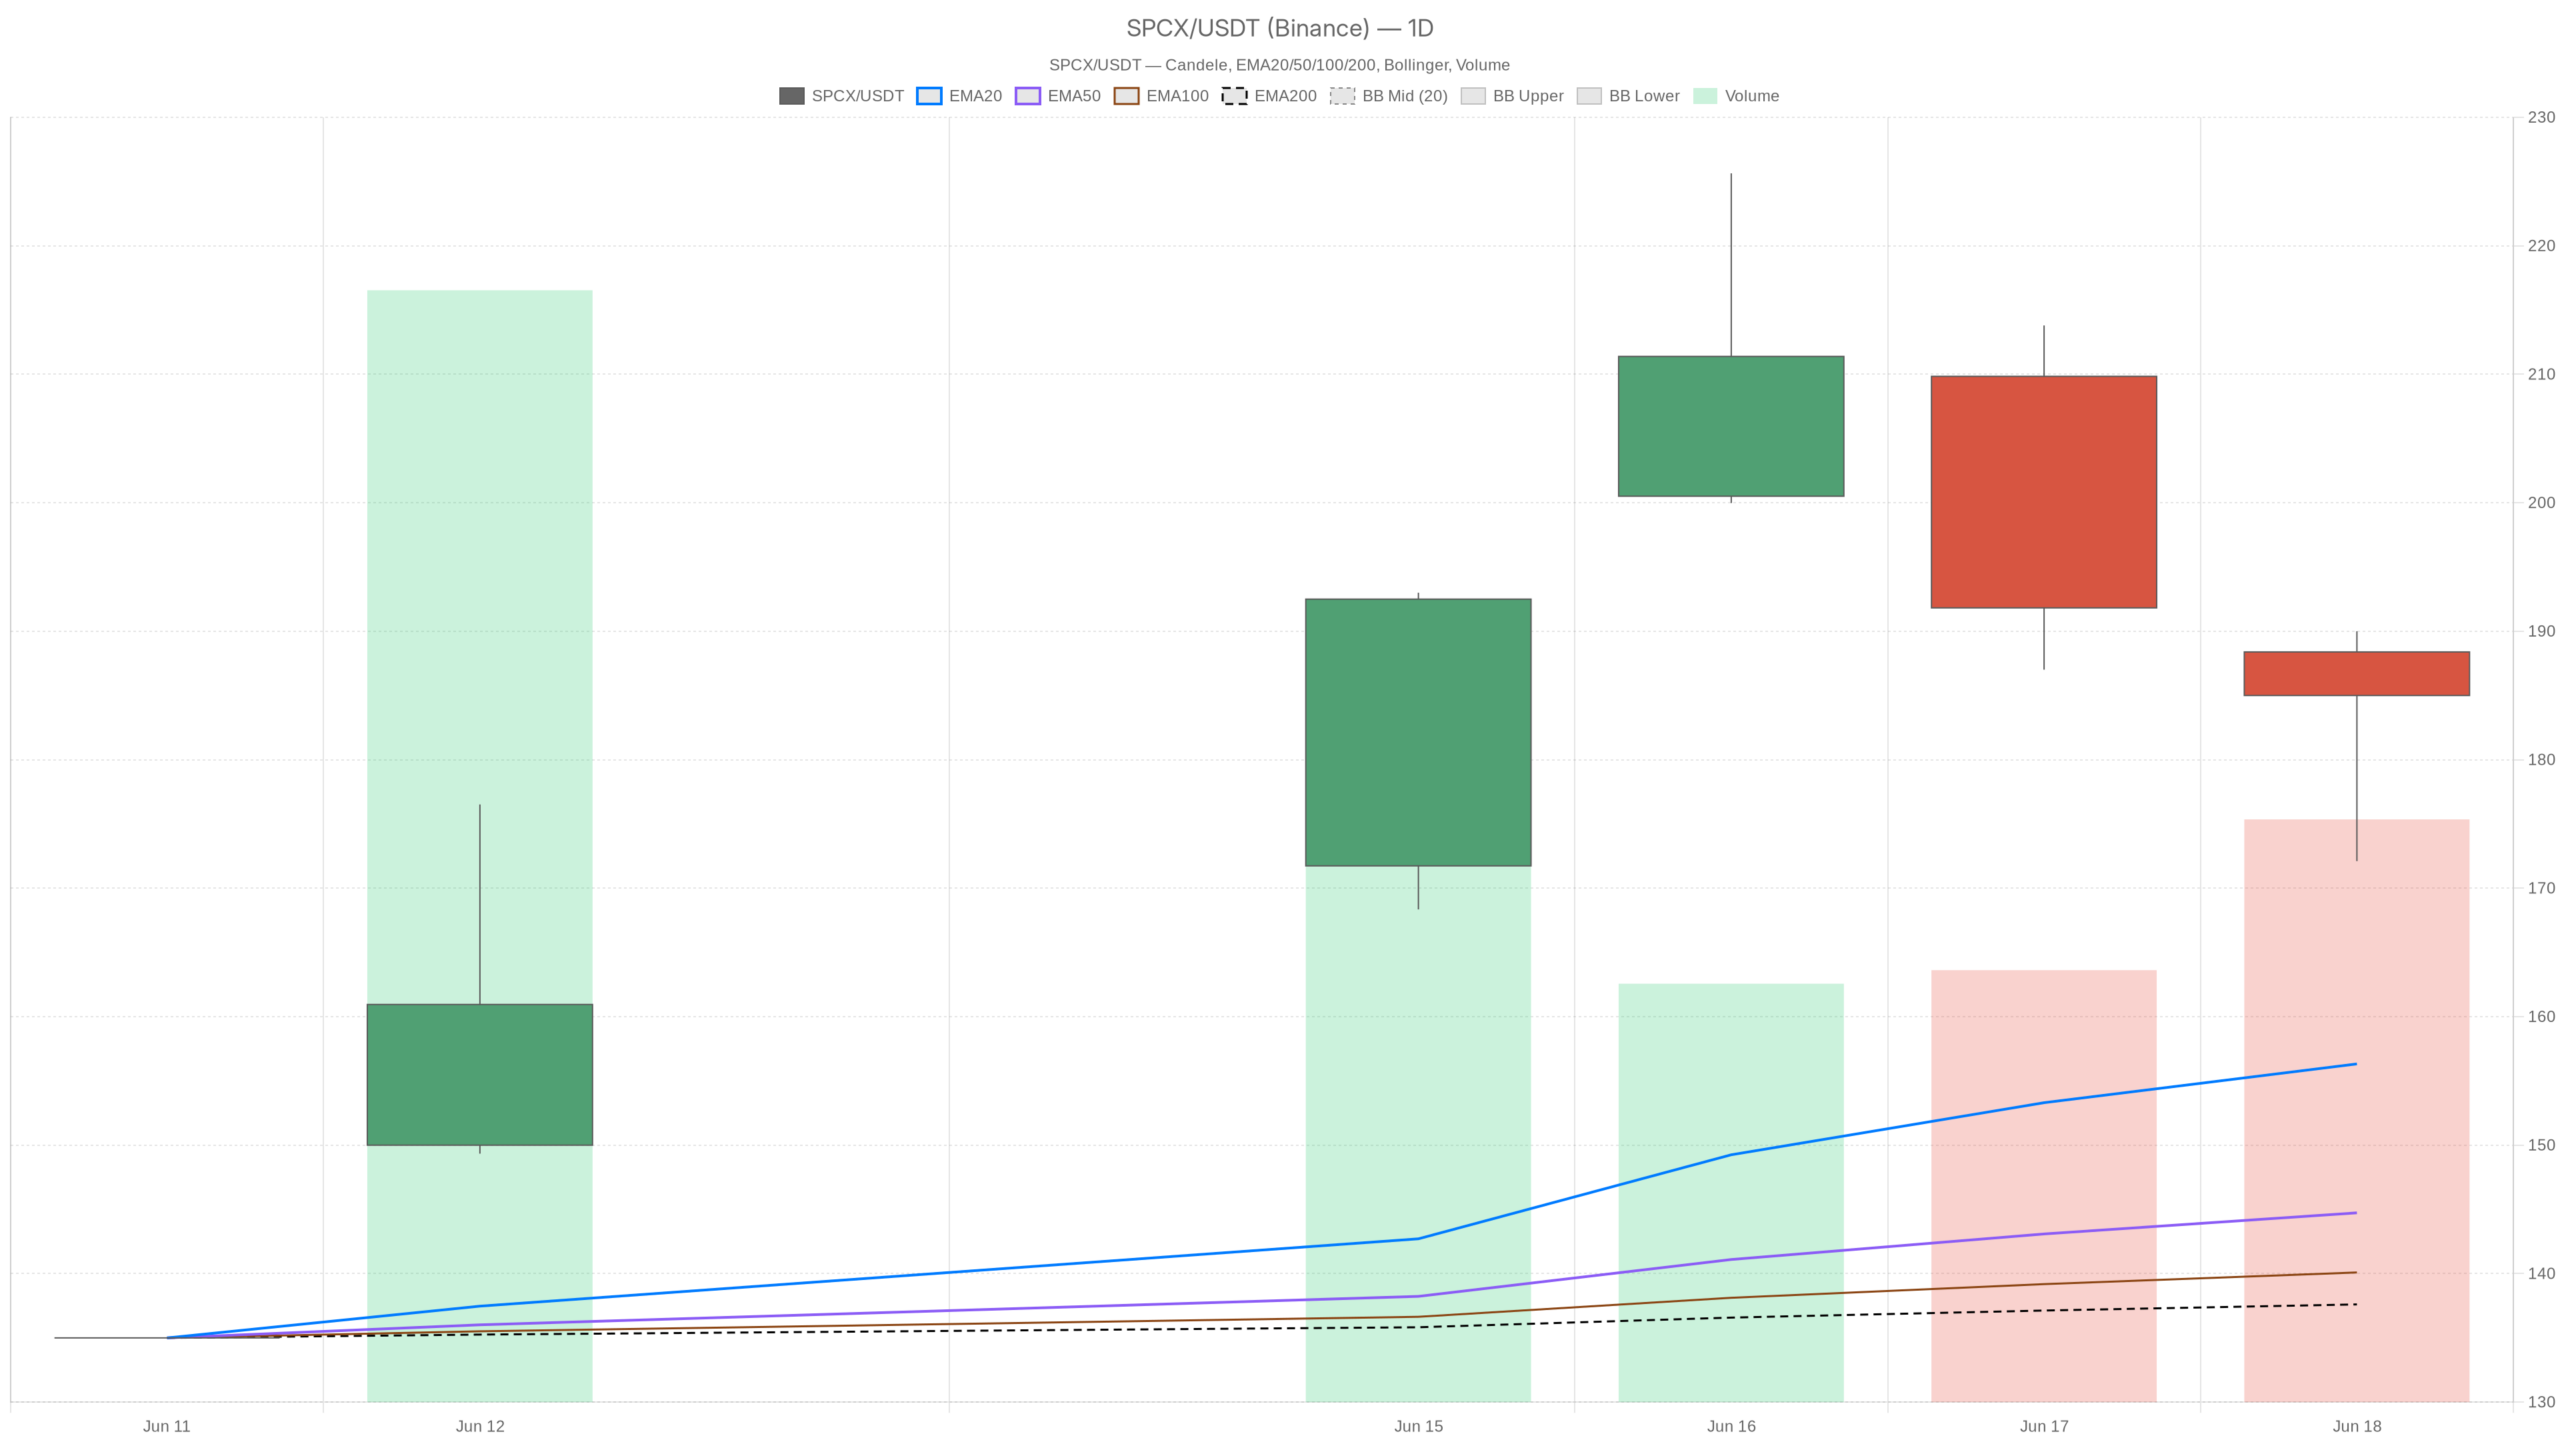 SPCX — daily chart with candlesticks, EMA20/EMA50 and volume.
Key takeaways
- SPCX trades around $185, well above its rising daily EMA stack of EMA20 ($156.33), EMA50 ($144.73), and EMA200 ($137.61)
- Daily MACD at 13.66 confirms expanding bullish momentum with a histogram of 6.69
- Hourly MACD has turned bearish, creating a clear conflict with the daily timeframe
- MSCI assigned SpaceX its lowest ESG rating, while Morningstar suggests the stock could be worth less than half its current valuation
- Intraday ATR of $7.93 signals elevated volatility that demands trader caution
SpaceX Stock Daily Trend: Structurally Bullish
SPCX’s daily trend is firmly bullish, backed by a rising EMA stack and expanding momentum. All three exponential moving averages point higher. That configuration signals sustained buying pressure since the IPO.
The daily EMA20 sits at $156.33, the EMA50 at $144.73, and the EMA200 at $137.61. Price trades roughly $30 above the long-term EMA200. That buffer reflects genuine conviction from market participants. Meanwhile, the daily MACD reinforces the bullish case. The line reads 13.66, well above the signal at 6.97. A histogram of 6.69 confirms momentum is still expanding.
Daily Pivot Levels Define Key Boundaries
The daily pivot point sits at $182.37. SPCX closed at $185 — just above that level, which is a mild positive. Resistance at R1 is pegged at $192.63. Support below lies at $174.74. In short, that gap implies roughly $10 of downside before the structure is challenged.
Short-Term Cracks Emerge on the Hourly Chart
The hourly chart reveals genuine cracks in SPCX’s bullish structure. The stock now trades below its hourly EMA20 of $186.66, and the MACD has turned negative. This creates a signal conflict with the daily trend — not a minor technicality.
The hourly MACD line sits at -1.00, with the signal at 1.48. A histogram of -2.48 marks a clear bearish crossover. The hourly regime is classified as neutral, not bullish. Therefore, this divergence warns against assuming the daily trend will assert itself immediately.
Bollinger Bands on the 1-hour chart show the midline at $194.20, well above current price. SPCX is positioned in the lower half of its recent intraday range. Meanwhile, the ATR stands at $7.93 — meaningful volatility for a single session. Traders should treat intraday swings of that magnitude as entirely normal.
15-Minute Chart: Selling Pressure Fading
On the 15-minute chart, the picture is marginally more constructive. RSI reads 55.27 — neutral but leaning higher. However, the MACD histogram has turned positive at 1.65, even though the line itself remains negative at -0.74. This hints that short-term selling pressure is fading. However, price is pressing against the upper Bollinger Band at $185.98, which could act as near-term resistance. The 15-minute regime remains neutral, consistent with the hourly view.
Fundamental Headwinds Challenge SpaceX Stock
Two fresh fundamental developments are weighing on SpaceX stock. The news flow now pulls in opposing directions, complicating the technical picture. MSCI’s ESG downgrade and Morningstar’s valuation critique are the key drivers.
On the bearish side, MSCI has assigned SpaceX its lowest ESG rating, triggering an overnight slide. Musk dismissed the rating — echoing his 2022 response when Tesla was dropped from the S&P 500 ESG Index. This may limit institutional damage in the short run. Still, it reduces the universe of ESG-constrained buyers.
More significantly, Morningstar has published a valuation note suggesting SPCX could be worth less than half its current $2.44 trillion market cap. That is not a minor quibble. When a credible research firm targets a discount exceeding 50%, it gives pause to anyone deploying fresh capital at these levels.
At the same time, SPCX has risen 40% since its IPO at $1.75 trillion. That trajectory reflects genuine market conviction. The founder-alignment argument also remains intact. Every $1 move in SPCX shifts Musk’s wealth by $4.76 billion, according to recent reports. Notably, debate about 12-month price direction tends to emerge most actively near price discovery phases following a major IPO.
SpaceX Stock: Bull and Bear Scenarios
SPCX faces two competing scenarios, and the next few sessions will likely determine which one prevails. Both paths are technically valid given the current conflicting signals.
Bullish Scenario
The bullish path rests on SPCX reclaiming the $186–$187 zone on the hourly chart. Specifically, price must close back above the hourly EMA20 and neutralize the MACD bearish crossover. A sustained move toward daily R1 at $192.63 would then confirm that the daily trend is driving price action. Still, the structural EMA stack on the daily timeframe gives bulls a robust foundation.
Bearish Scenario
In contrast, the bearish case unfolds if selling pressure extends below hourly pivot support at $181.27. A break there opens a path toward daily S1 at $174.74. The Morningstar valuation concern looms larger in that context. If institutional sellers begin acting on the overvaluation thesis, the daily trend may not provide enough near-term cushion. The implied premium is simply too large to ignore.
Outlook: Pivotal Sessions Ahead
Overall, SpaceX stock remains structurally bullish on the daily timeframe. However, the short-term signals are clearly softening. The hourly MACD bearish crossover and neutral regime warn against complacency. Elevated volatility — with an hourly ATR near $8 — demands respect from both sides. Positioning aggressively in either direction requires clarity that the market has not yet provided. The coming sessions will determine whether the daily trend resumes cleanly, or whether ESG and valuation headwinds force a more meaningful consolidation.
FAQ
Is SpaceX stock still in a bullish trend?
Yes, on the daily timeframe, SPCX remains structurally bullish. All three daily EMAs are rising in a stack, and the daily MACD shows expanding momentum. Price trades roughly $30 above the EMA200, reflecting sustained buying pressure since the IPO.
What is causing the short-term weakness in SPCX?
Two factors are driving near-term uncertainty. First, MSCI assigned SpaceX its lowest ESG rating, which may deter ESG-constrained institutional buyers. Second, Morningstar published a valuation note suggesting SPCX could be worth less than half its current market cap. On the technical side, the hourly MACD has turned bearish, creating a genuine signal conflict.
What are the key levels to watch for SpaceX stock?
On the upside, bulls need to reclaim the $186–$187 zone and push toward daily R1 at $192.63. On the downside, hourly pivot support sits at $181.27. A break below that level opens a path to daily S1 at $174.74.
What is the intraday volatility outlook for SPCX?
The hourly ATR stands at $7.93, signaling elevated volatility. Intraday swings of roughly $8 should be considered normal. Traders should size positions accordingly and avoid overcommitting in either direction until clearer signals emerge.
Disclaimer: This article is for informational purposes only and does not constitute financial advice, an investment recommendation, or a solicitation to buy or sell any financial instrument or cryptocurrency. The analysis provided is not indicative of future results. Investing in crypto assets and financial markets carries a high risk of capital loss. Always do your own research (DYOR) and consult a qualified financial advisor before making any decision.
Article produced with the assistance of artificial intelligence and reviewed by the editorial team.


 English (US) ·