
 12 hours ago
21
12 hours ago
21

Nebius Stock (NASDAQ: NBIS) has staged one of the more remarkable runs in the AI infrastructure space this year. However, as of June 2, that momentum is visibly stalling at elevated levels. The daily chart remains structurally bullish, with price trading well above major moving averages, but the intraday picture signals growing short-term caution. NBIS closed near the low of its daily range while momentum rolls over on shorter timeframes, with Wall Street analysts divided on valuation. This market stands at a crossroads rather than on a clear continuation path.
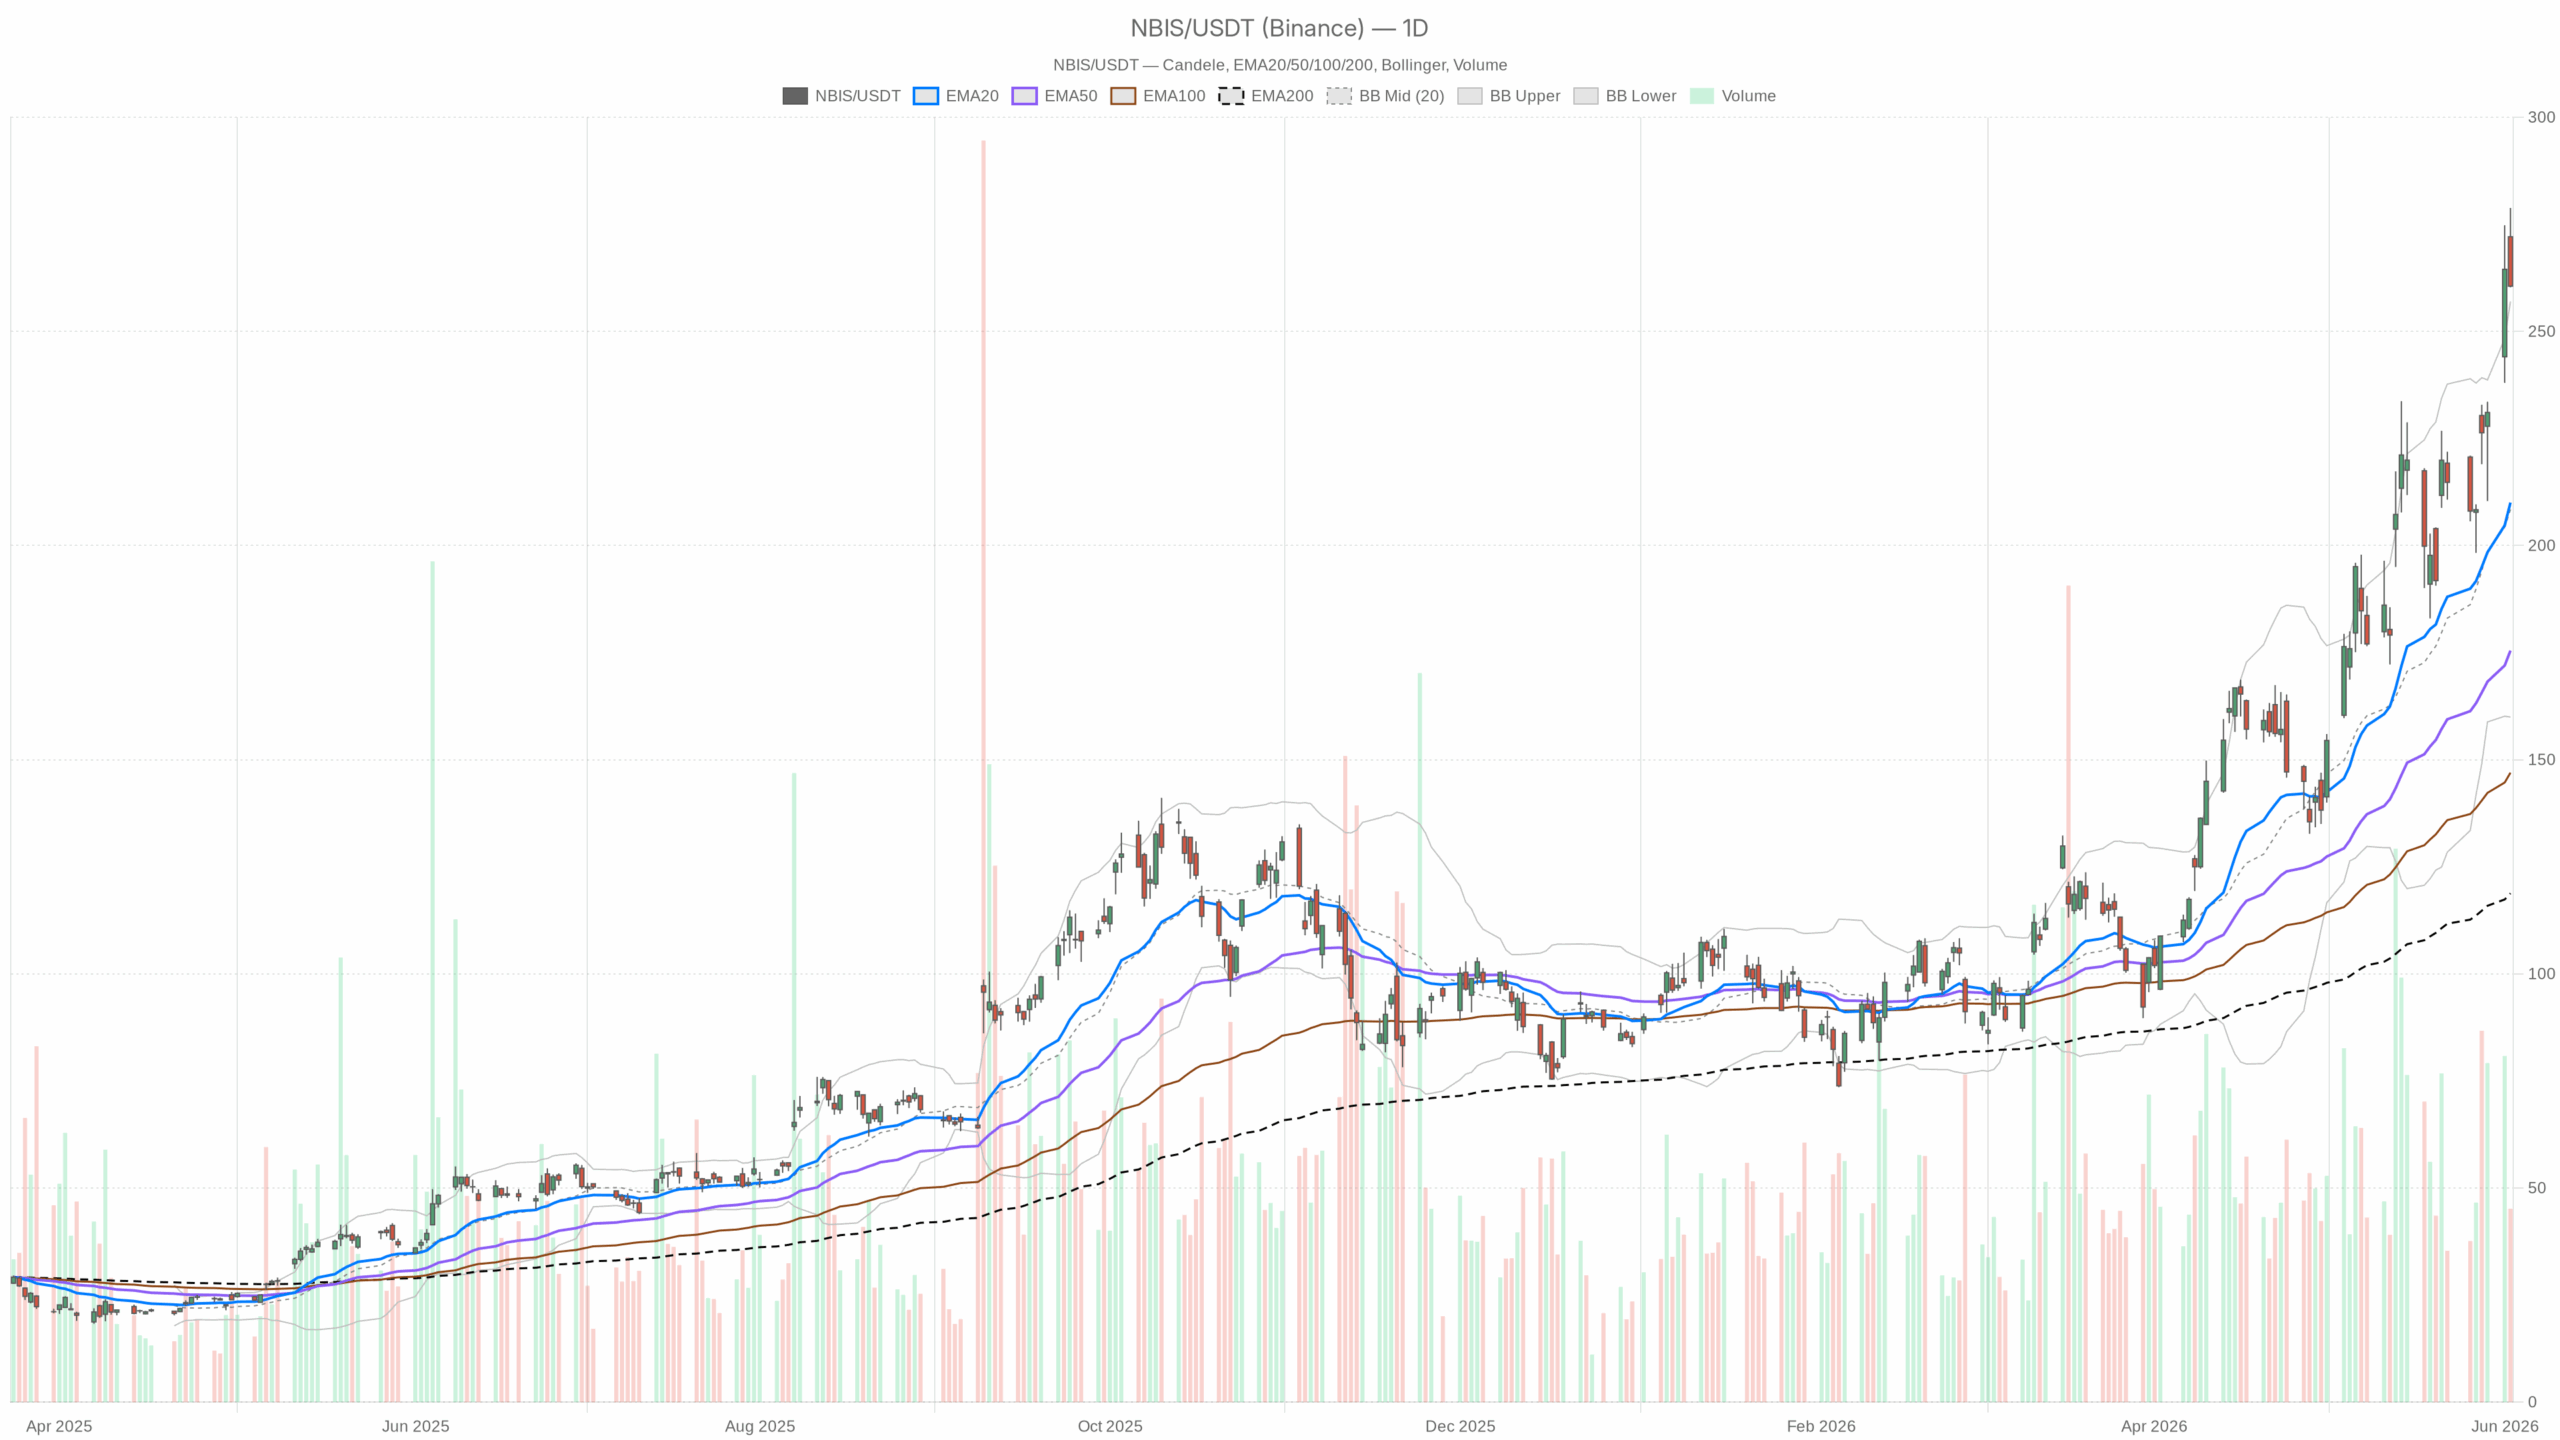 NBIS — daily chart with candlesticks, EMA20/EMA50 and volume.
Daily Timeframe Analysis of Nebius Stock: Structurally Bullish but Stretched
On the daily chart, Nebius Stock remains in a bullish trend regime. The EMA stack confirms a full bullish alignment: EMA20 at $210.05, EMA50 at $175.48, and EMA200 at $118.80—all well below the current price of $260.58. This sizable separation reflects sustained institutional accumulation over months. However, the RSI at 72.08 firmly places NBIS in overbought territory, compressing the margin for error despite not ending the trend.
The MACD stays positive with the line at 23.22 above the signal at 19.27, supported by a histogram of 3.95. Yet, the histogram is narrowing, indicating momentum is still present but no longer accelerating. The Bollinger Band upper band at $256.99 saw NBIS close just above it at $260.58. While a close above this band on high volume could suggest continuation, with a 72 RSI it more often signals exhaustion.
The daily ATR of $23.41 confirms that NBIS is moving in wide, volatile swings, which creates a high-risk environment for new long positions. The daily pivot structure sets support at $254.31 (S1) and a pivot point at $266.57, with NBIS closing between these levels. An intraday reversal—opening at $272.11, hitting $278.84, and closing at $260.58—illustrates bearish short-term implications despite the overall uptrend.
Hourly Momentum Analysis Highlights Fading Strength
On the 1-hour chart, Nebius Stock maintains a bullish structure but signals warnings. Price stays above EMA20 at $253.95, EMA50 at $236.35, and EMA200 at $197.71. However, the RSI at 60.94 is declining from higher levels, consistent with a market digesting recent gains rather than pushing higher.
The 1-hour MACD has flipped bearish, with the MACD line at 10.84 below the signal at 12.09, producing a negative histogram of -1.24. This indicates a divergence from the daily chart where the MACD is still positive and expanding. The fading hourly momentum suggests limited short-term upside.
Intraday ranges remain substantial with a 1H ATR of $8.79. The Bollinger Band shows price retreating from the upper $292.69 band, closing near the $253.20 midline. This pullback supports the narrative of near-term consolidation.
Nebius Stock 15-Minute Chart: Short-Term Sellers Gain Control
The 15-minute chart offers the clearest indication of near-term weakness for Nebius Stock. The RSI has dropped to 41.57, approaching oversold levels. Meanwhile, the MACD is fully negative with a line at -0.85 below the signal at -0.39, and a histogram of -0.46. The regime is neutral, not bullish.
Price closed at $260.37, below the 15m EMA20 of $263.57, near the lower Bollinger Band at $260.23. These conditions caution against chasing the price immediately. The 15m pivot support at $258.72 is the first critical level. Holding above this and reclaiming the EMA20 would suggest a constructive intraday recovery.
Bullish Scenario for Nebius Stock: Consolidation Sets Up Next Move
The bullish thesis depends on Nebius Stock maintaining daily support at $254.31 (S1) and staying above the EMA20 at $210.05. Consolidation between $254 and $266 would allow healthy digestion of recent gains, cooling the RSI and resetting the MACD histogram. Fundamentals remain strong—Q1 revenue growth surged 684% to $399 million and Nvidia’s endorsement adds credibility.
Analysts like Compass Point have raised price targets as high as $260, supporting a Buy rating. A sustained move above the daily pivot point at $266.57 toward the resistance level at $272.85 could restore momentum and trigger short covering, given 21% short interest.
Bearish Scenario: Valuation Pressure Reveals Downside Risks
Nebius Stock’s bearish case centers on the recent daily reversal. Opening near $272 and closing at $260.58 after an intraday high near $279 is a classic exhaustion pattern. The RSI at 72 and close above the upper Bollinger Band reinforce this. BNP Paribas’s Neutral rating at a $255 target and Compass Point’s $260 price point indicate the stock may be fully priced.
A break below the daily S1 support at $254.31 would be a significant warning signal, opening the possibility of a retest of the $236–$240 zone. This range includes the 1H EMA50 and recent consolidation lows. A daily close below $210 would seriously threaten the medium-term bullish outlook.
Positioning and Risk Management in a Volatile Nebius Stock Market
Nebius Stock remains structurally bullish on the daily timeframe but presents clear short-term caution signals. The daily reversal candle, overbought RSI, fading hourly MACD, and negative 15-minute momentum indicate the market needs time to clarify direction. Wide ATR values highlight significant volatility and risk in both directions.
The fundamental investment story is intact, with rare revenue growth in a hot AI infrastructure sector attracting institutional interest. Traders should monitor the critical support at $254 closely. A clean hold there offers a more risk-defined entry. Conversely, a break below that level shifts near-term momentum towards the bears.


 English (US) ·