
 2 hours ago
14
2 hours ago
14
Netflix, Inc. stock faces mounting pressure after a mixed Q2 earnings report. NFLX narrowly beat EPS estimates at $0.80 per share, but revenue of $12.56 billion missed consensus, and Q3 guidance fell short. The stock dropped in extended trading, reinforcing an already fragile technical structure.
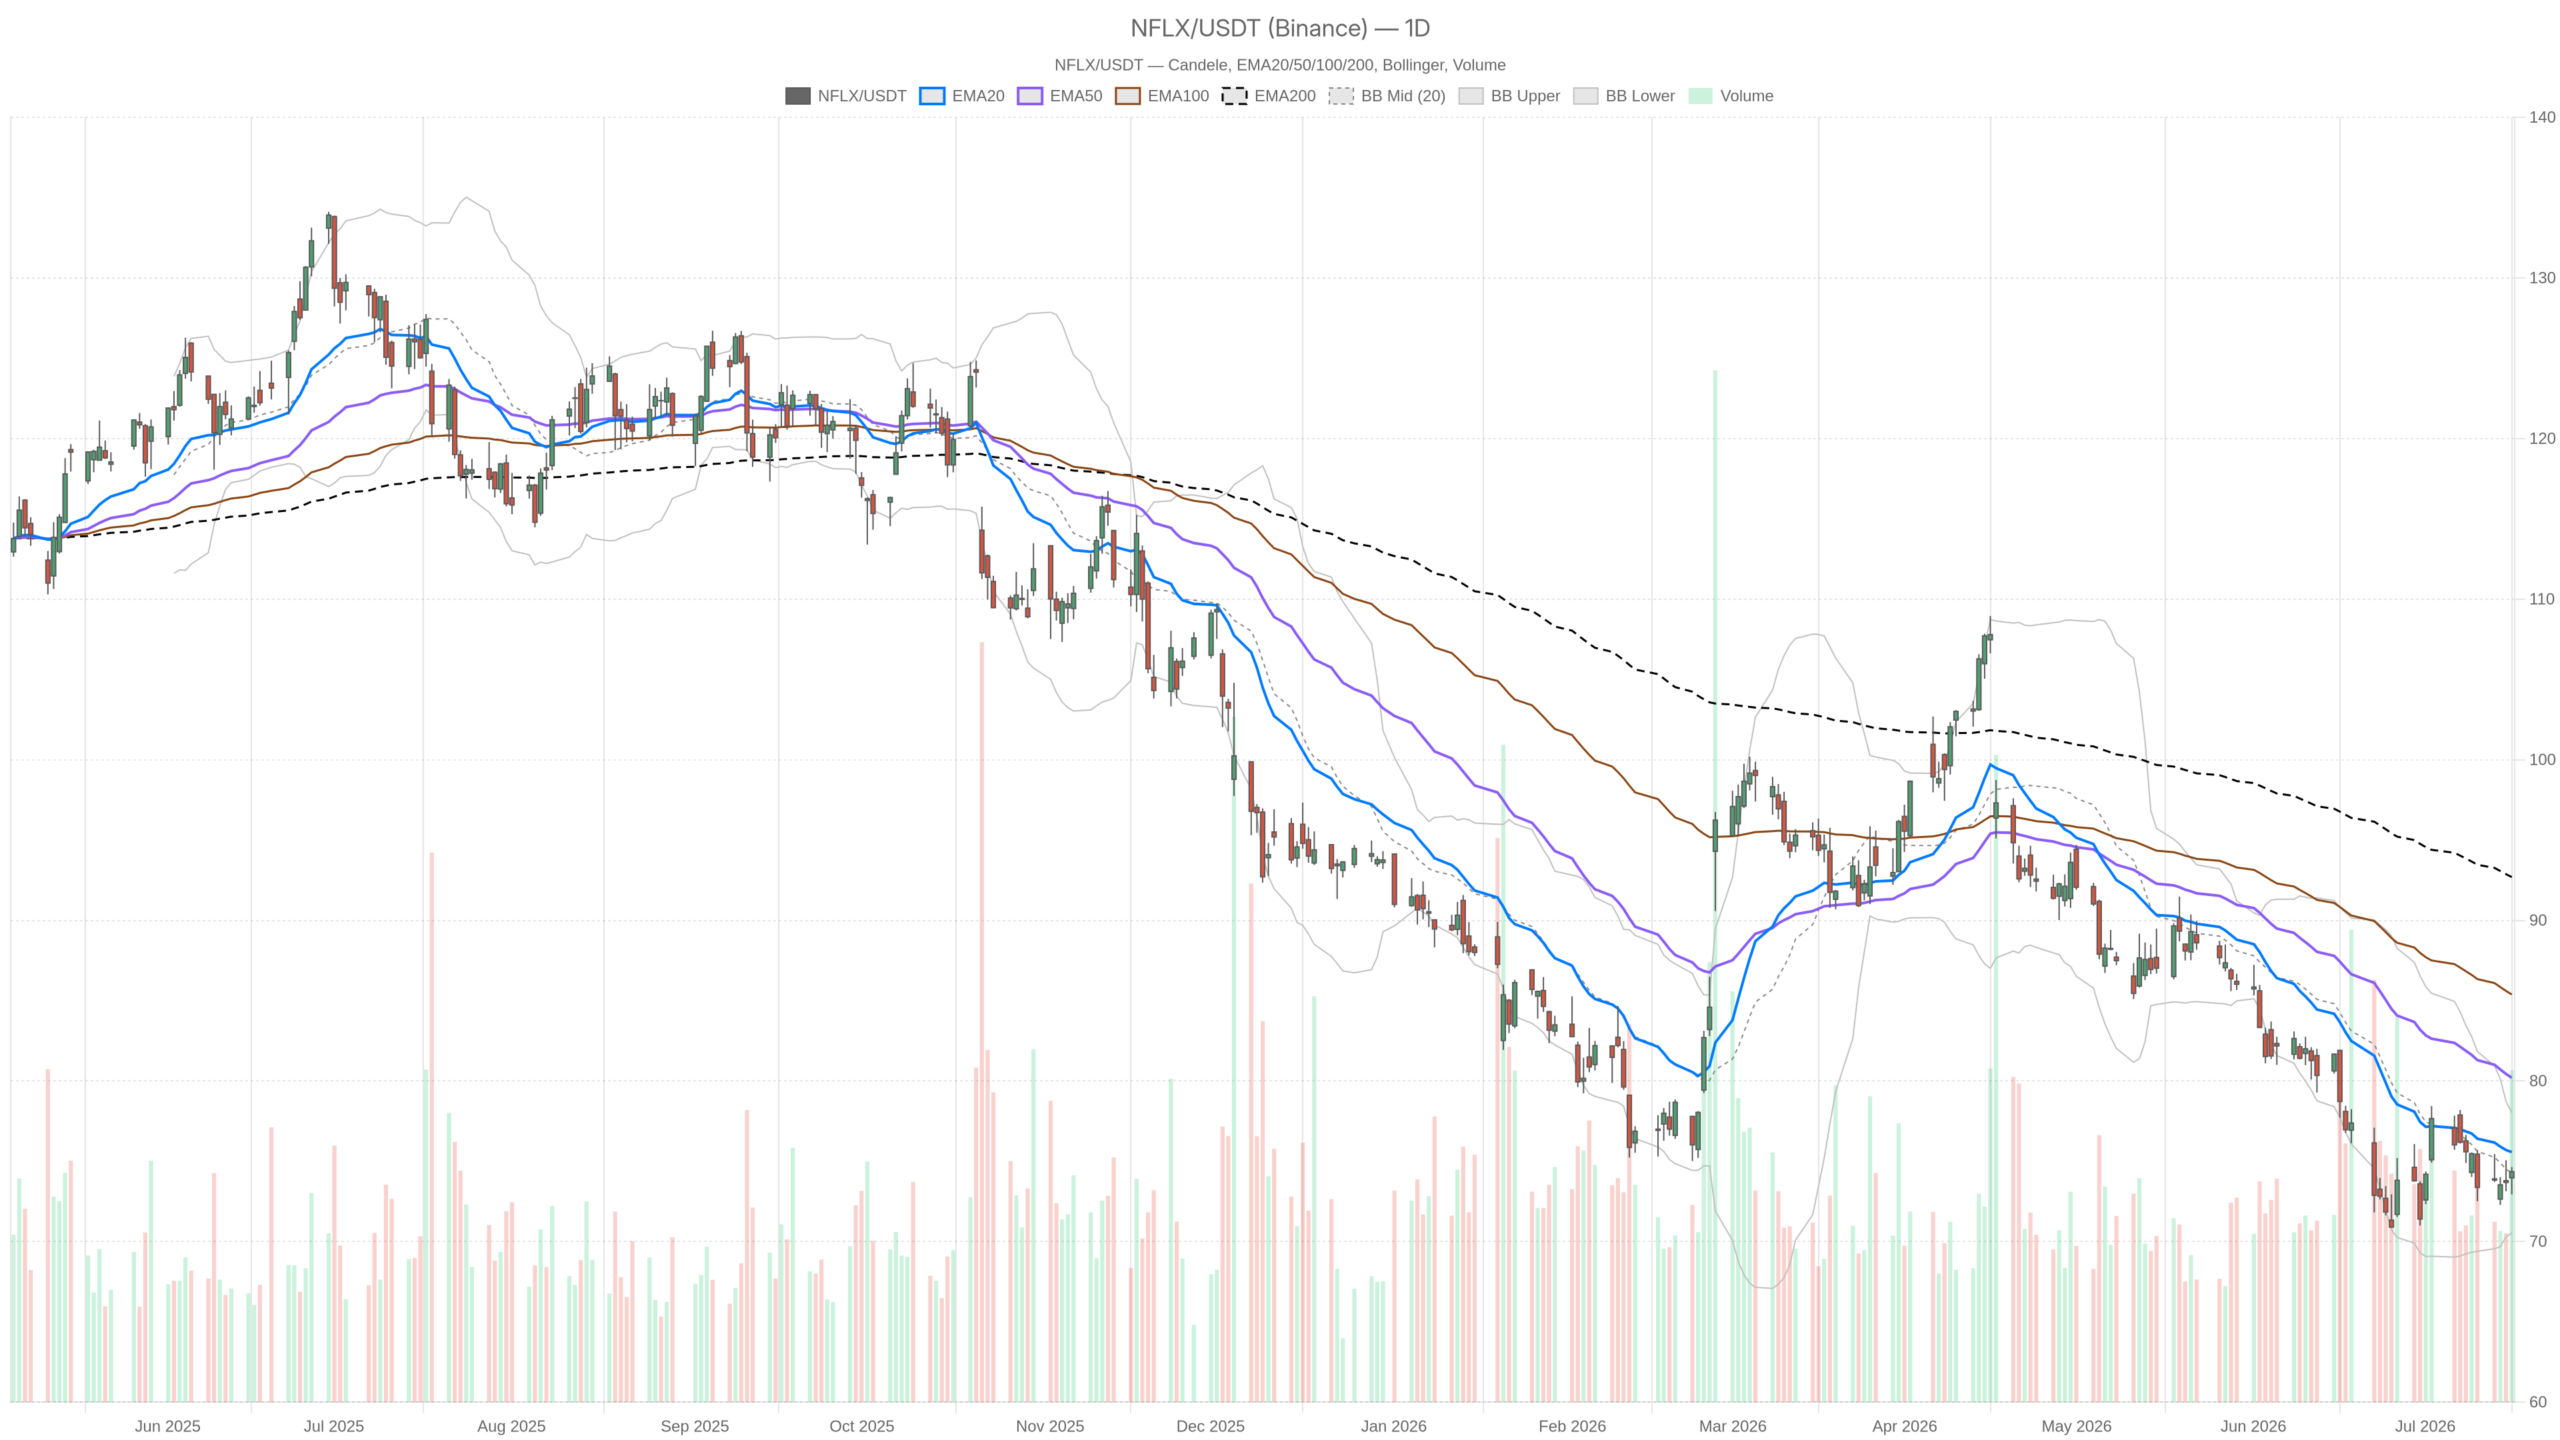 NFLX — daily chart with candlesticks, EMA20/EMA50 and volume.
Key takeaways
- NFLX posted adjusted EPS of $0.80, narrowly beating the $0.79 consensus estimate
- Revenue reached $12.56 billion, just below the $12.58 billion forecast
- Q3 revenue guidance came in below expectations, fueling the after-hours decline
- The daily chart remains in a bearish regime with price below the 20-day, 50-day, and 200-day EMAs
- Daily RSI at 42.01 leaves room for further downside before oversold conditions arise
Netflix, Inc. Stock Faces a Defining Moment After Q2 Earnings Miss
Netflix, Inc. stock enters a pivotal phase as earnings disappointment collides with an already fragile chart. The Q2 print was mixed: EPS narrowly beat, but revenue and Q3 guidance fell short. More importantly, the after-hours sell-off confirmed the bearish warnings the daily chart had been signaling for weeks. The technical structure was deteriorating before the numbers hit. Now the fundamental and technical narratives are aligned to the downside.
Daily Timeframe — The Bearish Bias Is Intact
The daily chart of Netflix, Inc. stock confirms a bearish regime. Price remains trapped below all three major moving averages, with the close at $74.35 on July 16 sitting beneath the 20-day EMA at $75.57 and the 50-day EMA at $80.20.
Moving Average Stack Signals Sustained Weakness
Notably, the 200-day EMA at $92.69 acts as a distant ceiling. Meanwhile, the 20-day and 50-day EMAs at $75.57 and $80.20 form a descending structure overhead. This configuration — price below all three averages — reflects genuine trend deterioration. It signals sustained selling pressure rather than a routine pullback within an uptrend.
Momentum Indicators Point to Weakness Without Capitulation
Meanwhile, the daily RSI stands at 42.01. It is not yet in oversold territory, meaning there is no technical floor to force a bounce. The MACD line sits at -1.97 against a signal of -2.39. Notably, the histogram has turned positive at 0.42, suggesting the pace of downside momentum is slowing. However, both the line and the signal remain deeply negative. This is a momentum recovery within a bearish trend — not a reversal signal.
Volatility and Pivot Levels Define Near-Term Risk
In terms of volatility, Bollinger Bands place the midline at $74.28. The upper band sits at $78.03 and the lower band at $70.54. Price is essentially riding the midline, which in a downtrend often acts as resistance rather than support. The ATR of $2.49 reflects moderate daily volatility — enough to produce meaningful swings, but not yet signaling capitulation. Daily pivot analysis puts the pivot at $73.98, with R1 at $75.01 and S1 at $73.31. The close at $74.35 sits between the pivot and R1 — constructive on a session basis, but insufficient to challenge the broader downtrend.
Hourly Chart — A Short-Term Recovery That Complicates the Picture
The 1H chart paints a more constructive short-term picture. However, the bounce has not yet challenged the broader bearish structure. The hourly regime is classified as neutral. NFLX closed the 15:30 candle at $74.58, above both the 1H EMA20 at $73.97 and the EMA50 at $74.25. This represents a mild bullish cross on the shorter timeframe.
Momentum Shift Without Trend Reversal
The 1H MACD histogram stands positive at 0.10. At the same time, the RSI has climbed to 55.39. Neither reading is overbought. Together, they suggest short-term momentum has shifted modestly upward. This is the one area where intraday structure diverges from the daily bearish thesis. Still, the 1H EMA200 at $76.88 remains well above current price. It confirms that even on the hourly chart, the medium-term trend points lower.
In contrast, the Bollinger upper band at $74.66 was being tested at the close. This often acts as a near-term cap on short-covering rallies. The 1H ATR of $0.78 implies contained intraday movement. This is not a volatility explosion. It is a technical bounce within a larger downward structure.
15-Minute Context — Execution Framing Only
The 15-minute chart offers tactical execution levels but adds no new information to the medium-term thesis. The 15:45 candle closed at $74.58. All three EMAs — 20, 50, and 200 — are tightly clustered between $73.89 and $74.21. Price broke above all three near the close. The 15m MACD is marginally positive, and RSI at 61 leans bullish on this micro frame.
For tactical entries, the $73.82–$73.44 zone represents short-term support. Meanwhile, $74.98 — the shared R1 across both the 1H and 15m pivots — marks the immediate overhead resistance worth watching.
The Bullish Scenario — What Would Need to Change
A credible recovery in Netflix, Inc. stock requires more than a short-term bounce. On the technical side, NFLX would need to reclaim the daily EMA20 at $75.57 with conviction. Ideally, it would follow through above the Bollinger upper band at $78.03. That sequence would shift the daily MACD histogram further into positive territory and begin to neutralize the bearish regime classification.
On the fundamental side, the market’s reaction to Q3 guidance will be critical. If investors conclude the Q3 revenue miss was temporary — and focus instead on earnings-per-share compounding and margin expansion — sentiment could stabilize. A shift in narrative around earnings power rather than revenue growth could support a re-rating.
The Bearish Scenario — Downside Risks Remain Material
The bearish case for Netflix, Inc. stock is straightforward and better supported by current evidence. Price sits below every major daily moving average. The Q3 outlook disappointed, and the stock dropped in extended hours following the print. If after-hours weakness carries into the next regular session, daily S1 at $73.31 becomes the first test. Below that, the Bollinger lower band at $70.54 is the next structural reference.
Notably, a failure to hold $73.31 on a closing basis would reinforce the daily bearish regime. It would likely flush out any residual long exposure built on hopes of an earnings-driven reversal. Moreover, the absence of oversold RSI conditions means there is limited technical justification for a forced bounce at current levels.
Positioning, Volatility, and the Weight of Uncertainty
Netflix, Inc. stock enters the post-earnings period in a technically vulnerable position. The daily structure is bearish, and the EMA stack is aligned to the downside. The fundamental catalyst — Q2 earnings — delivered a mixed message at best.
The intraday recovery is real but insufficient to change the medium-term thesis. Volatility, as measured by ATR, remains moderate rather than extreme. This suggests the market has not yet fully priced in the Q3 guidance miss. Traders should respect the conflict between the daily bearish regime and the short-term 1H recovery. Any move toward the $75.57–$76.88 zone should be treated as resistance, not a breakout. The burden of proof remains with the bulls.
FAQ
What were Netflix’s Q2 earnings results?
NFLX posted adjusted earnings of $0.80 per share, narrowly beating the $0.79 consensus estimate. However, revenue came in at $12.56 billion, just below the $12.58 billion forecast. Q3 revenue guidance also fell short of expectations, sending the stock lower in after-hours trading.
Is Netflix stock in a bearish trend?
Yes. The daily chart shows a confirmed bearish regime. Price at $74.35 sits below the 20-day EMA at $75.57, the 50-day EMA at $80.20, and the 200-day EMA at $92.69. The daily RSI at 42.01 is not yet oversold, leaving room for further downside.
What are the key support levels for NFLX stock?
The first key support is the daily S1 at $73.31. Below that, the Bollinger lower band at $70.54 serves as the next structural reference. A closing break below $73.31 would reinforce the bearish regime and likely flush out residual long positions.
What needs to happen for Netflix stock to turn bullish?
NFLX would need to reclaim the daily EMA20 at $75.57 with conviction and ideally follow through above the Bollinger upper band at $78.03. On the fundamental side, investors would need to look past the Q3 guidance miss and focus on earnings power and margin expansion to support a re-rating.
Disclaimer: This article is for informational purposes only and does not constitute financial advice, an investment recommendation, or a solicitation to buy or sell any financial instrument or cryptocurrency. The analysis provided is not indicative of future results. Investing in crypto assets and financial markets carries a high risk of capital loss. Always do your own research (DYOR) and consult a qualified financial advisor before making any decision.
Article produced with the assistance of artificial intelligence and reviewed by the editorial team.








 English (US) ·