
 4 hours ago
14
4 hours ago
14

NIO Inc. stock enters its Q2 earnings window under clear technical pressure, closing Monday at $4.23 on heavy volume of roughly 44.5 million shares. With the daily chart in a bearish regime, tension between trend and oversold momentum defines the setup heading into the print.
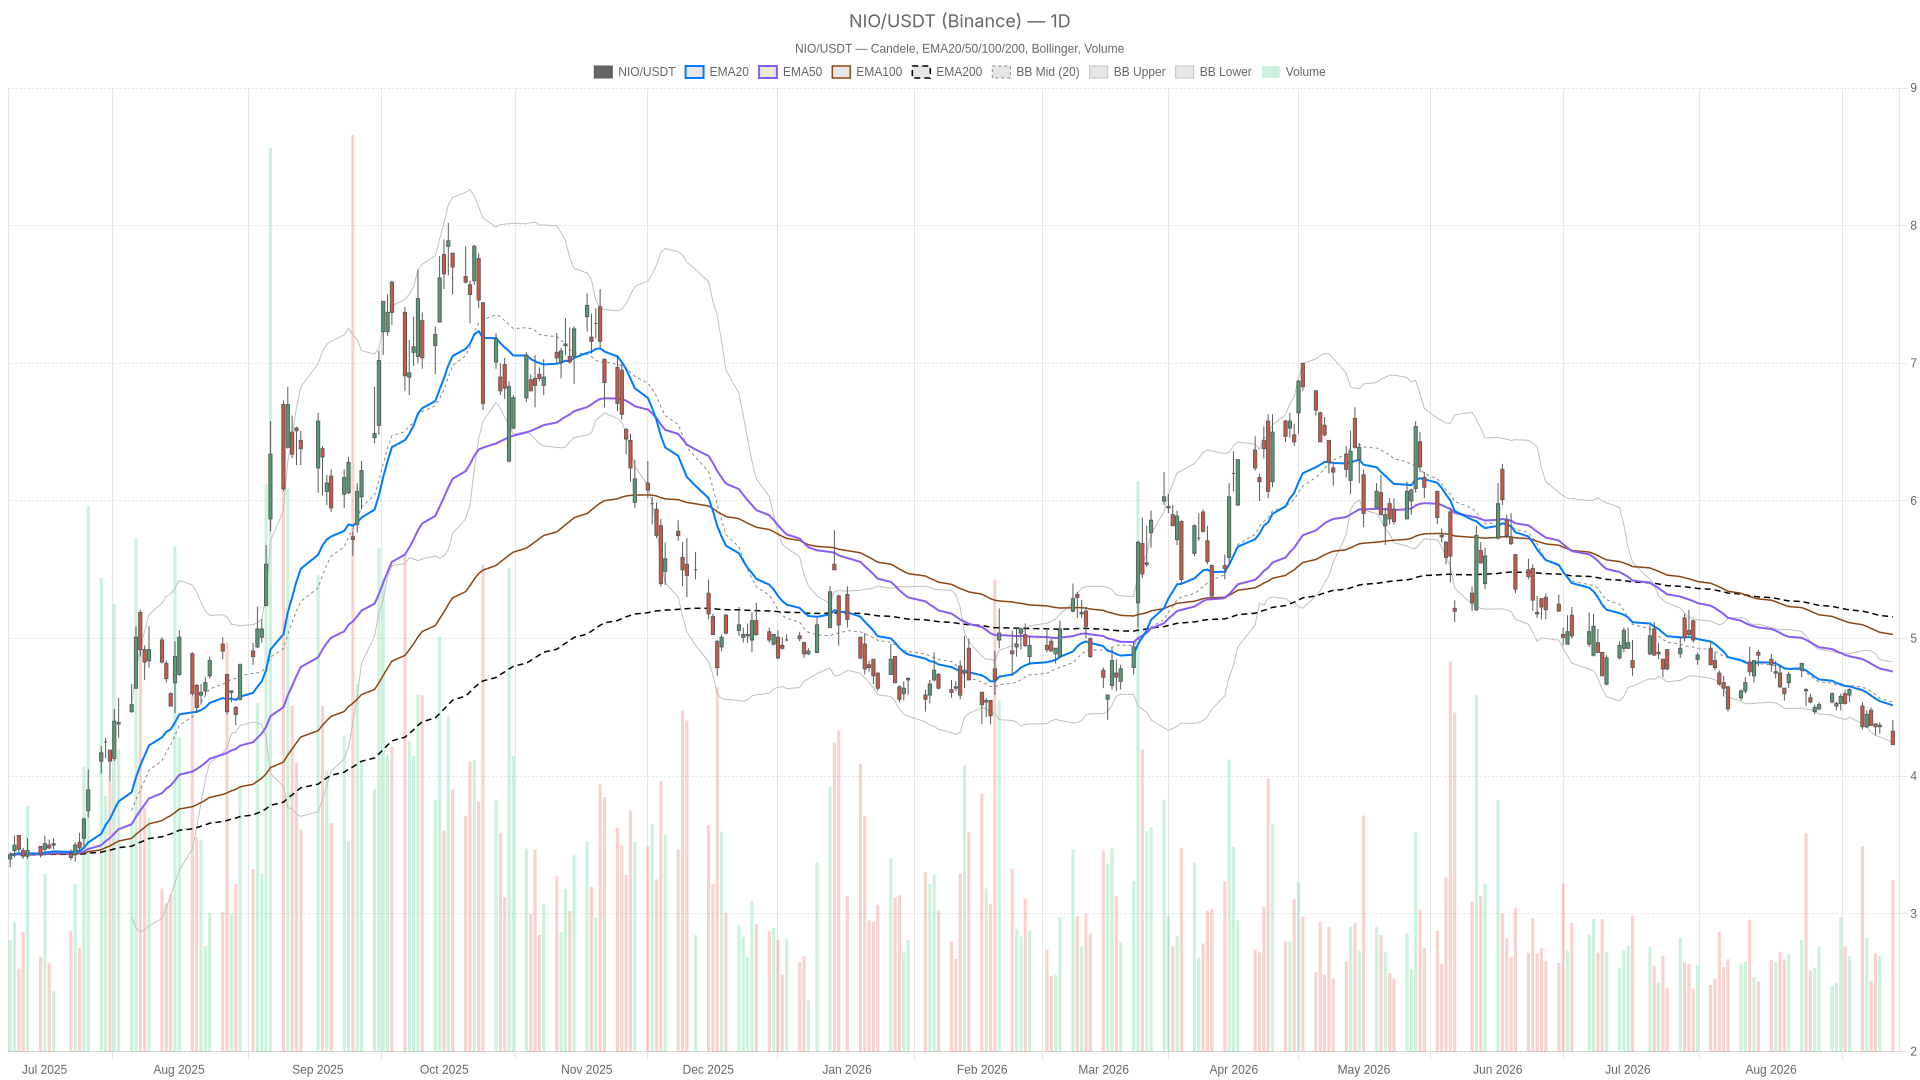 NIO — daily chart with candlesticks, EMA20/EMA50 and volume.
Key takeaways
- NIO Inc. stock closed Monday at $4.23 on volume of roughly 44.5 million shares, sitting below every major moving average.
- Daily RSI14 at 34.58 has not yet reached oversold territory, leaving room for further downside.
- Hourly RSI14 at 27.82 is firmly oversold, while MACD shows flattening downside momentum.
- NIO reported 35,836 vehicle deliveries in August, up 14.5% year-over-year.
- Revenue is expected up 87% year-over-year, though profitability remains the key investor focus.
Daily Timeframe: Bearish Structure Dominates NIO Inc. Stock
The daily chart leaves no ambiguity — NIO Inc. stock is in a confirmed downtrend. Price at $4.23 sits below the EMA20 at $4.52, the EMA50 at $4.76, and the EMA200 at $5.16.
At present, that stacked alignment, with shorter averages beneath longer ones, is a textbook downtrend signature. Sellers have controlled the tape across multiple horizons, not just the last few sessions.
Meanwhile, the RSI14 reads 34.58, which is weak but not yet oversold on this timeframe. That leaves room for further downside before the daily chart itself flags exhaustion. The MACD line at -0.13 sits below its signal line at -0.11, with a histogram of -0.02. The negative histogram confirms bearish momentum is still present, even if the pace of deterioration has not accelerated sharply.
Meanwhile, Bollinger Bands show the mid-line at $4.54, the upper band at $4.83, and the lower band at $4.24. NIO’s close is essentially sitting on that lower band. This is a classic sign of a market riding the bottom edge of its volatility envelope rather than bouncing off it. ATR14 stands at $0.12, reflecting elevated volatility relative to the stock’s price level.
On the pivot framework, the pivot point at $4.29 sits above current price, with resistance at $4.35 and support at $4.17. Trading below the pivot and near S1 confirms bears hold the near-term initiative.
Hourly Confirmation: NIO Stock Momentum Turns Oversold
The hourly chart confirms the bearish bias but adds a critical warning — momentum has reached oversold territory. NIO Inc. stock may be due for a short-term stabilization even within the broader downtrend.
In line with the daily view, the 1-hour chart keeps price at $4.24 below the EMA20 at $4.34, the EMA50 at $4.40, and the EMA200 at $4.58. Therefore, the intraday trend structure aligns with the daily downtrend without contradiction.
However, momentum tells a more nuanced story. RSI14 on the hourly chart has dropped to 27.82, firmly in oversold territory. At the same time, the MACD line and signal line are both at -0.03. The histogram reads just -0.01, suggesting downside momentum is flattening rather than accelerating. Notably, price at $4.24 is trading below the lower Bollinger Band at $4.27. This extension beyond the normal volatility envelope often precedes at least a short-term stabilization.
This is where the daily and hourly views partially diverge. The daily trend remains bearish and unchallenged. However, the hourly oversold reading complicates the picture for anyone looking to chase fresh short positions at current levels. A relief bounce toward the hourly pivot at $4.26 or resistance at $4.28 would not be surprising, even within an intact downtrend.
15-Minute Execution Context for NIO Inc. Stock
The 15-minute chart reinforces the oversold signal, keeping NIO Inc. stock under short-term pressure ahead of the print. Short-term structure remains bearish, but momentum is stretched to levels that argue against aggressive selling.
On the shortest timeframe, price at $4.24 remains below the EMA20 at $4.31, the EMA50 at $4.33, and the EMA200 at $4.40. This keeps short-term structure bearish. RSI14 at 28.62 mirrors the hourly oversold condition. Meanwhile, the MACD reading of -0.02 versus a -0.01 signal line shows momentum losing some downside force.
Price is also trading below the 15-minute lower Bollinger Band of $4.26, reinforcing the sense of a stretched short-term move. With ATR14 at just $0.03, intraday ranges have been tight. Traders should expect that any earnings-driven move could arrive with outsized speed relative to recent ranges. The 15-minute pivot at $4.26, with resistance at $4.28 and support at $4.22, offers the tightest reference points for execution around the print.
Catalyst Watch: Earnings and Delivery Data
NIO Inc. stock faces a genuinely two-sided fundamental setup ahead of earnings. Strong delivery growth supports the bull case, but unresolved profitability questions keep pressure on the stock.
The technical picture cannot be separated from the fundamental backdrop. Notably, NIO reported 35,836 vehicle deliveries in August, up 14.5% year-over-year, a figure that keeps the growth narrative intact. Ahead of the Q2 print, analysts have flagged revenue seen up 87% year-over-year on surging deliveries. However, profitability remains the key focus for investors.
One widely circulated piece even suggested the September 1 earnings report could send NIO Inc. stock soaring. It framed the event as a moment long-awaited by shareholders. In contrast, a separate buy/sell/hold analysis highlighted that strong delivery growth and rising revenue expectations are being weighed against ongoing margin pressure.
Overall, the fundamental setup is genuinely two-sided: strong top-line momentum against unresolved profitability questions. Adding to the complexity, broader market futures edged lower heading into the session amid escalating Middle East tensions. This macro headwind could dampen risk appetite regardless of NIO’s own results.
Bullish Scenario for NIO Inc. Stock
For NIO Inc. stock to stage a bullish reversal, the Q2 report must deliver on the 87% revenue growth expectation while showing tangible progress on profitability.
If that happens, reclaiming the daily pivot at $4.29 would be the first technical hurdle. Next, price would need to clear the EMA20 at $4.52 and the daily resistance at $4.35.
Still, for momentum to genuinely confirm a shift, RSI would need to recover well above the current 34.58 reading. The MACD histogram would also need to flip positive. The 14.5% year-over-year delivery growth already gives bulls a fundamental argument to build on.
Bearish Scenario and Invalidation
If earnings disappoint on margins, NIO Inc. stock could break below the daily support at $4.17. A failure of oversold readings to produce any bounce would confirm sellers remain firmly in control.
In contrast, if earnings disappoint on margins despite the strong delivery numbers, downside could extend below that daily support. A break lower without the oversold hourly and 15-minute readings producing any bounce would confirm sellers remain firmly in control. That risk is compounded by the softer macro backdrop, with Middle East tensions already pressuring broader equity futures into the session.
Overall, the path of least resistance on the daily chart still points lower. The bearish regime is confirmed rather than weakened by the hourly picture. However, the oversold readings on both the hourly and 15-minute charts mean volatility around the earnings release could cut in either direction sharply. Positioning into this print carries real event risk. With ATR levels already elevated relative to price, traders should expect wider-than-usual swings until the market fully digests NIO’s numbers and guidance.
FAQ
Is NIO Inc. stock in a bearish trend?
NIO Inc. stock closed Monday at $4.23, sitting below the EMA20 at $4.52, the EMA50 at $4.76, and the EMA200 at $5.16. This stacked alignment of moving averages is a textbook downtrend signature. The daily MACD histogram remains negative at -0.02, confirming bearish momentum.
What are the key levels to watch for NIO Inc. stock around earnings?
The daily pivot sits at $4.29, with resistance at $4.35 and support at $4.17. On the hourly chart, the pivot at $4.26 and resistance at $4.28 offer the tightest reference points. A break above $4.29 would be the first technical hurdle for bulls, while a break below $4.17 would confirm continued bearish control.
Could NIO Inc. stock bounce despite the bearish trend?
Yes. The hourly RSI14 has dropped to 27.82, firmly in oversold territory, and the MACD histogram is flattening at -0.01. Price is trading below the lower Bollinger Band on both hourly and 15-minute charts, a condition that often precedes short-term stabilization. However, any bounce would occur within the context of an intact daily downtrend.
Disclaimer: This article is for informational purposes only and does not constitute financial advice, an investment recommendation, or a solicitation to buy or sell any financial instrument or cryptocurrency. The analysis provided is not indicative of future results. Investing in crypto assets and financial markets carries a high risk of capital loss. Always do your own research (DYOR) and consult a qualified financial advisor before making any decision.
Article produced with the assistance of artificial intelligence and reviewed by the editorial team.






 English (US) ·