
 4 hours ago
19
4 hours ago
19

Palantir stock is under sustained bearish pressure, with PLTR trading at $112.93 on June 26. The price sits well below its EMA20 at $126.89, EMA50 at $134.61, and EMA200 at $145.88. This stacked alignment keeps sellers firmly in control of the daily timeframe.
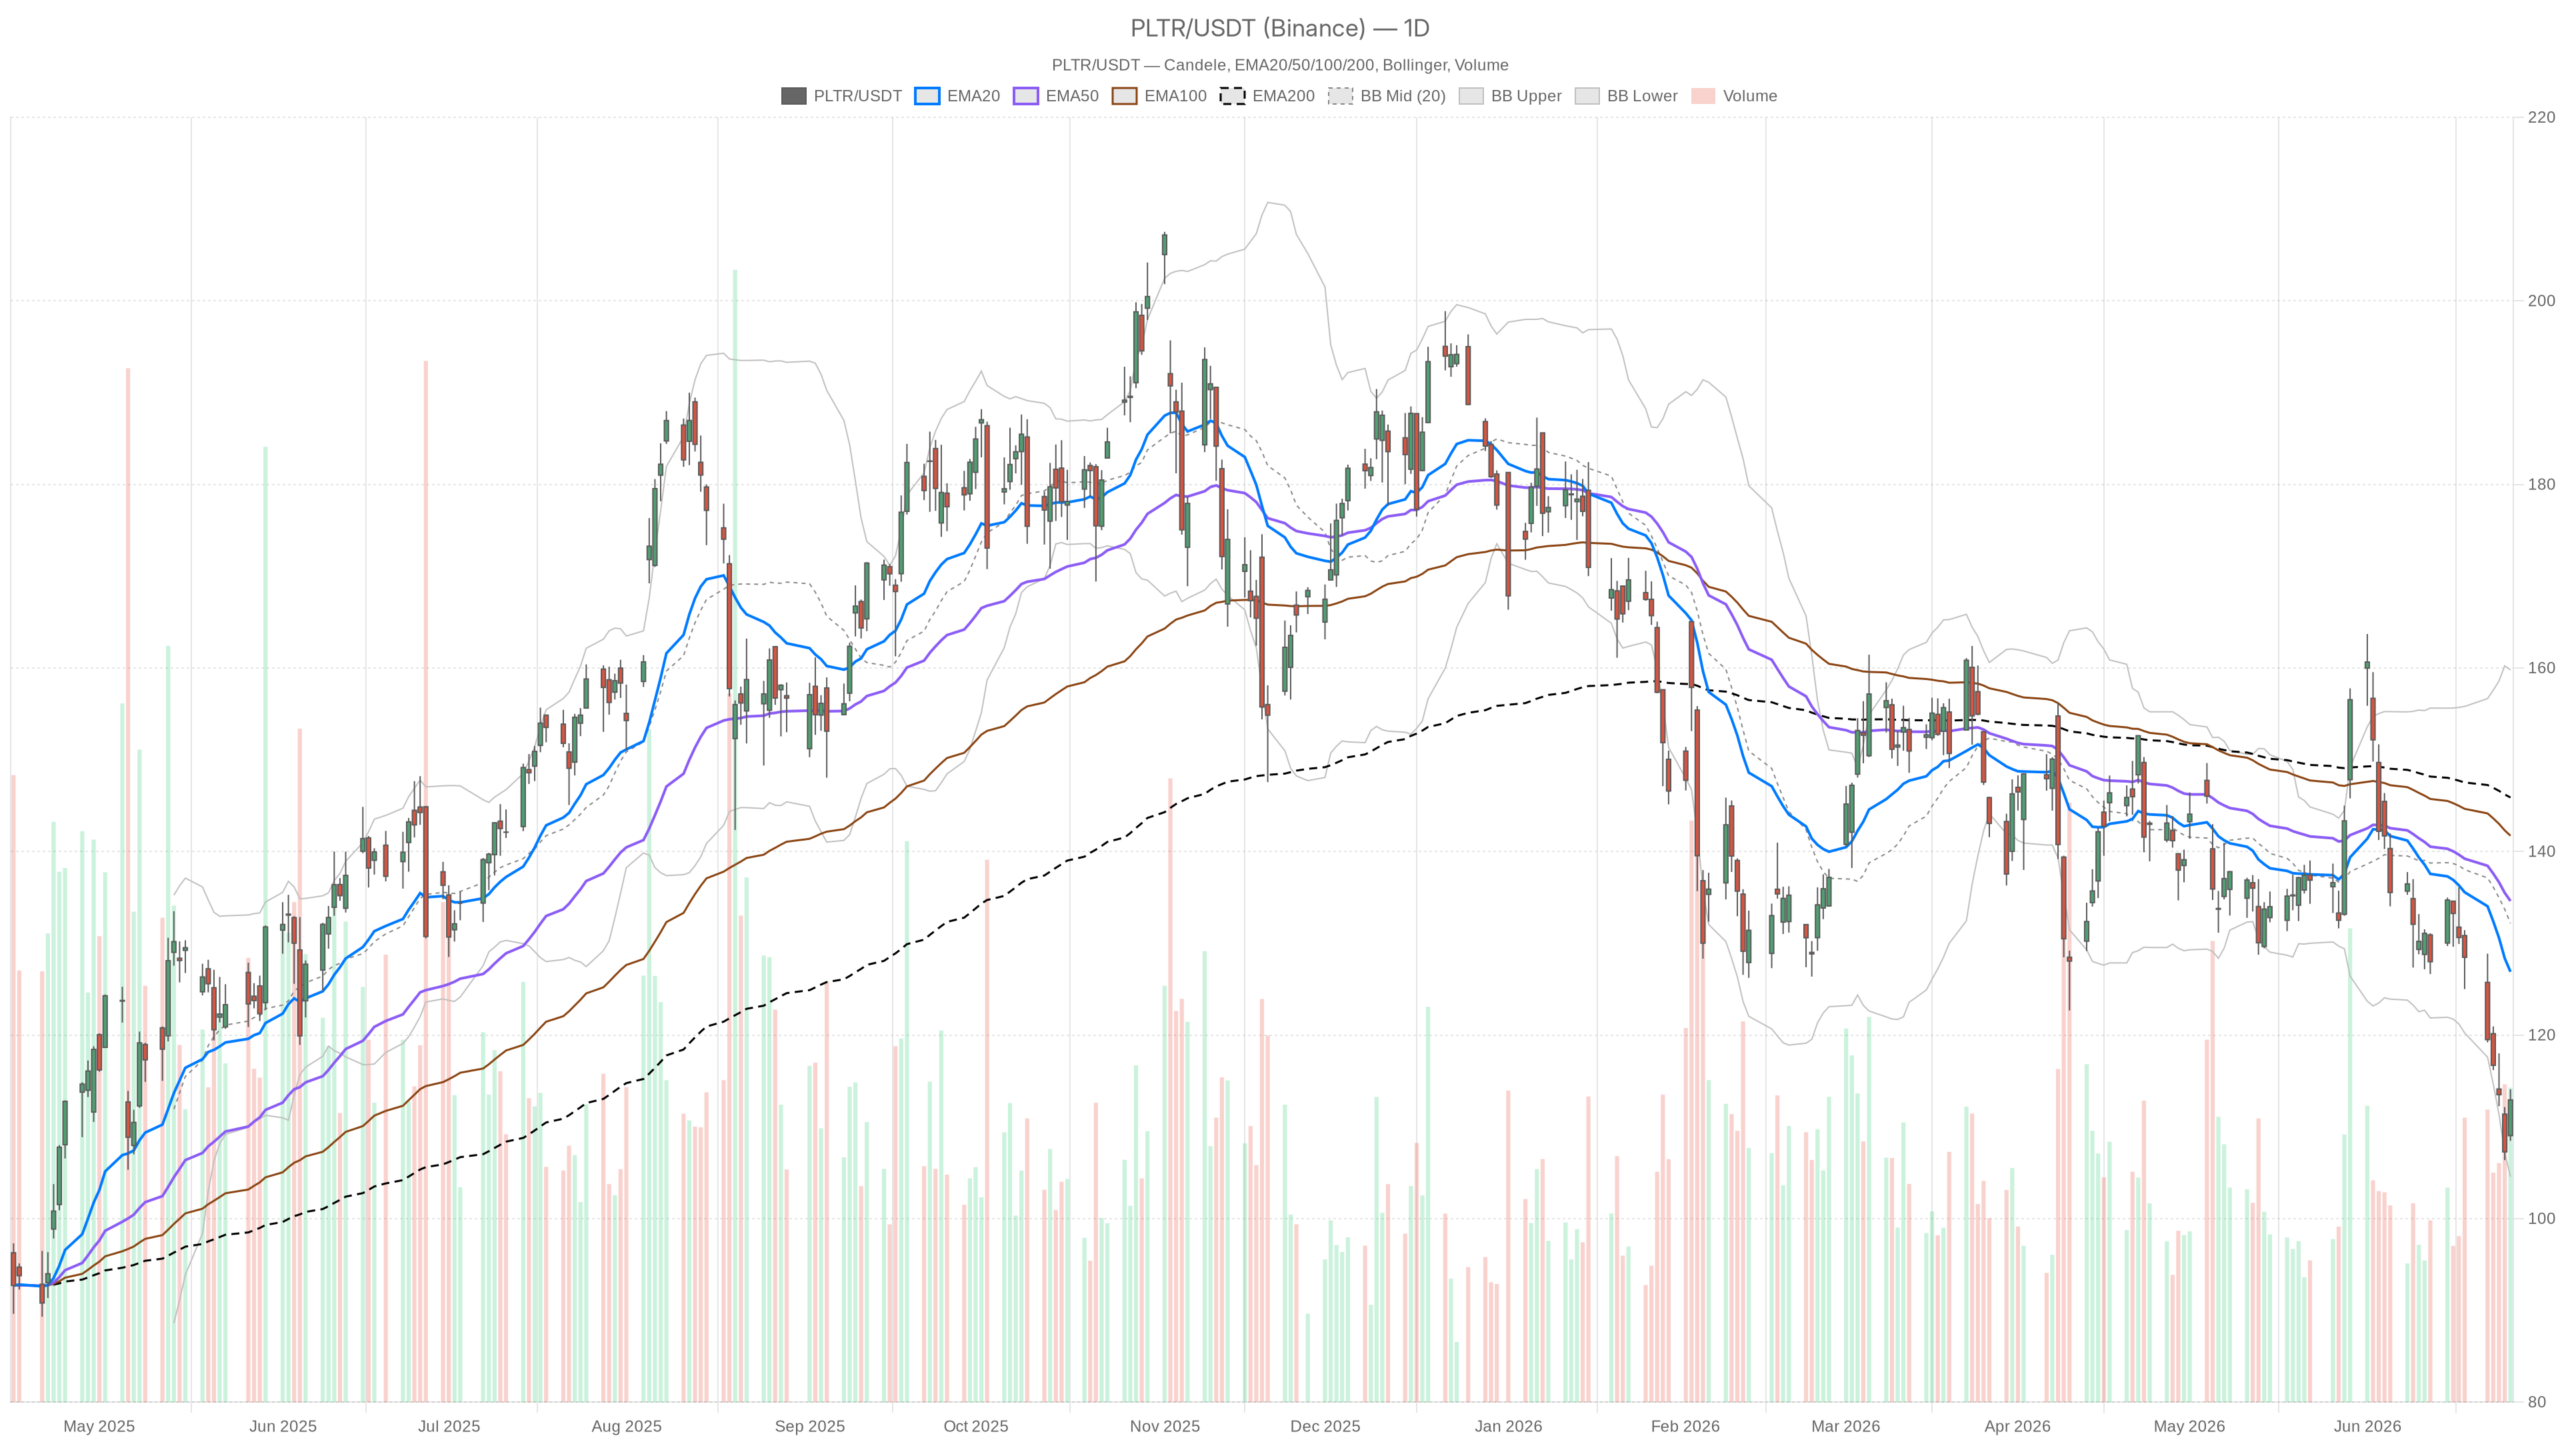 PLTR — daily chart with candlesticks, EMA20/EMA50 and volume.
Key takeaways
- Palantir stock is in a confirmed bearish regime on the daily chart, with all three key EMAs stacked against the price.
- Daily RSI at 34.51 and a negative MACD histogram of -2.54 confirm momentum remains firmly with sellers.
- The 1-hour chart shows early stabilization but remains neutral, with price barely above its EMA20 at $112.71.
- Immediate resistance sits at $115.18; a break below daily pivot support at $109.57 would open the path to $104.57.
- Fundamental catalysts are mixed: a major government contract win for Palantir Foundry is offset by persistent valuation concerns.
Daily Technical Structure Keeps Palantir Stock Under Bearish Pressure
Palantir stock remains locked in a bearish daily structure, with the EMA20, EMA50, and EMA200 all stacked well above the current price of $112.93. Notably, the daily RSI at 34.51 underscores the selling pressure. It has not reached oversold territory, yet its proximity to the 30 threshold confirms that bearish momentum has been sustained for some time. The MACD reinforces this picture. Its line at -7.02 sits well below the signal at -4.48, and the histogram reads -2.54. This is not a momentum setup showing exhaustion — it is one still deteriorating.
Meanwhile, Bollinger Bands place the daily midline at $132.18, with the upper band at $159.79 and the lower band at $104.57. PLTR is pressing toward the lower half of the range. It has not yet tagged the lower band, which could serve as a technical floor if selling intensifies. The ATR of $6.01 reflects elevated daily volatility. Intraday swings should be treated as noise within a larger bearish move. Daily pivot support sits at $109.57, with R1 resistance at $115.18.
Short-Term Timeframes Offer Stabilization Without a Reversal Signal
Short-term charts show early stabilization for Palantir stock, but neither the 1-hour nor the 15-minute timeframe has challenged the dominant daily bearish structure.
1-Hour Chart Shows a Neutral but Improving Pulse
The 1-hour regime is classified as neutral, and the hourly MACD histogram has turned positive at +0.99. This represents a small but real divergence from the daily bear trend. However, the 1H MACD line at -1.78 remains below its signal, so the histogram improvement only hints at fading selling momentum — not a bullish turn.
The 1H RSI at 45.66 sits in neutral territory, consistent with the indecisive regime reading. Price at $112.83 has edged just above its EMA20 at $112.71, offering a marginal sign of near-term stabilisation. The 1H EMA50 at $117.94 and EMA200 at $130.09 remain well above, confirming that the daily bearish structure has not been repaired. The 1H Bollinger midline at $111.29 has been cleared, providing modest support to the short-term recovery narrative.
15-Minute Chart Confirms Tight, Range-Bound Trading
The 15-minute regime is also neutral, with the RSI at 56.29 offering the strongest reading across all three timeframes. Price sits above both the EMA20 at $112.48 and the EMA50 at $111.96. Meanwhile, the 15m MACD histogram is slightly negative at -0.16, suggesting the intraday momentum push may be losing steam. The 15m ATR of $0.71 reflects tight, compressed price action — not the kind of expansion that drives sustained breakouts. For execution purposes, the near-term range is narrow, bounded by pivot support at $111.70 and resistance at $113.67.
Fundamental Picture Remains Mixed for PLTR
Palantir’s fundamental backdrop offers genuinely mixed signals, with major government contract momentum competing against persistent valuation concerns. On the bullish side, the selection of Palantir Foundry as the cloud data layer for the US Army’s NGC2 program is a material government contract win. It reinforces the government AI platform narrative and provides a concrete revenue anchor. Additionally, a biosecurity opportunity highlighted by analysts suggests the company may be building exposure to another high-growth vertical beyond its core defence and intelligence roots.
In contrast, the bearish case has not gone quiet. A notable Seeking Alpha analysis revisiting a reverse DCF model continues to flag valuation concerns, maintaining a bearish view despite Palantir’s commercial AI expansion. Cathie Wood’s recent move on PLTR amid the share price decline has drawn attention, but broader sentiment around AI stocks is increasingly complex. Exposure to the AI boom is no longer being treated as a straightforward tailwind. These dynamics partly explain why Palantir stock remains under technical pressure despite strong fundamental narratives.
Bullish Scenario Hinges on Reclaiming $115.18
For Palantir stock to stage a meaningful bullish reversal, price must reclaim and hold above the daily R1 pivot at $115.18. From there, a sustained move back toward the EMA20 at $126.89 would represent the first meaningful technical milestone. Achieving this would require the daily MACD histogram to start narrowing and the RSI to recover above 40. Continued government contract momentum and commercial AI growth would provide the fundamental fuel. A broader AI sector rotation back into quality names like PLTR would accelerate such a recovery.
Bearish Scenario Retains Higher Probability
The bearish scenario remains the path of least resistance, with a break below $109.57 likely to trigger a test of the lower Bollinger Band at $104.57. A failure at the $113.67–$115.18 resistance zone would confirm the bounce is purely technical. A break below daily pivot support at $109.57 would open the door to the $104.57 target. The daily MACD and the stacked bearish EMA structure both support this outcome. Valuation concerns combined with cooling AI enthusiasm could sustain the selling pressure driving PLTR well below its longer-term moving averages. Overall, compelling fundamental stories do not always override structural technical damage in the short term.
FAQ
Is Palantir stock in a bearish or bullish trend?
Palantir stock is in a confirmed bearish trend on the daily timeframe. Price at $112.93 sits well below the EMA20 ($126.89), EMA50 ($134.61), and EMA200 ($145.88), and the daily RSI at 34.51 confirms sustained selling pressure.
What are the key support levels for PLTR?
Immediate daily pivot support sits at $109.57. Below that, the lower Bollinger Band at $104.57 represents the next major technical floor. On the 15-minute chart, near-term support holds at $111.70.
What needs to happen for PLTR to turn bullish?
A bullish reversal requires PLTR to reclaim and hold above the $115.18 daily R1 pivot, followed by a sustained move toward the EMA20 at $126.89. The daily MACD histogram must narrow and RSI must recover above 40 to confirm momentum improvement.
What fundamental catalysts support Palantir stock?
The selection of Palantir Foundry for the US Army’s NGC2 program represents a material government contract win that reinforces the AI platform narrative. Analysts also highlight a biosecurity opportunity that could expand Palantir’s reach beyond defence and intelligence.
Disclaimer: This article is for informational purposes only and does not constitute financial advice, an investment recommendation, or a solicitation to buy or sell any financial instrument or cryptocurrency. The analysis provided is not indicative of future results. Investing in crypto assets and financial markets carries a high risk of capital loss. Always do your own research (DYOR) and consult a qualified financial advisor before making any decision.
Article produced with the assistance of artificial intelligence and reviewed by the editorial team.


 English (US) ·