
 2 hours ago
12
2 hours ago
12

Palantir Technologies Inc. stock remains firmly bullish, closing at 179.89. Buyers still control the tape after a session range of 172.56 to 182.42. Yet overbought daily momentum and cooling short-term signals complicate the near-term outlook.
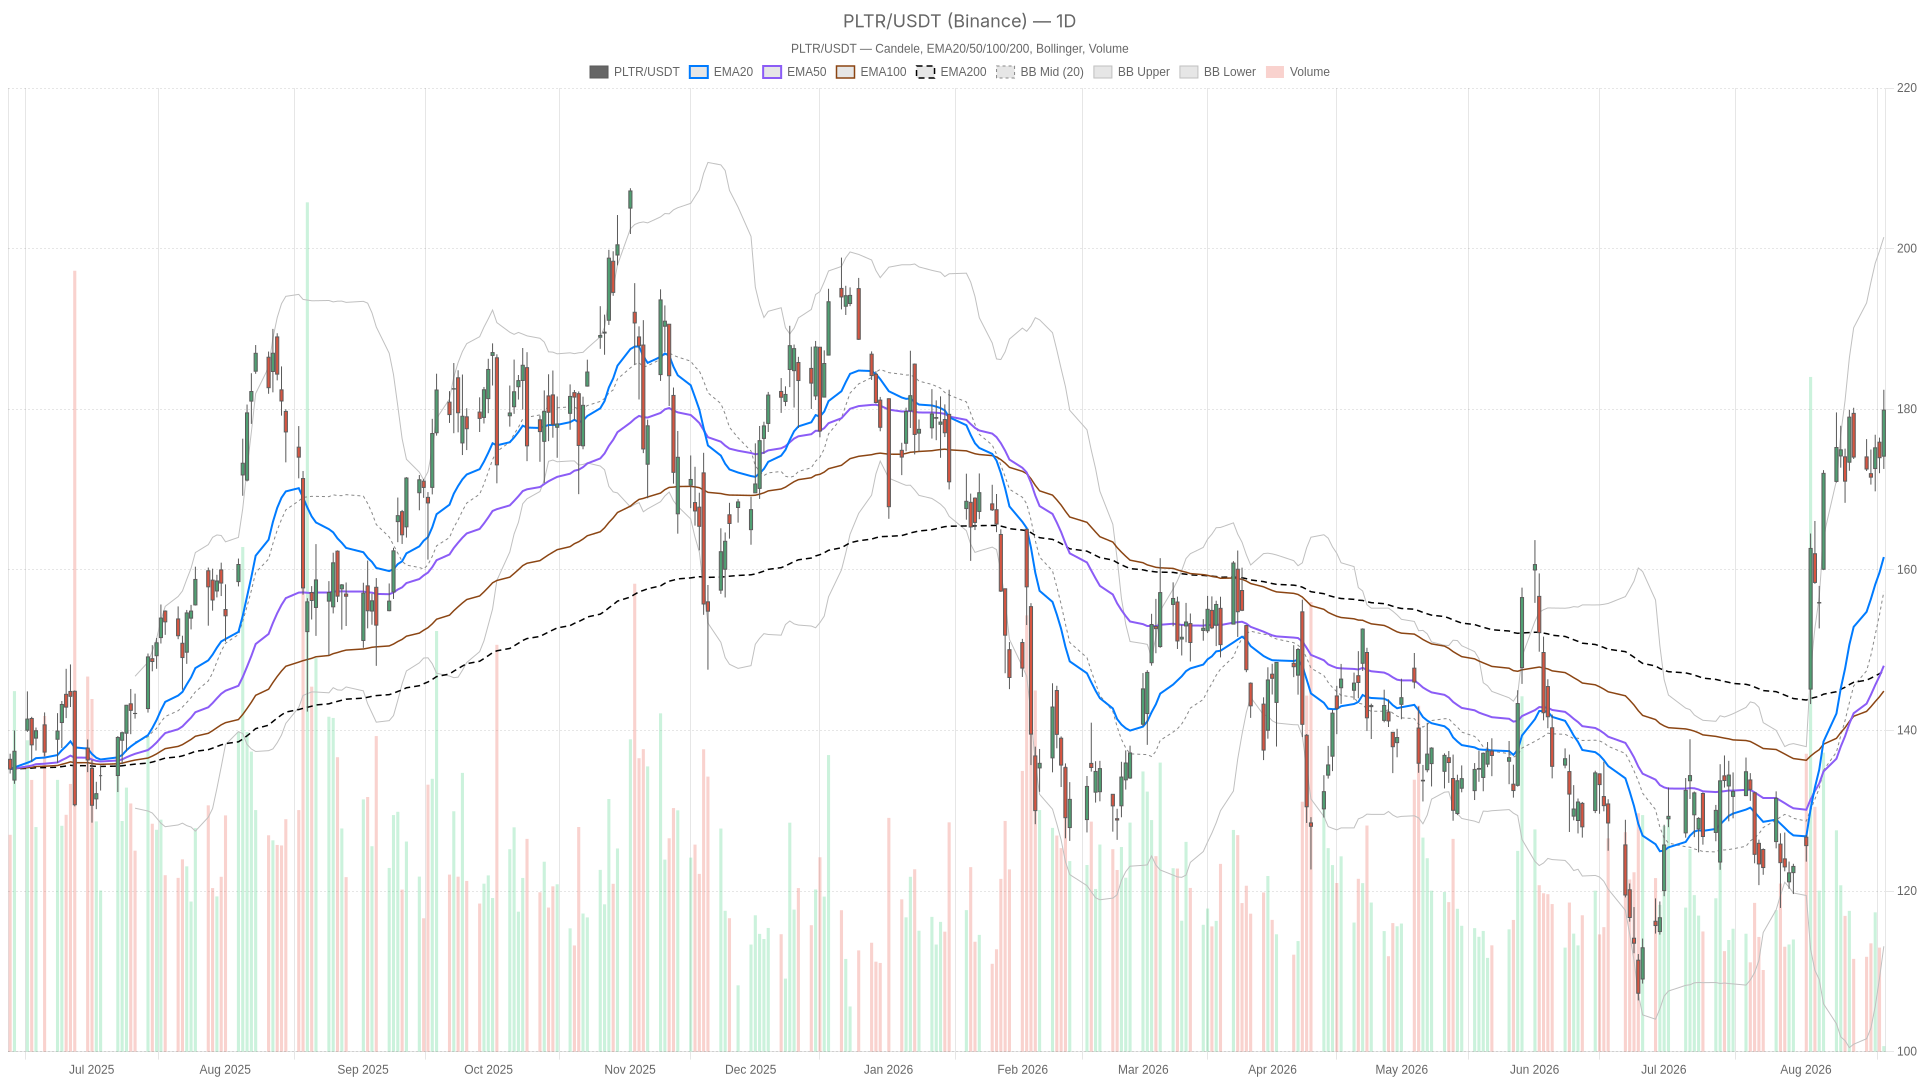 PLTR — daily chart with candlesticks, EMA20/EMA50 and volume.
Key takeaways
- Palantir Technologies Inc. stock closed at 179.89, with the daily trend firmly bullish above the 20, 50, and 200-period EMAs.
- Daily RSI14 sits at 69.38, just shy of the overbought threshold of 70, suggesting the easiest gains may be behind.
- The 1H chart confirms the bullish structure, but price presses near the upper Bollinger Band at 180.86, hinting at a short-term pause.
- The 15-minute MACD histogram has turned negative (−0.18), signaling momentum cooling on the smallest timeframe.
- A break above 184.02 (daily R1) would reaccelerate the rally; failure at 174.16 (S1) would weaken the bullish case.
Daily Structure: Trend Strength Meets Overbought Risk
The daily chart confirms a bullish regime for Palantir Technologies Inc. stock, with price trading well above all three key moving averages and the indicator engine backing that assessment.
Notably, the moving average stack is about as clean as it gets. The 20-period EMA sits at 161.59. The 50-period is at 148.05 and the 200-period at 147.39. Price trades well above all three. That separation reflects a stock in strong accumulation mode, not one grinding sideways. The daily indicator engine labels the regime as bullish, and the price action backs it up.
However, momentum readings are starting to flash caution. The daily RSI14 sits at 69.38, just shy of the overbought threshold near 70. That does not mean a reversal is imminent. But it suggests the easy gains may be behind rather than ahead in the near term. MACD on the daily remains constructive. The line at 12.05 stands above the signal at 10.96. A histogram of 1.09 confirms momentum is still positive, even if it is not accelerating aggressively.
Momentum and Volatility: A Closer Look
The Bollinger Band setup adds another layer to this story. The mid-band sits at 157.27, with the upper band at 201.42. The lower band is down at 113.12. Price closing near 179.89 places it well above the mid-band. Yet it remains short of the upper boundary. This leaves room for further upside before the band becomes a technical ceiling. Meanwhile, the ATR14 reading of 9.61 confirms daily ranges have widened considerably. For traders tracking Palantir stock, rising volatility signals that moves in either direction can happen quickly.
Meanwhile, daily pivot levels frame the near-term battle zones clearly. The pivot point sits at 178.29. Resistance stands at 184.02 (R1) and support at 174.16 (S1). Price closing above the pivot at 179.89 keeps the bias tilted toward the bulls. A push through 184.02 would open the door to further extension.
1H Timeframe: Confirmation With a Cooling Undertone
On the hourly chart, the picture largely confirms the daily bullish bias for Palantir stock, though signs of cooling are emerging near key resistance.
The 1H close of 179.94 sits above the EMA20 at 176.73. It also clears the EMA50 at 174.04 and the EMA200 at 154.83. This is another clean bullish stack. RSI14 on the hourly reads 62.92, which is firmly bullish. It has more breathing room than the daily reading, suggesting intraday momentum has not stretched as far.
MACD on the 1H also supports the constructive tone. The line at 1.47 sits above the signal at 0.99, with a positive histogram of 0.48. At the same time, the hourly Bollinger Bands tell a more nuanced story. Price at 179.94 presses close to the upper band at 180.86. The mid-band sits at 176.3 and the lower band at 171.74. That proximity to the upper band often precedes short pauses or consolidation, even within an intact uptrend. The hourly ATR14 of 2.31 indicates volatility has calmed relative to the daily scale, which is typical when a strong move starts to digest recent gains.
Hourly pivots reinforce this near-term tug-of-war. The pivot point is at 179.82. Resistance sits at 180.88 (R1) and support at 178.88 (S1). Price sits essentially right at the pivot, just below immediate resistance. In other words, the 1H timeframe confirms the broader bullish structure but hints the market is pausing just under a key level.
15-Minute Execution Context
Zooming into the 15-minute chart, the regime remains tagged bullish, though early signs of momentum fatigue are appearing on the smallest timeframe.
Price closed at 179.94, above the EMA20 at 178.94. It also sits above the EMA50 at 177.37 and the EMA200 at 174.18. RSI14 at 60.57 is comfortably bullish without being stretched. Notably, the 15m MACD shows the line at 0.81 dipping just below the signal at 0.98. This produces a slightly negative histogram of −0.18. It is a short-term momentum wobble, not a trend reversal. Still, it aligns with the hourly signs of hesitation near resistance.
Meanwhile, the 15m Bollinger Bands show price at 179.94 sitting almost exactly on the mid-band of 179.69. The upper band is at 181.71 and the lower band at 177.68. Combined with an ATR14 of just 0.9, this points to a tightening, lower-volatility environment. The market is consolidating just below hourly resistance before its next directional decision. Execution-wise, the 15m pivot at 179.87, resistance at 180.82, and support at 178.98 mark the tight range traders are navigating.
The Bullish Case for Palantir Technologies Inc. Stock
The bullish scenario rests on the daily trend remaining dominant, supported by clean EMA stacks and positive MACD readings across all timeframes.
In short, a clean EMA stack across all three timeframes argues for continuation. Positive MACD readings on daily and hourly charts reinforce the message. The regime is tagged bullish across the board. If price can clear the daily pivot resistance at 184.02 and hold above hourly resistance at 180.88, momentum would likely reaccelerate. That would push price further toward the upper Bollinger Band territory on the daily chart. The fundamental backdrop provides additional context. Recent commentary points to triple-digit growth in the U.S. commercial business. A Rule of 40 score cited at 155% accompanies rising GAAP net income margins. These themes have fueled the stock’s 33% rally over the past month.
The Bearish Risk and What Would Invalidate the Uptrend
The bearish case does not require a full trend reversal to matter; overbought conditions and cooling momentum could trigger a meaningful pullback in Palantir stock.
A daily RSI at 69.38 sits near overbought territory. Combined with the 15m MACD histogram turning negative, momentum appears to be losing steam within the broader uptrend. Should price fail to hold the daily pivot at 178.29, the bullish structure would weaken. Breaking below the S1 support at 174.16 would open the door to a deeper pullback. The next target would be the EMA20 on the daily chart near 161.59. It is also worth noting that sentiment is not uniformly bullish. Reports indicate investor Michael Burry has taken a put position against Palantir stock. Some market participants are watching this signal closely. Others argue it should not deter buyers, given the underlying growth trajectory.
Closing Take
Overall, the multi-timeframe picture for Palantir Technologies Inc. stock remains constructive but not without friction. The daily and hourly charts both confirm a bullish regime with strong trend alignment. Meanwhile, the 15-minute chart shows early signs of short-term momentum cooling just beneath key resistance levels. This combination—a strong trend paired with stretched daily momentum and rising ATR volatility—calls for discipline rather than complacency.
Given elevated ATR readings across timeframes and the proximity to both daily overbought conditions and hourly resistance, further two-way volatility is expected in the sessions ahead. For now, the broader trend in Palantir stock favors the bulls. But the setup argues for close attention to how price behaves around the 178–184 zone before the next leg higher is confirmed.
FAQ
Is Palantir Technologies Inc. stock overbought right now?
The daily RSI14 sits at 69.38, just below the classic overbought threshold of 70. While not technically overbought, it signals the stock is approaching stretched levels. The hourly RSI14 at 62.92 offers more room for upside on shorter timeframes.
What are the key support levels for Palantir stock?
The daily pivot sits at 178.29, with S1 support at 174.16. Below that, the EMA20 at 161.59 serves as the next major support zone within the ongoing bullish structure. A break below S1 would meaningfully weaken the bullish case.
What would invalidate the bullish trend in Palantir Technologies Inc. stock?
A failure to hold the daily pivot at 178.29 combined with a break below S1 at 174.16 would weaken the bullish structure considerably. That scenario could open the door to a deeper pullback toward the EMA20 near 161.59.
What is the bullish price target for PLTR?
If price clears the daily pivot resistance at 184.02 and holds above the hourly resistance at 180.88, momentum would likely reaccelerate. This could push price toward the upper daily Bollinger Band at 201.42, which represents the next technical ceiling.
Disclaimer: This article is for informational purposes only and does not constitute financial advice, an investment recommendation, or a solicitation to buy or sell any financial instrument or cryptocurrency. The analysis provided is not indicative of future results. Investing in crypto assets and financial markets carries a high risk of capital loss. Always do your own research (DYOR) and consult a qualified financial advisor before making any decision.
Article produced with the assistance of artificial intelligence and reviewed by the editorial team.








 English (US) ·