
 1 month ago
42
1 month ago
42

Pfizer (PFE) stock is holding just above $25 in a tight decision zone. The daily chart remains neutral, while shorter-term timeframes have turned more constructive. The stock closed at $25.03 after Pfizer raised its full-year revenue guidance midpoint, setting up a critical test ahead of Q2 earnings.
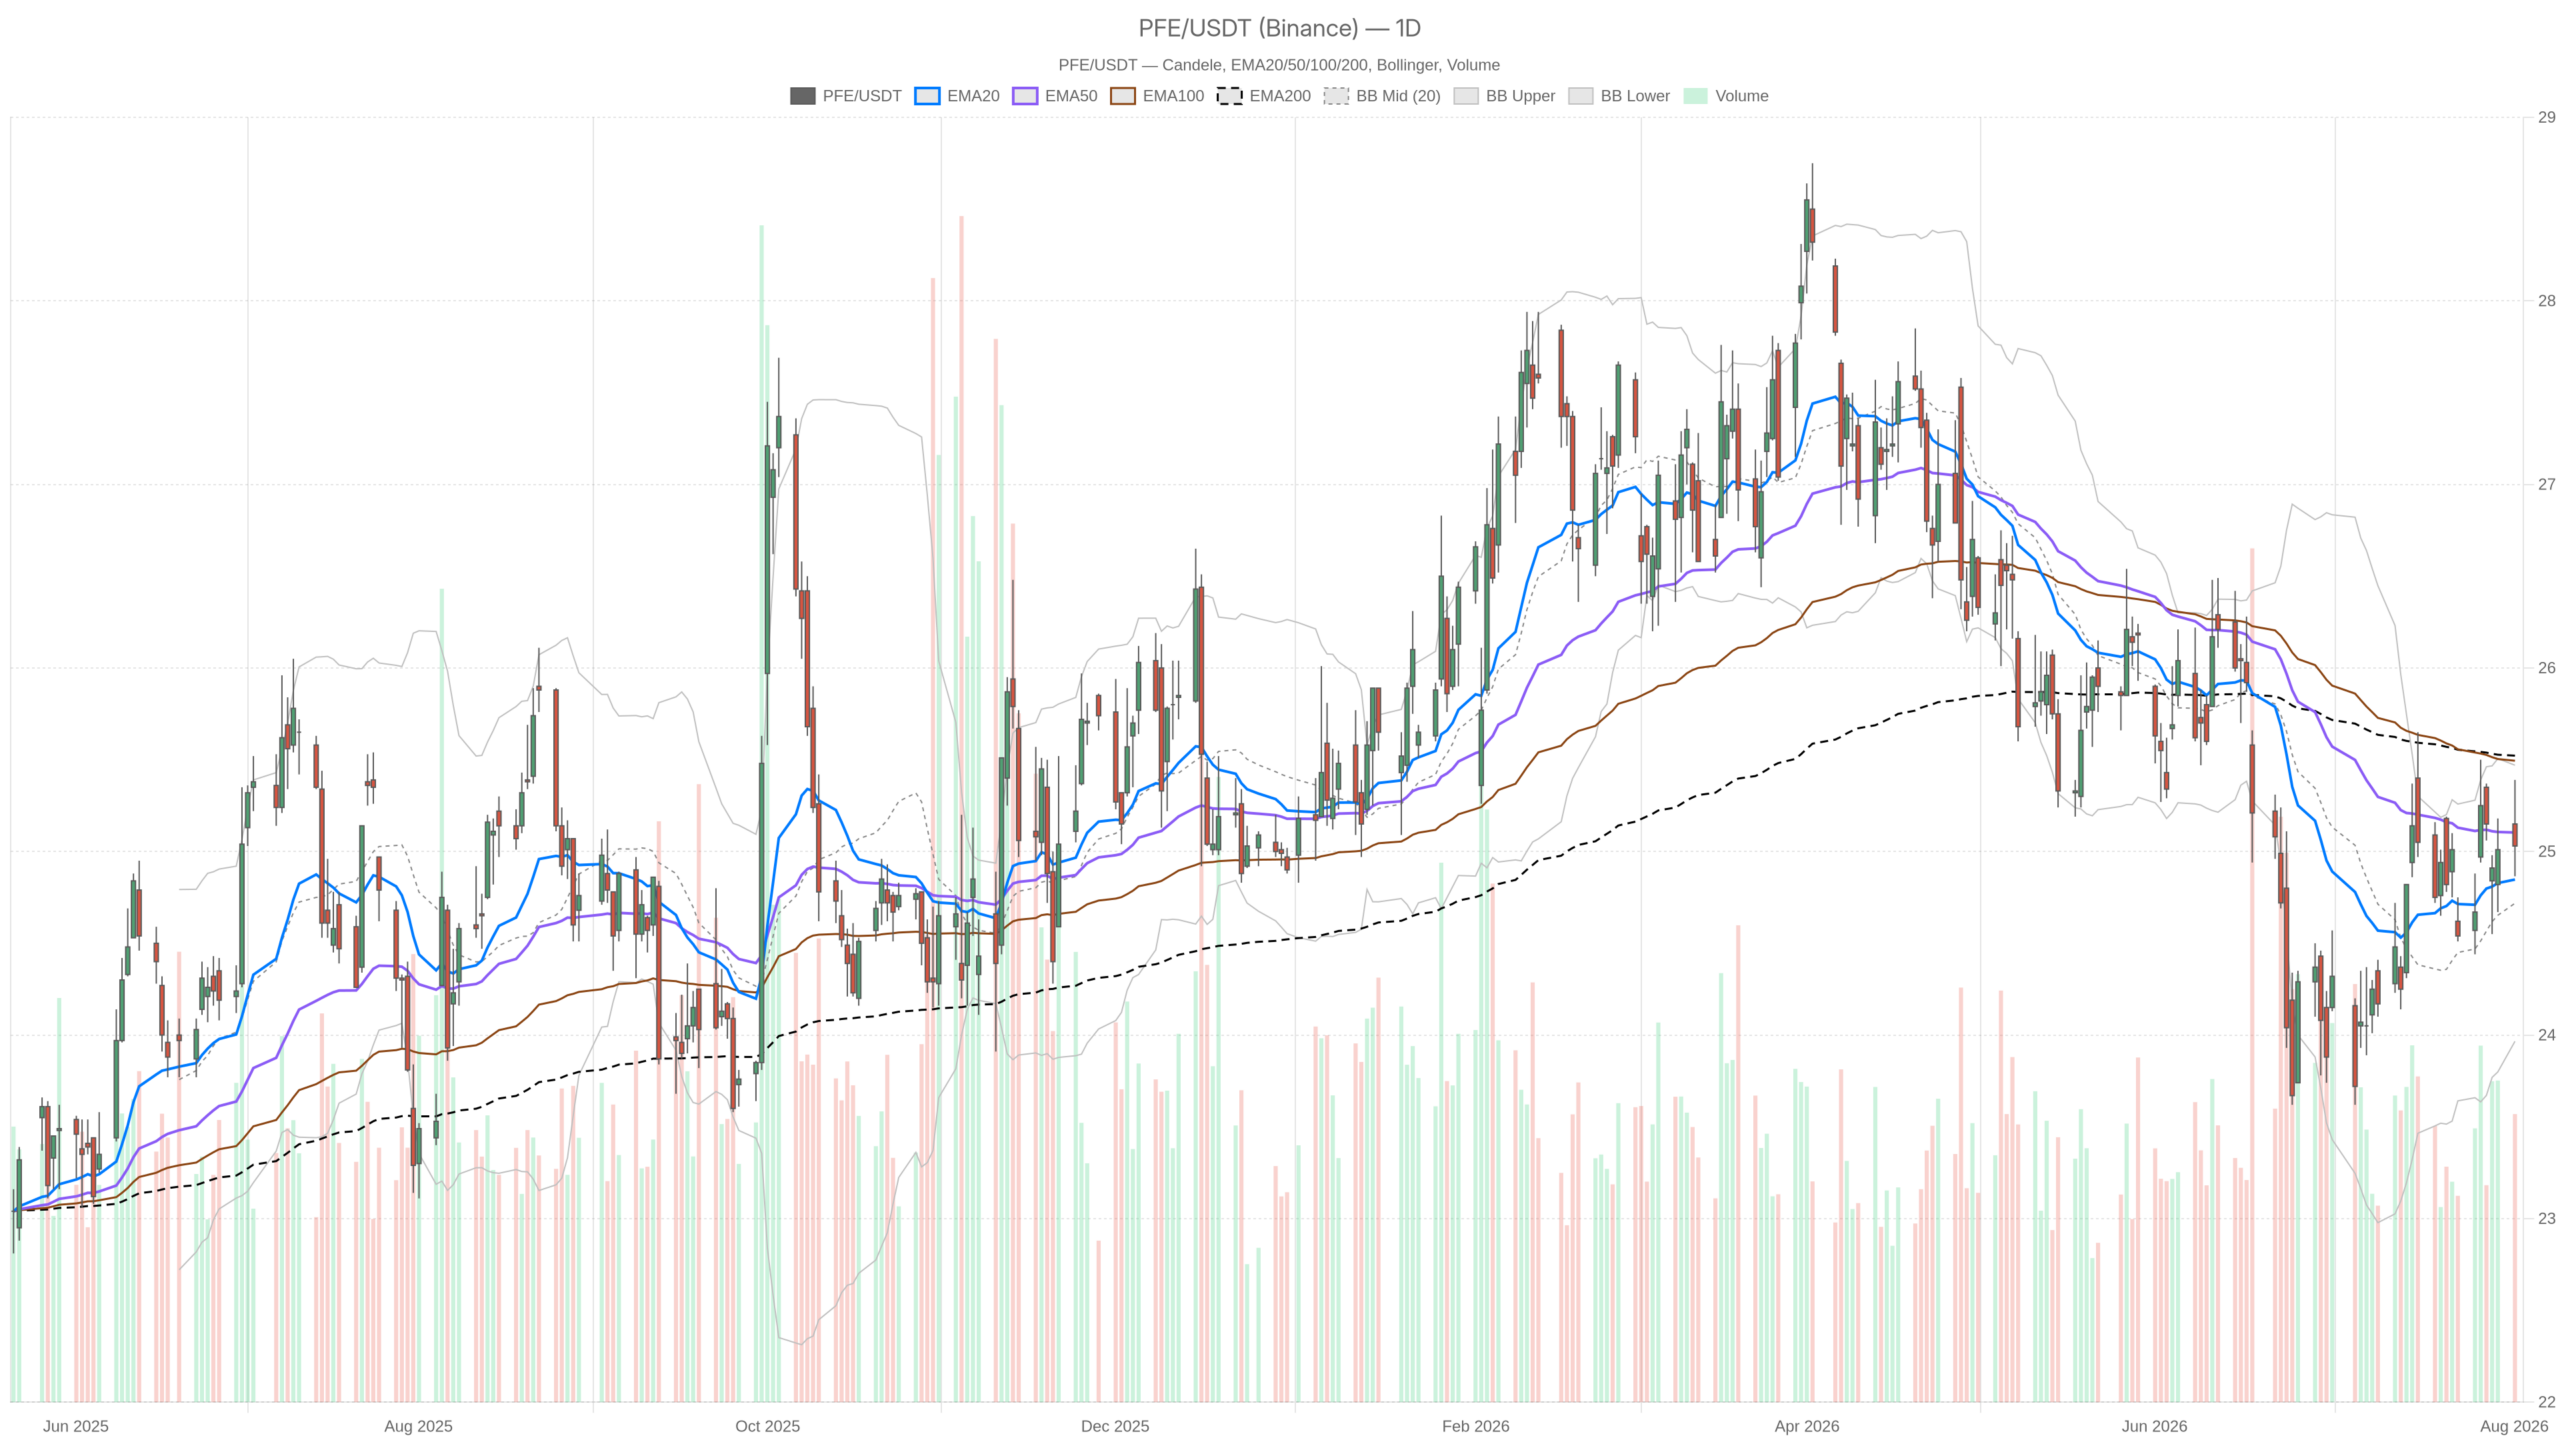 PFE — daily chart with candlesticks, EMA20/EMA50 and volume.
Key takeaways
- PFE closed at $25.03, above the 20-day EMA ($24.85) but below the 50-day EMA ($25.10) and 200-day EMA ($25.52).
- The hourly chart displays a bullish EMA stack, with price above all three key moving averages.
- Daily RSI14 reads 52.57 — neutral — while the MACD histogram has turned positive at 0.07.
- Pfizer raised the midpoint of its full-year revenue guidance just ahead of its Q2 earnings report.
- Immediate support sits at $24.80; a break above $25.33 resistance would align the daily structure with the bullish hourly regime.
Daily Trend: Pfizer PFE Stock Remains Neutral
Pfizer PFE stock remains in a neutral daily regime. Short-term buyers have regained some control, but the broader trend has not yet flipped bullish. Price sits above one key average, yet two longer-term ones still cap upside movement.
Price closed at $25.03, sitting above the 20-day EMA at $24.85. However, it remains below the 50-day EMA at $25.10 and the 200-day EMA at $25.52. That layering tells a clear story: the longer-term averages still act as resistance. The stock stays beneath them, keeping the daily regime classified as neutral rather than trending.
RSI14 on the daily timeframe reads 52.57, comfortably in neutral territory with no overbought or oversold extreme. Meanwhile, the MACD offers a slightly more encouraging signal. The MACD line sits at 0.04 against a signal line of -0.04, producing a positive histogram of 0.07. That is an early sign daily momentum is turning upward, even if the trend shift remains unconfirmed.
Bollinger Bands show the mid-band at $24.72, with the upper band at $25.47 and the lower band at $23.97. Price is trading in the upper half of that range, closer to resistance than support. This suggests the recent push higher has room before becoming technically stretched. Daily ATR14 stands at $0.51, a moderate reading pointing to normal, unspectacular volatility.
The daily pivot sits at $25.10, with resistance at $25.33 (R1) and support at $24.80 (S1). Price hovers just below the pivot itself. The stock has not yet cleared the level that would tilt the daily bias more firmly bullish.
Hourly Momentum Adds a Bullish Layer
The hourly chart paints a more constructive picture for Pfizer PFE stock. The 1-hour timeframe shows a textbook bullish EMA alignment, with the regime label itself reading bullish. Near-term buyer control is confirmed by a clean moving-average stack.
Price closed at $25.05, above the 20-hour EMA ($24.99), the 50-hour EMA ($24.96), and the 200-hour EMA ($24.86). That clean stacking from shortest to longest confirms buyers are in control. RSI14 at 53.25 supports this read without pushing into overbought territory. There is still room for the move to extend.
Notably, the MACD on the 1-hour chart is essentially flat. The line, signal, and histogram all sit at 0.00. In other words, momentum has turned structurally bullish through the EMA stack. However, the acceleration behind that move has not yet appeared in the MACD. That is a mild conflict: the trend structure says bullish, while the momentum oscillator says wait and see.
The 1-hour Bollinger Bands show the mid-band at $24.95, upper at $25.19, and lower at $24.71. Price sits comfortably in the upper portion of that range. ATR14 on this timeframe is $0.16. The pivot sits at $25.03, with resistance at $25.12 and support at $24.95. Price is trading right at the pivot-to-resistance zone, keeping the near-term path open but not yet confirmed.
15-Minute Execution: Waiting for a Trigger
The 15-minute chart shows Pfizer PFE stock in a tight consolidation phase. Traders are waiting for a catalyst. The very short-term picture is compressed rather than trending, with moving averages converging in a classic pause pattern.
All three EMAs — 20, 50, and 200-period — have converged at $24.98. This signals a market digesting its recent move rather than extending it. RSI14 reads 57.09, mildly constructive but not aggressive. The MACD histogram is barely positive at 0.01. The regime on this timeframe is labeled neutral, reinforcing the holding-pattern dynamic.
Notably, the 15-minute Bollinger Bands are tight. The mid-band sits at $24.95, with the upper at $25.05 and the lower at $24.86. Price closing at $25.05 puts it right against the upper band. This signals short-term strength but also a squeeze that often precedes a sharper directional move once a catalyst arrives.
With ATR14 at just $0.06, volatility on this timeframe is compressed. This is consistent with a market waiting for the next headline — likely the Q2 earnings print — to set direction. The 15-minute pivot at $25.04, with resistance at $25.11 and support at $24.97, frames the immediate battle zone for intraday positioning.
News Backdrop: Guidance Up, Legacy Headwinds Persist
Pfizer’s fundamental picture creates real tension heading into earnings. The company raised its full-year revenue guidance midpoint, yet analysts still expect EPS declines this quarter. That tension between top-line optimism and bottom-line pressure is the central question hanging over Pfizer stock right now.
The guidance upgrade lands directly ahead of the Q2 report. Meanwhile, earnings previews from Seeking Alpha and Yahoo Finance flag that new growth bets and the Keytruda strategy are positioned as potential offsets to legacy headwinds. At the same time, the improved top-line outlook has not yet quieted concerns about pressured earnings.
Longer-term investors are still nursing a difficult stretch. The Motley Fool notes the stock has been a five-year “dud.” Yahoo Finance points out Pfizer has declined 27.7% over the past five years, leaving long-term holders underwater. Yahoo also frames current valuation as closer to fair than clearly cheap. This marks a shift from the deep-value narrative that had surrounded the stock.
For income-focused investors, the 6.9% dividend yield cited by the Motley Fool remains a central part of the bull case. This holds even as the share price itself has struggled to recover ground.
Bullish Scenario for Pfizer PFE Stock
The bullish case for Pfizer PFE stock hinges on the daily chart confirming what the hourly chart is already showing. A break above key resistance would align both timeframes. The path is visible, but it requires a catalyst to trigger.
If price can clear the daily pivot at $25.10 and push through resistance at $25.33, that would align the daily structure with the already-bullish hourly regime. A further reclaim of the 200-day EMA at $25.52 would be the more meaningful signal. It would flip the longer-term trend bias rather than just the short-term one.
Positive follow-through from the raised revenue guidance would give this move fundamental backing. An EPS outcome that beats lowered expectations would add conviction. Without that, any technical breakout risks lacking sustainability.
Bearish Scenario and What Would Invalidate the Setup
The bearish risk for Pfizer PFE stock is straightforward. Failure to hold key support would undercut the short-term strength built on the hourly chart. The broader downtrend would then reassert itself, pulling price back toward lower levels.
A break below the daily 20-EMA at $24.85, or a drop through daily support at $24.80, would signal that the recent bounce has failed. A deeper slide toward the daily lower Bollinger Band at $23.97 would confirm the failure. The 200-day EMA sitting well above current price would then reassert its gravitational pull.
On the fundamental side, confirmation of the expected EPS decline would likely be the catalyst. Commentary suggesting legacy headwinds are outweighing new product launches would reinforce the bearish technical picture. The tension between guidance optimism and earnings reality remains unresolved.
Closing Take: Pfizer PFE Stock at an Inflection Point
Pfizer PFE stock sits at an inflection point where technical structure and fundamental catalysts are converging. The daily chart remains neutral, the hourly chart leans bullish, and the 15-minute chart is compressed and waiting. This combination typically precedes a volatility expansion rather than a quiet drift.
With Q2 earnings and the raised revenue guidance both in focus, near-term price action will likely be driven as much by the report itself as by the current technical setup. Given the mixed signals across timeframes, awareness of both the $24.80 support and $25.33 resistance zones will matter more than usual in the sessions ahead.
FAQ
Is Pfizer PFE stock in a bullish or bearish trend right now?
The daily chart remains neutral, with price above the 20-day EMA but below the 50-day and 200-day EMAs. However, the hourly chart shows a bullish EMA alignment, suggesting short-term momentum is improving. The broader trend has not yet flipped decisively bullish, making this a transition phase rather than a confirmed uptrend.
What key levels should traders watch on Pfizer stock?
Immediate support sits at $24.80 (daily S1), with the 20-day EMA at $24.85 providing an additional cushion. On the upside, resistance stands at $25.33 (daily R1), with the 200-day EMA at $25.52 representing a more significant reclaim level. The daily pivot at $25.10 marks the near-term threshold between neutral and bullish bias.
What fundamental catalysts are driving Pfizer stock right now?
Pfizer raised the midpoint of its full-year revenue guidance ahead of its Q2 earnings report. However, analysts still expect EPS declines this quarter. The tension between improved top-line outlook and pressured bottom-line expectations is the central question ahead of earnings. New growth bets and the Keytruda strategy are positioned as potential offsets to legacy headwinds.
What is Pfizer’s dividend yield and long-term performance?
Pfizer offers a 6.9% dividend yield, as cited by the Motley Fool. This remains a central part of the bull case for income-focused investors. However, the stock has declined 27.7% over the past five years, leaving long-term holders underwater. Current valuation is now framed as closer to fair than clearly cheap.
Disclaimer: This article is for informational purposes only and does not constitute financial advice, an investment recommendation, or a solicitation to buy or sell any financial instrument or cryptocurrency. The analysis provided is not indicative of future results. Investing in crypto assets and financial markets carries a high risk of capital loss. Always do your own research (DYOR) and consult a qualified financial advisor before making any decision.
Article produced with the assistance of artificial intelligence and reviewed by the editorial team.







 English (US) ·