
 3 months ago
33
3 months ago
33
Traders face a mixed tape as Ripple price today sits near 1.36 on the daily pivot, with risk-off tone persisting (Fear & Greed at 30 and BTC dominance around 58%), while an intraday bounce meets the prevailing downtrend.
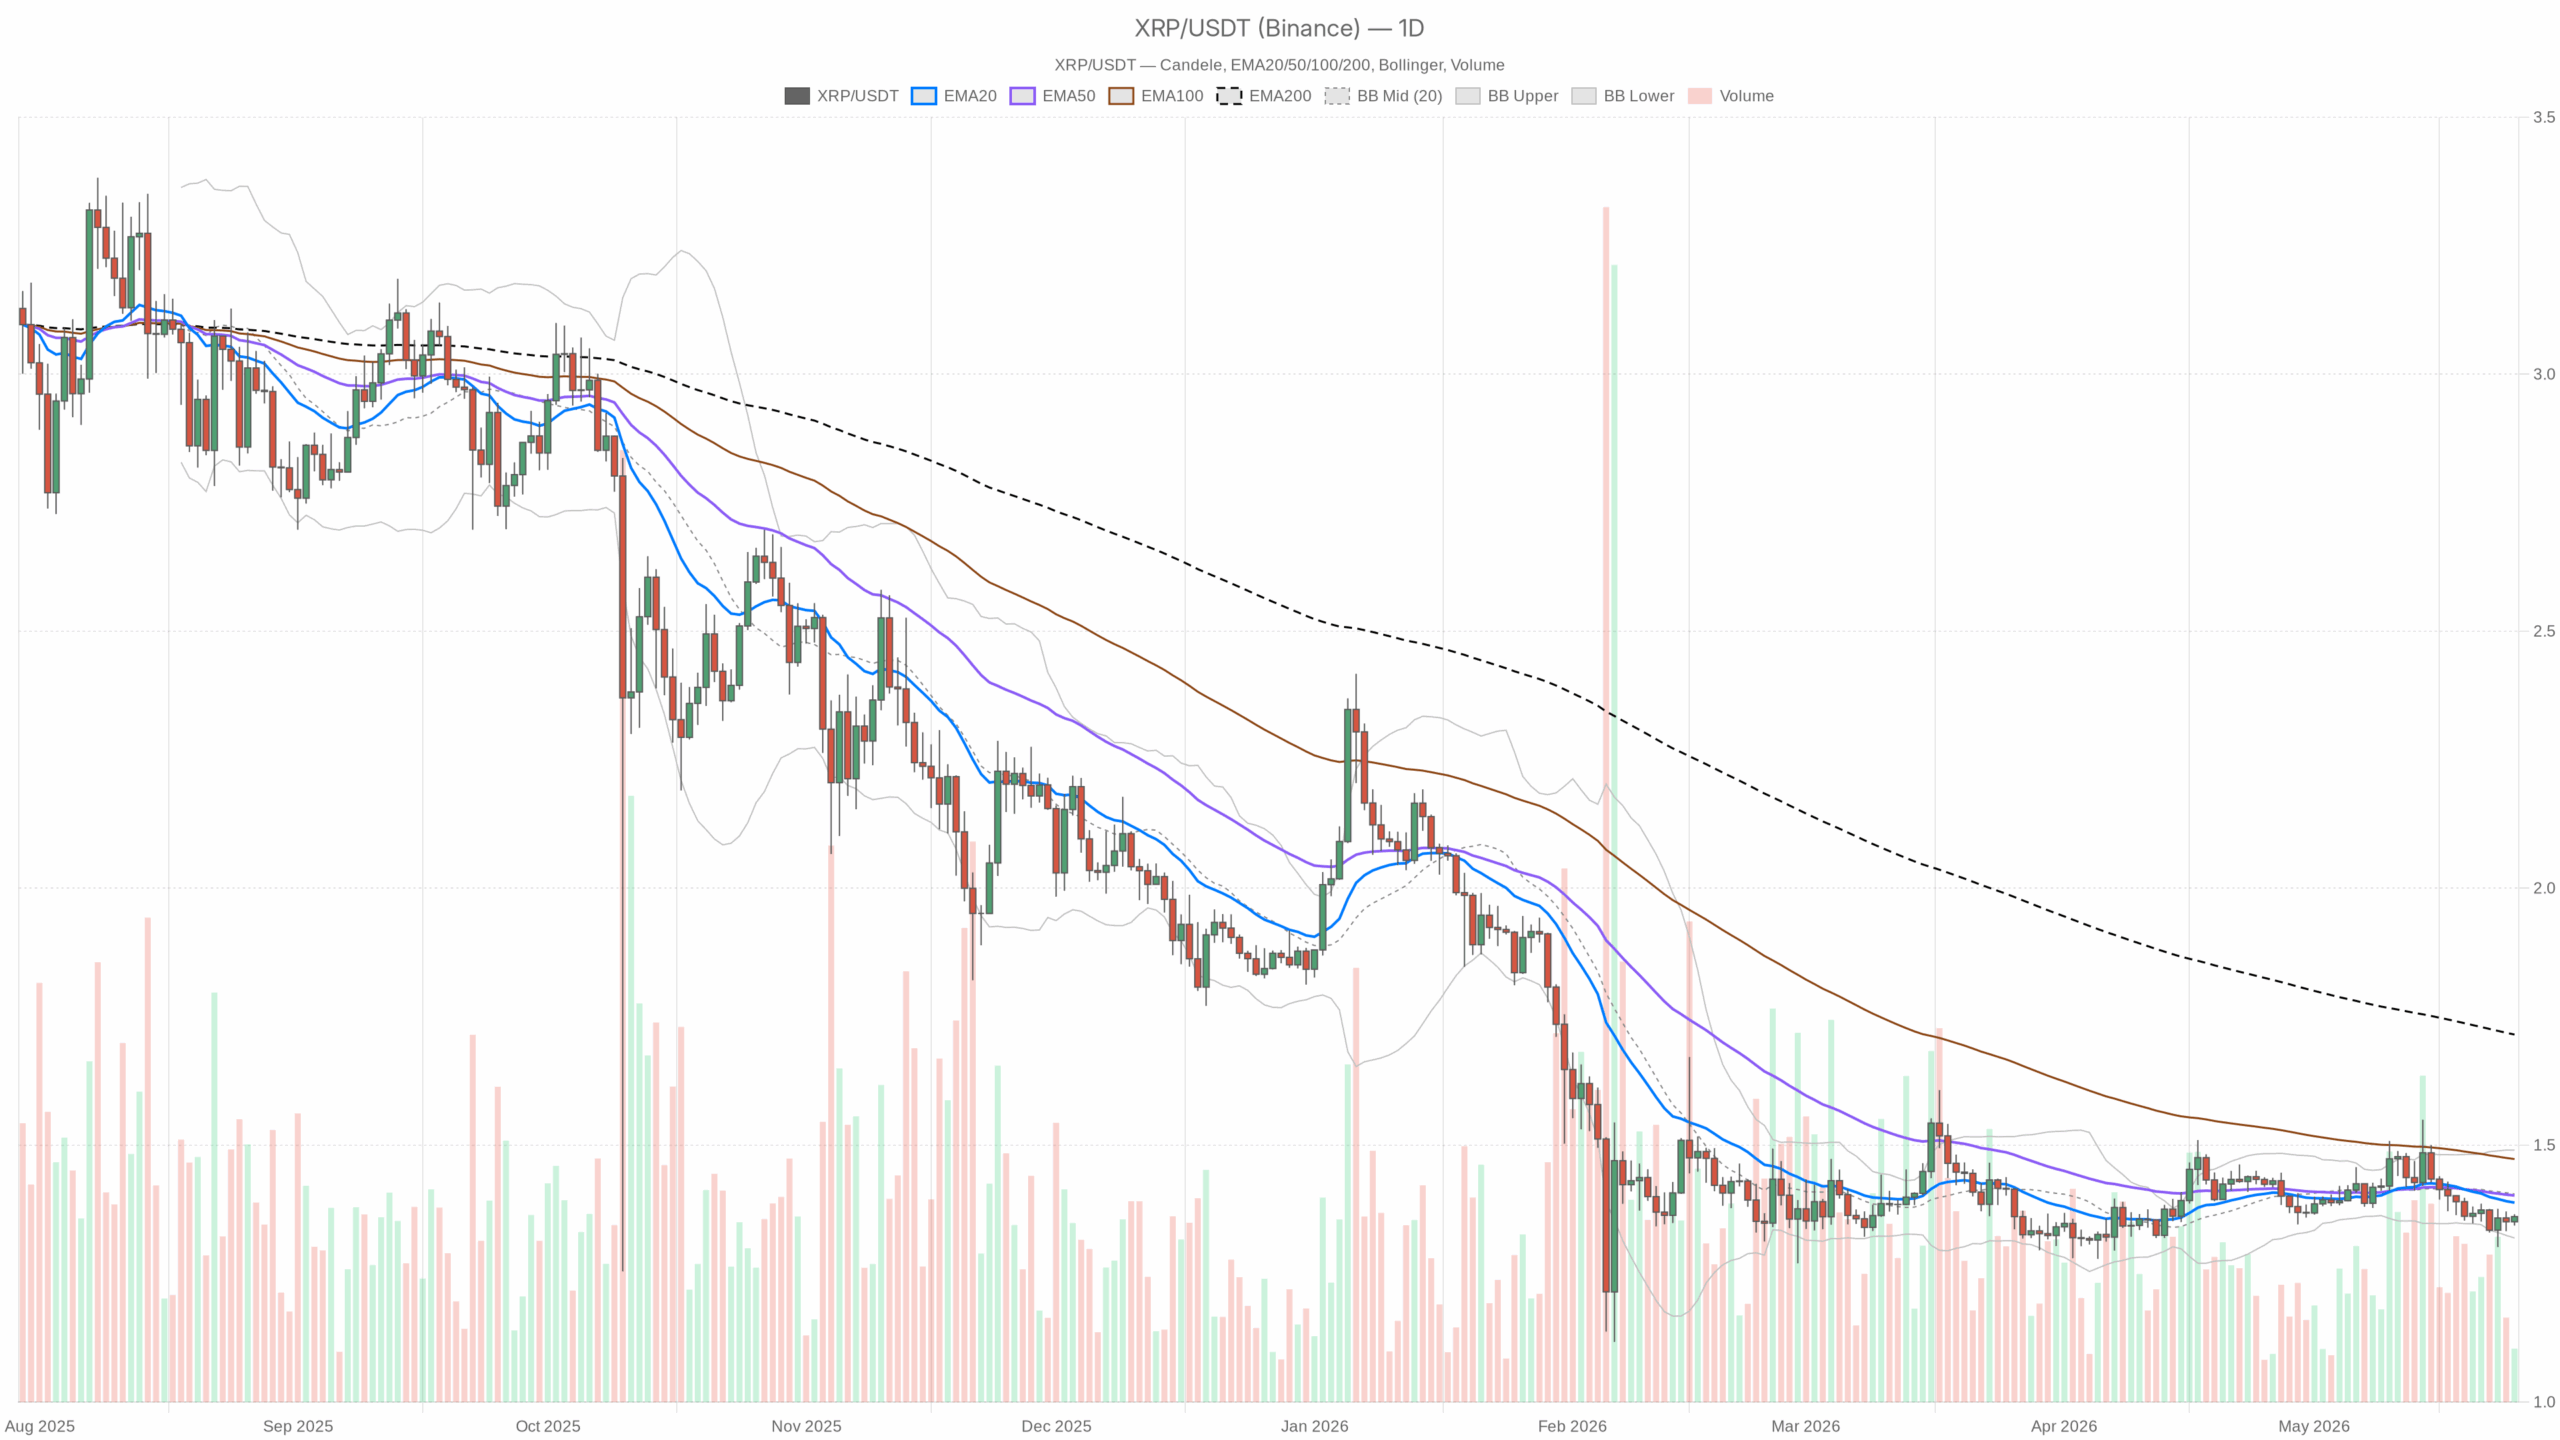 XRP/USDT — daily chart with candlesticks, EMA20/EMA50 and volume.
Market logic
However, the dominant force is a mean-reversion pop running into a well-defined daily downtrend. In plain terms: buyers have intraday control, but higher timeframes still own the tape.
Moreover, this moment matters as XRP is boxed between 1.35–1.37 and heavier daily supply at 1.39–1.40. As of 25 May 2026, a break from this micro-range likely sets the next 1–2 day path. That said, only a daily close through the 20/50-day cluster would shift the bigger story.
- Trend vs. mean reversion: Daily structure remains bearish; the current uptick looks like a bounce toward resistance, not a fresh uptrend.
- Momentum vs. structure: Hourly momentum has improved, but it is pressing into the H1 200-EMA and the D1 20/50 zone. Until those give way, structure trumps momentum.
- Risk appetite: With fear elevated and BTC dominance high, altcoin rallies are easier to fade unless they punch through resistance with conviction.
Multi-timeframe view
Daily (macro bias): Bearish. Price sits below the 20/50/200-day EMAs, and momentum is subdued. The 1.39–1.40 belt is the ceiling that matters for a trend shift, and Ripple price today reflects that bearish structure.
1H (tactical): Neutral-to-bullish. Meanwhile, XRP is above the H1 20/50 EMAs (~1.35) but still tests the H1 200-EMA (~1.37). RSI near 60 hints buyers have the near-term edge into resistance.
However, 15m (execution) skews bullish. EMAs are positively aligned and RSI is in the 60s, favoring attempts to probe 1.37. However, without higher-timeframe validation, breakouts can stall quickly.
Key indicators (D1) — with context
- EMA(20/50/200): 1.39 / 1.40 / 1.72; price is below all three — rallies into 1.39–1.40 meet supply, keeping the trend bearish.
- RSI(14): 44.0; weak side of neutral — bears have the advantage, but there is room for a bounce before conditions get stretched.
- MACD: line -0.01, signal -0.01, hist -0.01; flat and slightly negative — momentum is not driving a decisive trend; bears hold a small edge while under zero.
- Bollinger Bands: mid 1.40, upper 1.49, lower 1.32; price is in the lower half — 1.32 is a plausible magnet on weakness, while 1.49 caps any surprise strength.
- ATR(14): 0.05; typical daily swings are ~3–4 cents — moves need follow-through to matter; false breaks are a risk.
- Daily pivots: PP 1.36, R1 1.37, S1 1.35; price is sitting on PP — expect a choppy 1.35–1.37 battle until a clean break.
Levels and intraday context
- Support: 1.35 (S1), then 1.32 (lower band). Pullbacks that hold above 1.35 keep the intraday bounce alive.
- Resistance: 1.37 (H1 200-EMA / R1), then 1.39–1.40 (D1 20/50-EMA cluster). That 1.39–1.40 shelf is the battleground for any trend change.
Scenarios
Bullish path (countertrend until proven otherwise): An hourly close above 1.37 unlocks a run at 1.39–1.40. A daily close back above 1.40 would flip the bias toward recovery and put 1.49 (upper band) on the map. Invalidation: losing 1.35 intraday and slipping back below 1.34 with momentum rolling over — that would mark the bounce as spent.
Conversely, bearish path (trend continuation): Rejection at 1.37–1.40 followed by a break below 1.35 opens 1.32 (lower band). With ATR at 0.05, a daily push into the low 1.3s is feasible if risk-off persists. Invalidation: sustained trade above 1.39–1.40 and a daily close holding there; bears lose control if price establishes support on top of that zone.
Positioning thoughts
Overall, the tape favors patience. For trend traders, the cleaner signal is a daily reclaim of 1.40; until then, it is still a rally-into-resistance market. For intraday participants, the 1.35–1.37 box is the arena: let price break, then use the 15m to judge acceptance or failure. Additionally, with fear elevated and BTC dominance high, respect downside tails and size accordingly.
In short, intraday strength is battling higher-timeframe resistance. Watch 1.35–1.37 for direction and 1.39–1.40 for confirmation, with a daily close above 1.40 required to signal a broader shift.




 English (US) ·