
 2 hours ago
10
2 hours ago
10
Bitcoin traded near $62,743 on Thursday morning at 8 a.m. EDT, up 1.0% over the past 24 hours as the asset consolidated inside a $61,507 to $63,116 range. Short-term technical readings point to consolidation, while longer-term moving averages continue to signal a corrective phase across the one-hour, four-hour, and daily charts.
Key Takeaways
- Bitcoin traded near $62,743 on July 9, 2026, up 1.0% over the past 24 hours.
- Market data shows Bitcoin’s market cap held at $1.259 trillion during the pullback.
- Short-term averages signal bullishness, but the 50-day average sits at $65,624.
Hourly Chart Shows Tight, Choppy Range
Bitcoin’s one-hour chart shows choppy price action inside the broader daily range, with tight support forming near $62,400 and resistance building at $62,900 to $63,000. The momentum indicator flashed a bearish signal on the shortest timeframe, suggesting some near-term exhaustion after the asset’s 1% daily gain.
Traders working intraday setups are watching for bullish interest near $62,300 to $62,500, with stops placed below $62,100, while rallies into $62,950 and above are drawing bearish interest back toward the middle of the range.
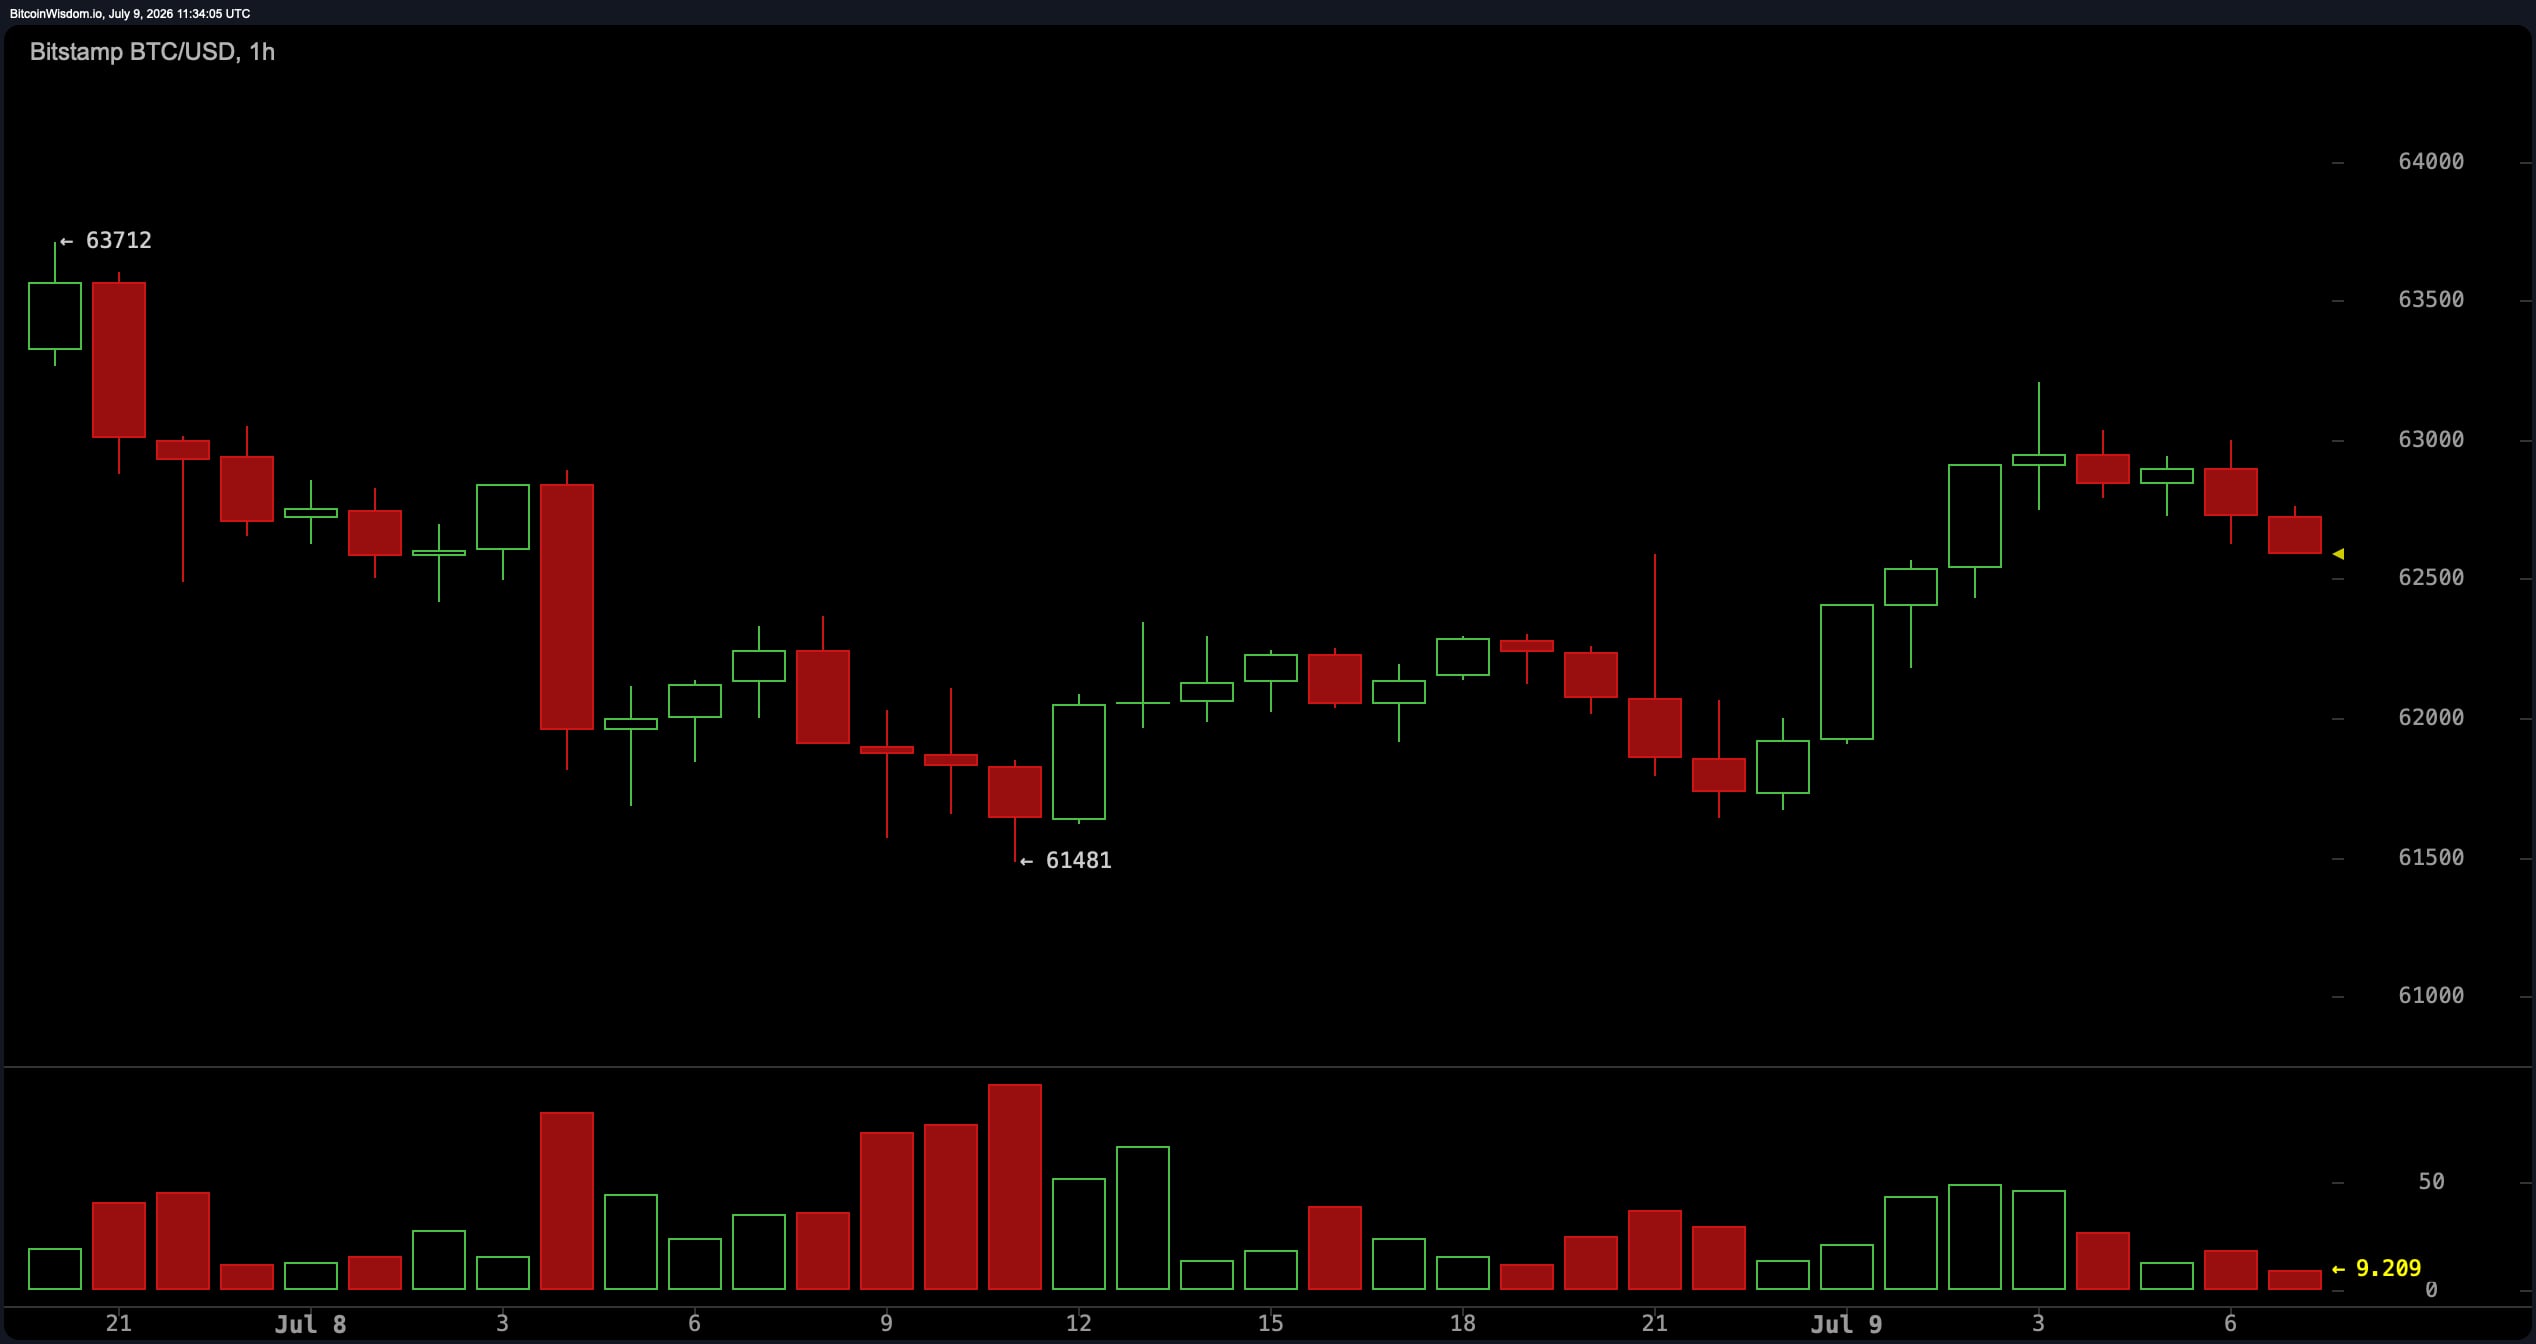 BTC/USD 1-hour chart via Bitstamp on July 9, 2026.
The overall assessment on this timeframe remains neutral and range-bound, favoring mean-reversion strategies over directional bets until price clears either extreme of the $61,800 to $63,200 band.
Four-Hour Structure Builds Toward a Resistance Test
The four-hour chart shows bitcoin attempting to recover from the lower end of its daily range, with local support holding near $62,000 to $62,200 and resistance capping gains at $63,000 to $63,200. Oscillator readings on this timeframe remain largely neutral, with the relative strength index ( RSI) near 48 and the stochastic oscillator also neutral, while the moving average convergence divergence ( MACD) is reading bullish, which lines up with short-term exponential and simple moving average crossovers.
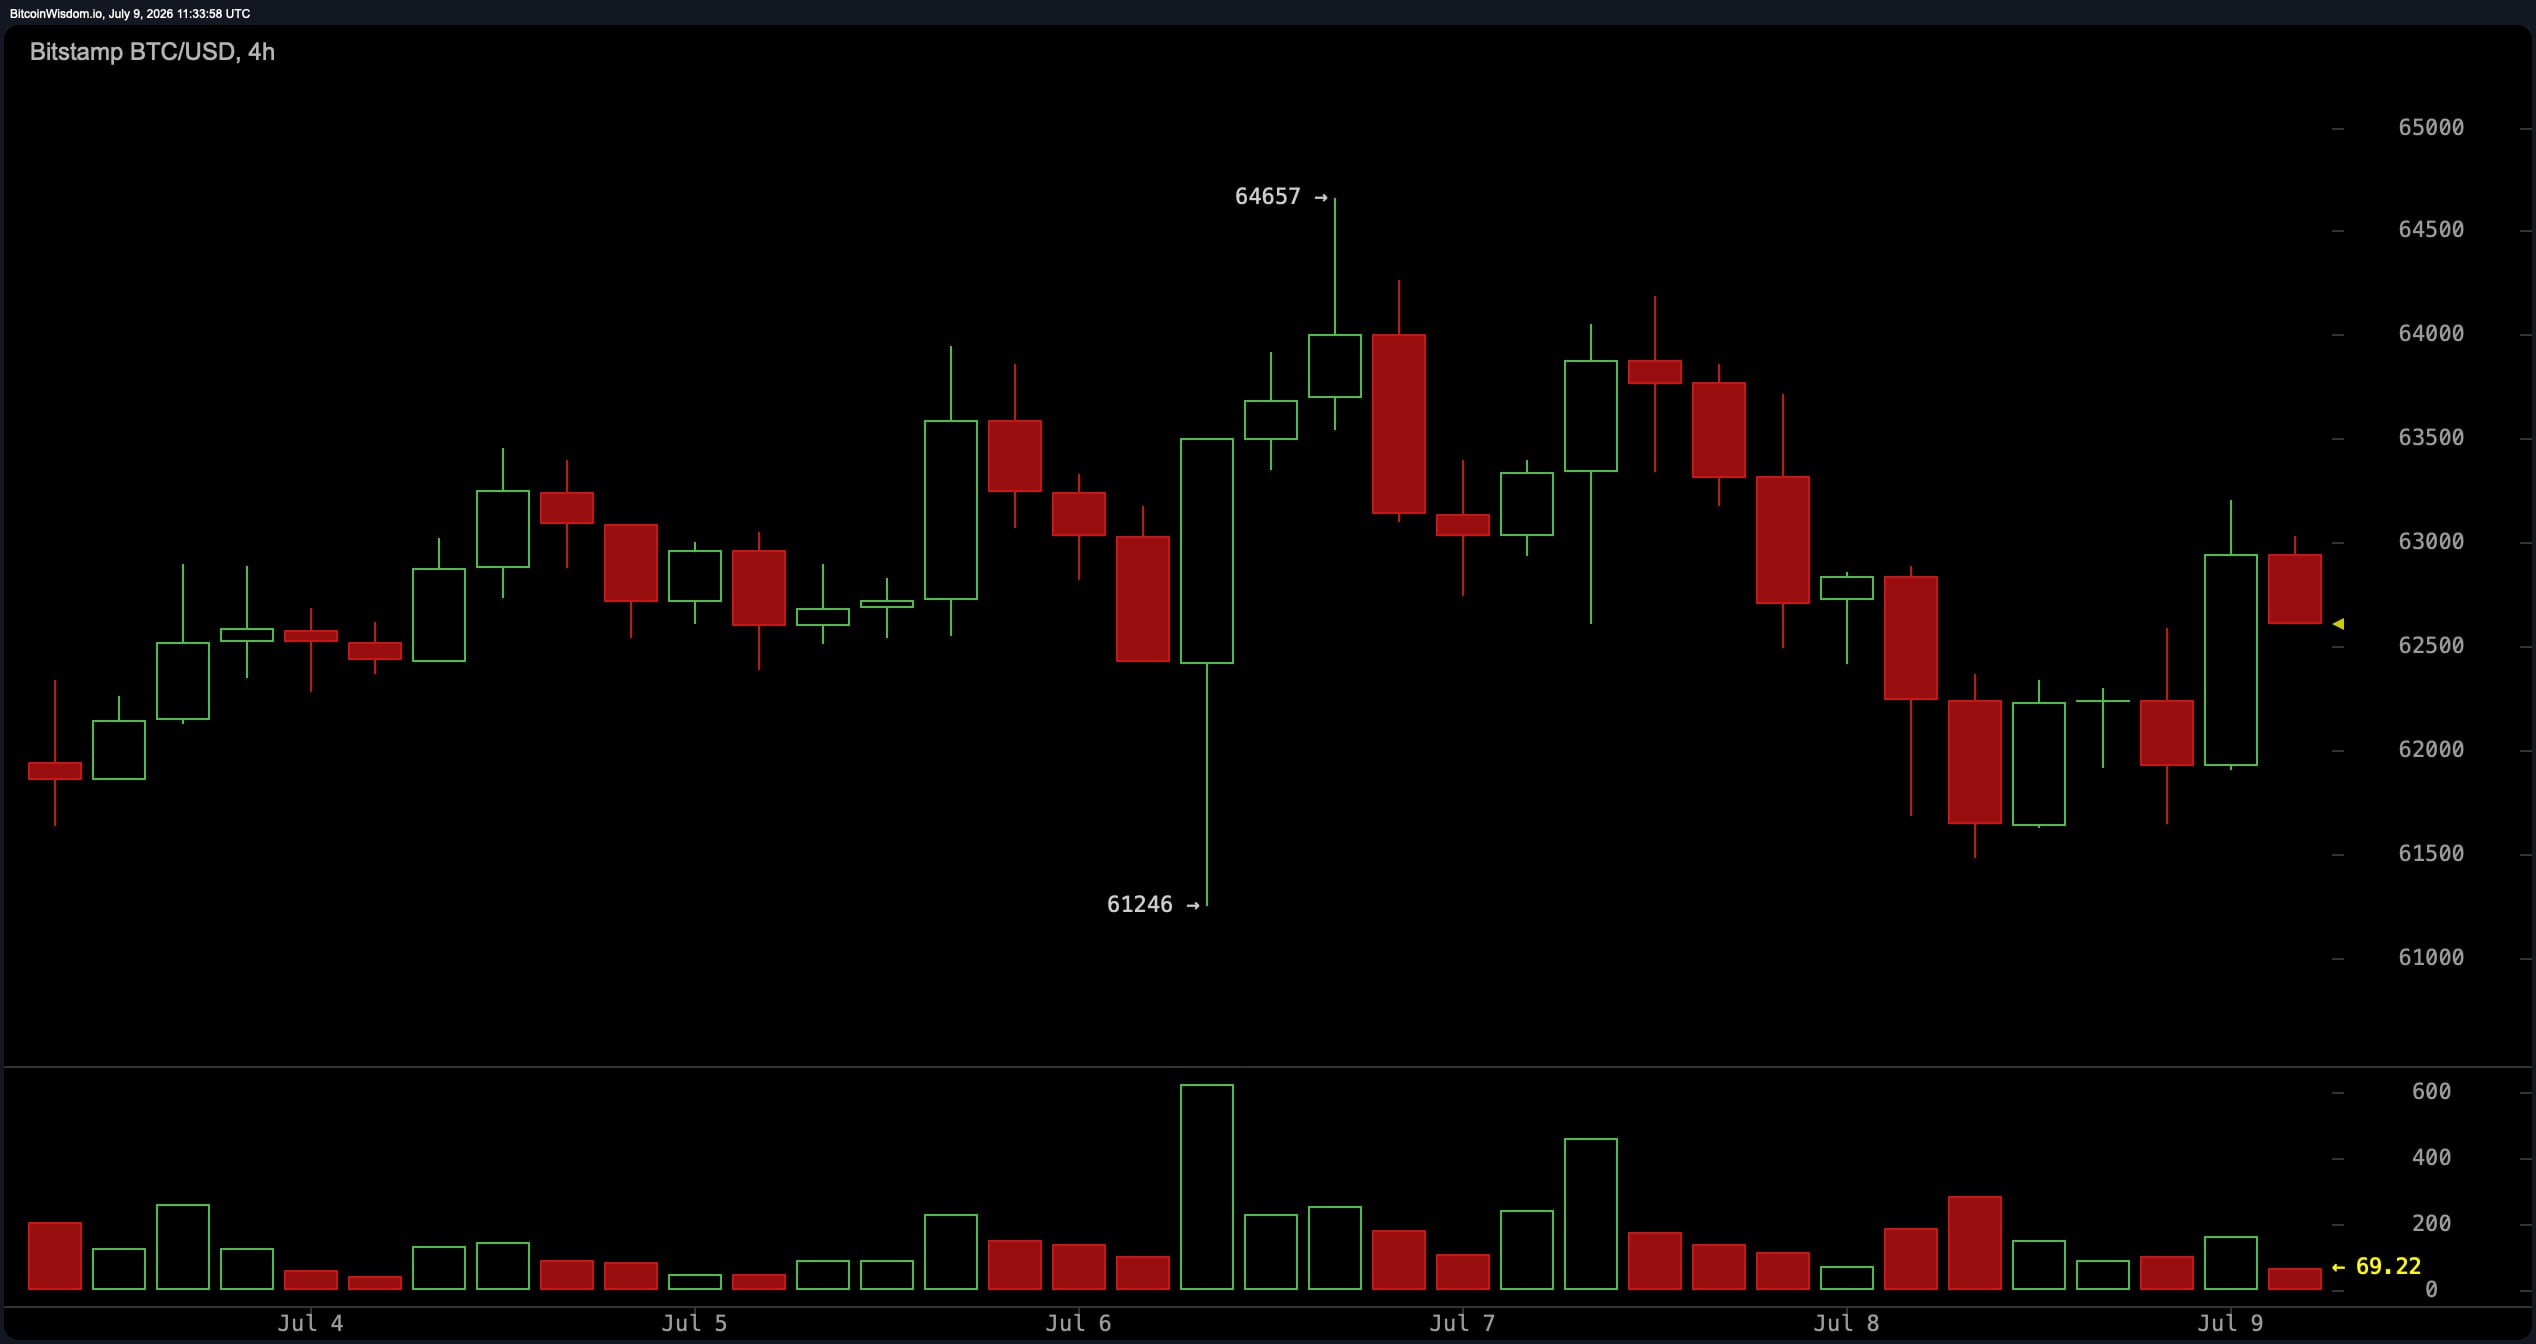 BTC/USD 4-hour chart via Bitstamp on July 9, 2026.
Bitcoin’s scalp and swing traders are eyeing four-hour closes above $62,800 to $63,000 for entries, with targets near $63,800 and exits or profit-taking suggested around $63,400 to $63,500. The setup points to a developing short-term bullish bias that remains capped by overhead resistance until volume expands on any upside break.
Daily Trend Holds Below Key Moving Averages
On the daily chart, Bitcoin is consolidating within its recent $61,507 to $63,116 intraday range following a period of volatility, and the asset continues to trade below its 50-day and 200-day moving averages, which sit at $65,624 and $74,225, respectively. That positioning points to a medium-term corrective or bearish bias even as short-term indicators lean constructive.
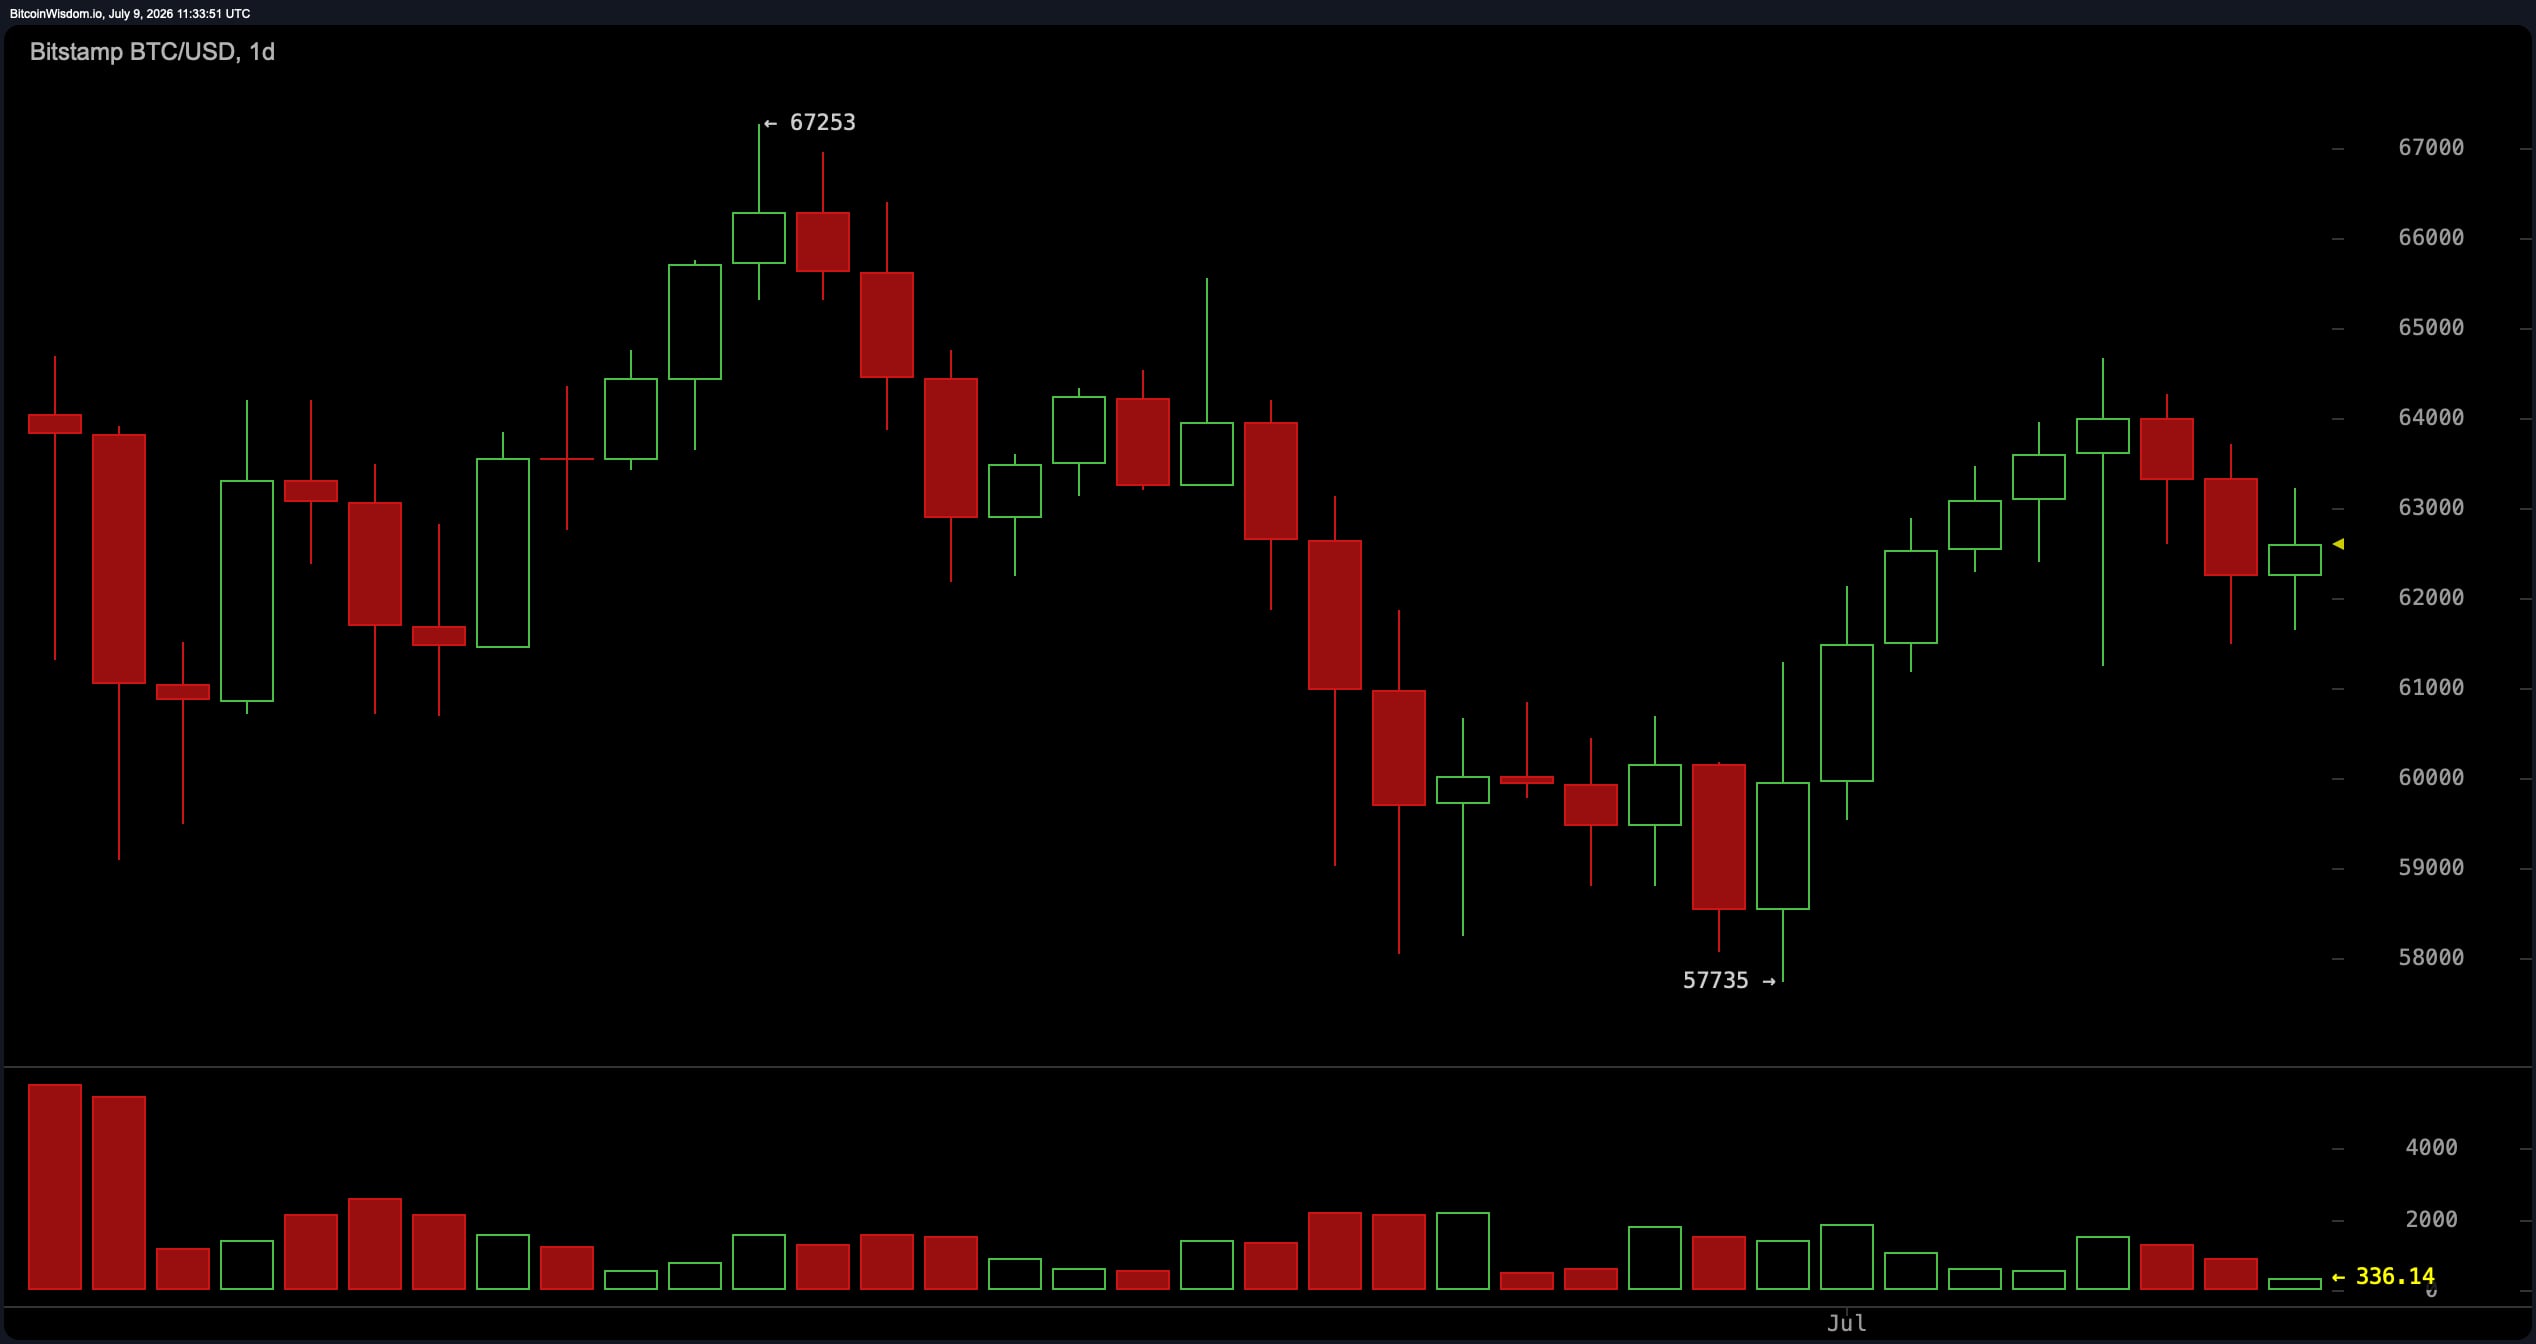 BTC/USD 1-day chart via Bitstamp on July 9, 2026.
Support is holding near $61,500, with resistance clustered between $63,100 and $63,500, an area that lines up with the classic pivot point at $63,515. A confirmed daily close above $63,500 with rising volume would open the door toward $65,000 and beyond, while conservative traders are watching pullbacks into $61,800 to $62,000 for entries, with stop-loss placement below $61,200 to manage downside risk.
Oscillators Split as Momentum Cools
Bitcoin’s oscillator readings are split but lean neutral overall, with seven of eleven indicators reading neutral. The relative strength index sits at 48, the Stochastic reads 72, the commodity channel index (CCI) is at 33, the average directional index (ADX 14) reads 28, and the Williams is at negative 29, all neutral.
The momentum indicator at 2,492 and the bull bear power reading of 153 both flash bearish, while the moving average convergence divergence ( MACD) level of negative 656 is the lone bullish signal among the group. The Awesome oscillator, stochastic RSI fast, and ultimate oscillator round out the neutral majority, leaving the oscillator summary at one bullish reading, two bearish readings, and eight neutral readings.
Moving Averages Diverge Across Timeframes
Bitcoin’s moving averages (MAs) show a clear split between timeframes, with short-term readings leaning bullish and longer-term readings staying bearish. The 10-day, 20-day, and 30-day simple moving averages (SMA) and exponential moving averages (EMA) are mostly reading bullish, led by the SMA 10 at $62,137 and the EMA 20 at $62,554, alongside a bullish volume weighted moving average (VWMA 20) at $61,448.
Further out, the picture flips, as the 50-day, 100-day and 200-day EMA and SMA readings all read bearish, topped by the SMA 200 at $74,225 and the EMA 200 at $75,152.
Bull Verdict:
Bulls can point to short-term moving averages and the moving average convergence divergence ( MACD) turning constructive, along with Bitcoin defending the $61,500 to $62,000 zone through repeated tests. A daily close above $63,500 would clear the classic pivot point and open a path toward the 50-day moving average near $65,624, with $67,200 as a further swing target if buying volume expands.
Bear Verdict:
Bears can point to Bitcoin trading well below its 50-day and 200-day moving averages, a structure that still favors sellers on longer timeframes. A decisive break below $61,500 support would risk a slide toward $60,000 and, if selling accelerates, the $57,700 region that capped the prior bounce.








 English (US) ·