
 3 months ago
51
3 months ago
51
- Solana is consolidating between $70 support and $94 resistance after February’s sharp selloff.
- Momentum indicators show weakening bearish pressure but buyers have not regained full control yet.
- If SOL fails to reclaim $100, the next major downside support sits near the $66 zone.
Solana is currently walking a bit of a tightrope. After the heavy selloff that hit the market in February, the token has managed to steady itself somewhat, but the broader pressure hasn’t exactly disappeared. SOL is still trading well below the psychologically important $100 level, and that alone keeps traders cautious. If anything, the market feels like it’s holding its breath, waiting to see which direction the next real move comes from.
Right now, Solana sits inside a fairly wide consolidation range. Buyers have stepped in a few times to prevent deeper damage, yet momentum still looks fragile. It’s not panic territory anymore—but it’s also far from a clean recovery.
A Tight Range Forms After February’s Selloff
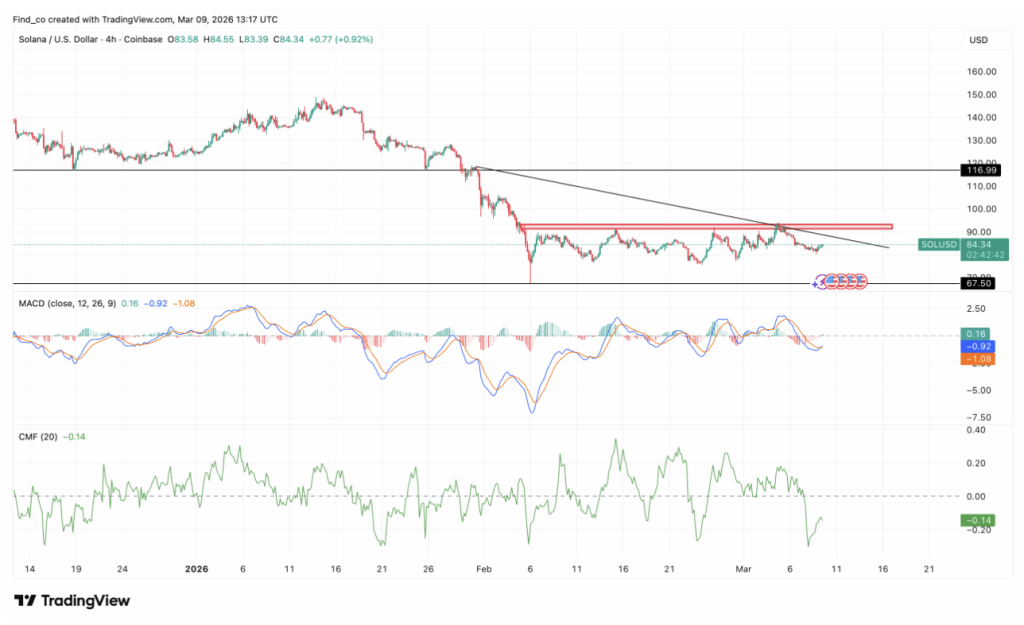
Looking at the 4-hour chart, Solana’s steep downtrend from early February has gradually slowed into a sideways pattern. Price action has mostly bounced between $70 support and $94 resistance, creating a fairly clear trading range that traders keep reacting to.
Earlier in the month, SOL dropped sharply before buyers rushed in around $69–$70, stopping what could have turned into a much deeper collapse. That reaction sparked a quick rebound, and since then the market has mostly drifted sideways.
Within that structure, the $83–$86 zone has become an important pivot area. Recently, the price dipped back toward the lower part of the range before bouncing again to around $83.80. That bounce suggests buyers are still defending the region, at least for now. Still, consolidation remains the dominant theme until something forces the market out of this box.
Momentum indicators reflect that uneasy balance. The MACD, which had been strongly bearish, is now flattening out. The red histogram bars are getting smaller, hinting that selling pressure might be slowly fading. Meanwhile, the MACD and signal lines are inching closer together, leaving the door open for a possible bullish crossover if buyers keep pushing.
At the same time though, capital inflows remain weak. The Chaikin Money Flow (CMF) sits around -0.12, which still signals more money leaving the market than entering. The interesting part is that the indicator has begun turning slightly upward—something that could hint at early accumulation creeping back in.
If buyers manage to gain momentum, the next serious resistance level sits near $111.42.
Liquidations Reveal Ongoing Market Pressure
Even with these early signs of stabilization, the broader market still looks tense. Liquidation data shows traders on both sides of the market getting squeezed as SOL continues hovering near the middle of its range.
On March 8, short liquidations totaled roughly $3.49 million, while long liquidations came in around $1.06 million. That imbalance suggests bearish positioning remains heavier overall, reinforcing the idea that the larger trend still leans downward.
When leverage builds like this inside a range, volatility tends to follow sooner or later. Markets don’t usually stay quiet for long when pressure keeps building underneath.
The Bigger Picture Still Favors Sellers
Zooming out to the daily chart, the structure becomes a bit clearer—and not necessarily in a bullish way.
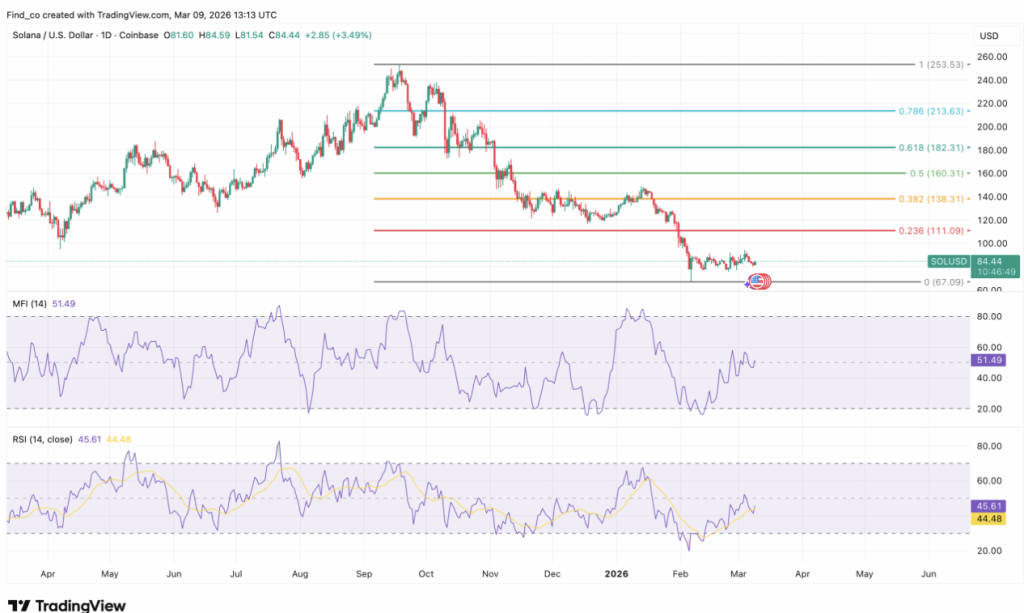
Solana remains below the $100 psychological level, while a descending trendline has been guiding the broader decline ever since SOL peaked near $255. The pattern of lower highs and lower lows still defines the trend, which means sellers continue to hold the upper hand in the bigger picture.
Technical levels reinforce that view. The 0.236 Fibonacci retracement near $111 has already flipped into resistance, acting as another barrier for any recovery attempt. Until Solana climbs back above that region, rallies may continue running into heavy selling pressure.
Momentum indicators show some modest improvement, though. The Relative Strength Index (RSI) is sitting around 45, suggesting the market has recovered slightly from oversold territory but still hasn’t crossed into bullish momentum. Meanwhile, the Money Flow Index has crept just above its midpoint, hinting that small capital inflows might be returning.
Still, the most important level may sit lower.
The strongest support zone currently appears near $66, which aligns with a previous liquidity pocket and the base Fibonacci level. If SOL fails to regain strength and selling pressure returns, the market could slide toward that region fairly quickly.
For now, $100 remains the line in the sand. A sustained move above that level could begin weakening the broader downtrend and shift sentiment back toward the bulls.
Until that happens though, the bearish structure stays intact… and the risk of a drop toward the $60 range remains very much on the table.
Disclaimer: BlockNews provides independent reporting on crypto, blockchain, and digital finance. All content is for informational purposes only and does not constitute financial advice. Readers should do their own research before making investment decisions. Some articles may use AI tools to assist in drafting, but every piece is reviewed and edited by our editorial team of experienced crypto writers and analysts before publication.


 English (US) ·