
 2 hours ago
21
2 hours ago
21
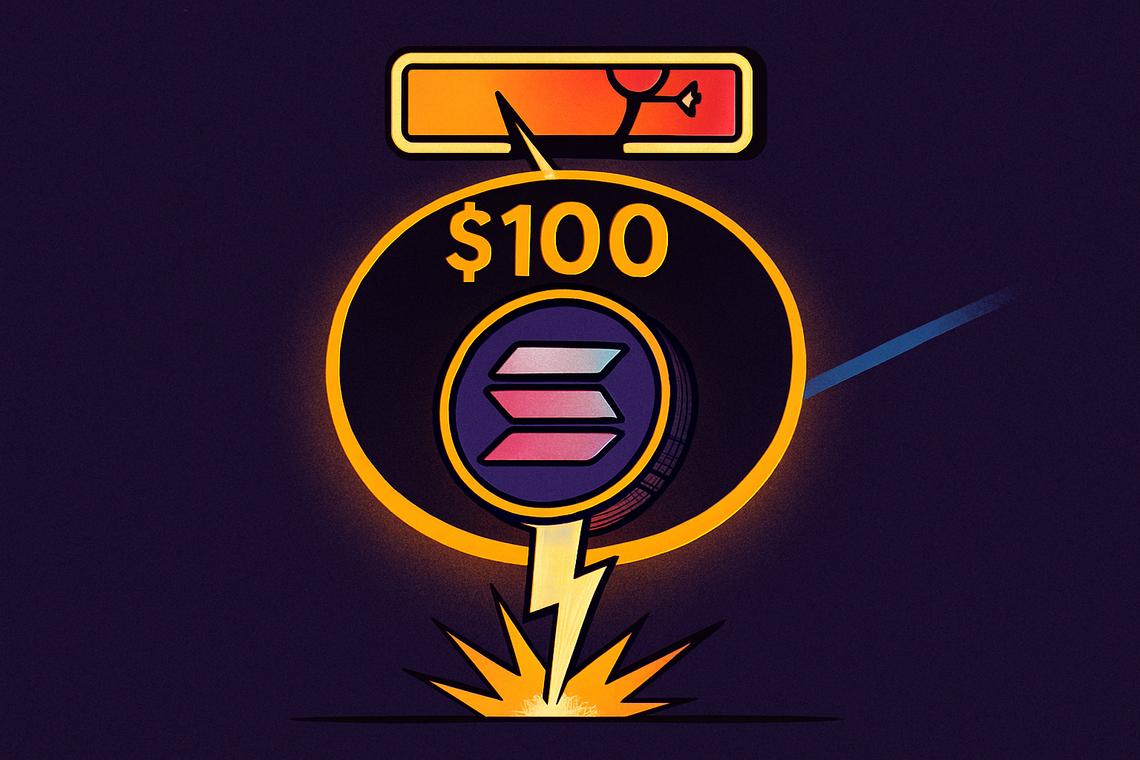
Solana has spent the past week doing something traders love and fear at the same time: ripping higher, fast. Anyone running a Solana price analysis right now has to reconcile two contradictory signals — a token up sharply over seven days, and a chart flashing warning signs of exhaustion just below a key psychological level. That tension is exactly why SOL’s next move matters so much for the broader altcoin market heading into the final stretch of 2026.
Key takeaways
- Solana climbed from $85.37 on August 20 to an intraday high above $102.59 on August 25, before pulling back toward $97.50.
- The daily RSI sits at an overbought 79, while price remains stuck below the $100 resistance zone.
- More than $4 billion in crypto short positions were liquidated, adding forced buying pressure to the rally.
- Spot Solana ETFs pulled in $65.74 million in net inflows, the strongest weekly figure recorded in 2026.
- Analysts are split between a rally toward $120 and a correction below $92, depending on whether $100–$103 flips into support.
Solana’s Rally From $85 to Above $102: What the Charts Actually Show
Solana’s breakout was sharp and, so far, only partially reversed. The token opened at $85.37 on August 20 and pushed to an intraday high above $102.59 by August 25 — a peak gain of more than 20% before profit-taking dragged it back near $97.50. Even after that pullback, SOL was still holding roughly 14% higher over the seven-day window.
Breaking Through Old Resistance
The move let Solana clear both the $87.50 and $93.75 Murrey Math levels, two zones that had previously capped price advances. On the daily chart, SOL briefly poked above the $100 “ultimate resistance” mark and tested the $102–$103 area twice, but buyers couldn’t force a daily close inside that range. The breakout structure hasn’t broken down, though — Solana is still trading above $93.75, and dips toward $95 have consistently attracted buyers.
An Overbought Signal Worth Watching
The catch is momentum. The daily Relative Strength Index has climbed to an overbought 79, well past the standard 70 threshold, with its moving average at nearly 69. That doesn’t guarantee an immediate drop, but it does suggest SOL may need to cool off before attempting another serious run at $100.
Short-Term Support Near $96.67
Zooming into the 4-hour chart adds nuance to this Solana price analysis. SOL was trading around $97.53, sitting above the 20-period middle Bollinger Band at $96.67 — a level buyers have repeatedly defended. The upper band near $101.04 lines up almost exactly with the psychological $100 mark and the recent rejection zone, making it the clearest short-term barrier on the chart. A 4-hour close above that level would open the door to another test of $102.59–$103.08, and potentially $106.25 beyond that. On the downside, the lower band at $92.30 marks the main risk zone; losing the middle band could expose $93.75 first, then $92.30.
What’s Fueling the Move: Short Squeezes, Treasury Yields, and ETF Demand
Solana’s rally didn’t happen in isolation. It rode a broader wave of risk-on sentiment across crypto markets, triggered by shifts in U.S. monetary conditions and reinforced by aggressive positioning unwinds.
A $4 Billion Short Squeeze
Liquidity actions from the U.S. Treasury pushed government bond yields lower and weakened the dollar, easing pressure on risk assets broadly. That shift forced traders who had bet on further crypto weakness to unwind bearish positions. More than $4 billion in crypto short positions were reportedly liquidated over several days, generating forced buying across major tokens. Because SOL tends to move with higher volatility than Bitcoin, it caught an outsized share of that squeeze — once it cleared the upper-$80s, short covering and momentum buying carried it straight through the $100 barrier.
ETF Inflows Signal Institutional Appetite
Institutional demand added another layer of support. Solana ETF inflows reached approximately $65.74 million in net inflows for the week — the highest weekly figure for spot Solana exchange-traded funds recorded in 2026. That’s a meaningful data point: it shows traditional capital allocators are treating SOL’s rally as more than just a speculative spike, at least for now.
Regulation and Network Upgrades Add Fuel to the Sentiment Shift
Beyond price mechanics, two structural developments are shaping how investors read Solana’s setup — one regulatory, one technical to the network itself.
US Crypto Regulation Impact on Sentiment
The Securities and Exchange Commission’s proposed crypto framework, combined with renewed congressional attention on the Digital Asset Market Clarity Act, helped shift the regulatory mood. Investors have been watching for exactly this kind of signal — clearer rules of the road tend to unlock institutional flows that stayed sidelined during periods of uncertainty. This is one of the clearest examples this year of how US crypto regulation impact can ripple directly into token-level price action, even before any final rule is adopted.
Solana’s Resource Fee Proposal
On the network side, Solana’s community opened voting on a Resource Fee Proposal that would separate the base inclusion fee — paid to the block leader — from a separate compute resource fee tied to transaction cost, with that resource fee burned in full. Supporters argue this would tie periods of heavy network usage directly to higher SOL burns, though the real supply impact will hinge on adoption and how much activity the network actually sees once the mechanism goes live.
Ramp’s AI-Agent Wallet Integration
Adding to the network-level narrative, Ramp integrated AI-agent wallet support on Solana, expanding the blockchain’s potential role in automated, machine-driven payments. Combined with Solana reportedly overtaking Base in daily micropayment transaction volume, it’s part of a broader case that the network’s usage story is evolving beyond simple token speculation.
Where Does Solana Go From Here? Analysts Split Between $120 and $92
Not everyone reading the same charts reaches the same conclusion — and that divide is itself informative for anyone tracking Solana technical levels right now.
The Bullish Case: $120
Pseudonymous trader Altcoin Sherpa expects the advance to continue if broader market conditions stay supportive, saying SOL “goes to $120+ in the coming weeks as long as BTC is still stable/strong. Inflation going down, risk conditions going up, etc.” A move to $120 from current levels near $97.50 would represent roughly a 23% gain, though SOL would still need to clear resistance layers at $100, $103, and $106.25 along the way.
The Bearish Case: Below $92
Crypto analyst Haris takes a more cautious view, flagging the repeated rejections between $98 and $102 as a potential bull trap: “Price bounced hard, but $98–$102 is still rejecting. If SOL comes back there and gets rejected again, I will open a short.” Haris pointed to $92 as the first downside target, warning that a failure to hold that level could open the door to a deeper slide toward the $80–$88 range.
Why This Split Matters
The disagreement isn’t really about direction so much as timing and conviction. Both analysts are watching the exact same zone — $98 to $103 — as the deciding factor. If that range flips from resistance into support, the bullish scenario gains real traction. If it keeps rejecting price on repeated attempts, the bearish case strengthens quickly. That’s what makes the coming days a genuine inflection point rather than just another data point in Solana’s chart history.
FAQ
What recent price changes has Solana experienced?
Solana’s price rose from $85.37 on August 20 to a weekly high above $102.59 on August 25, representing about a 20% increase at its peak before settling near $97.50.
What factors contributed to Solana’s recent price rally?
Key drivers included the liquidation of over $4 billion in crypto short positions, supportive U.S. Treasury actions that weakened the dollar and lowered bond yields, positive regulatory developments around the SEC’s crypto framework and the Digital Asset Market Clarity Act, and strong institutional ETF inflows.
What is the significance of Solana’s Resource Fee Proposal?
The proposal aims to restructure transaction fees by separating inclusion fees from compute resource fees, increasing token burns during periods of high network usage and potentially reducing SOL’s circulating supply over time.
What are the differing analyst views on Solana’s near-term price direction?
Some analysts, like Altcoin Sherpa, expect a rally toward $120 if broader market conditions stay favorable. Others, like Haris, see risk of a correction below $92 if the $98–$102 resistance zone keeps rejecting price.
Article produced with the assistance of artificial intelligence and reviewed by the editorial team.







 English (US) ·