
 1 month ago
33
1 month ago
33
- Solana faces key resistance between $86 and $88 as short-term bounce forms
- Bearish structure remains intact unless SOL breaks above $90–$96
- Downside targets extend toward $40 if selling pressure returns
Solana is hovering near a pretty important resistance zone right now, and the charts… well, they’re not exactly screaming bullish yet. There’s some attempt at a bounce, sure, but the broader structure still leans cautious, maybe even slightly bearish. At around $86, SOL is basically sitting in a spot where the next move matters more than usual, and traders seem to know it.
Short-Term Bounce Looks More Corrective Than Bullish
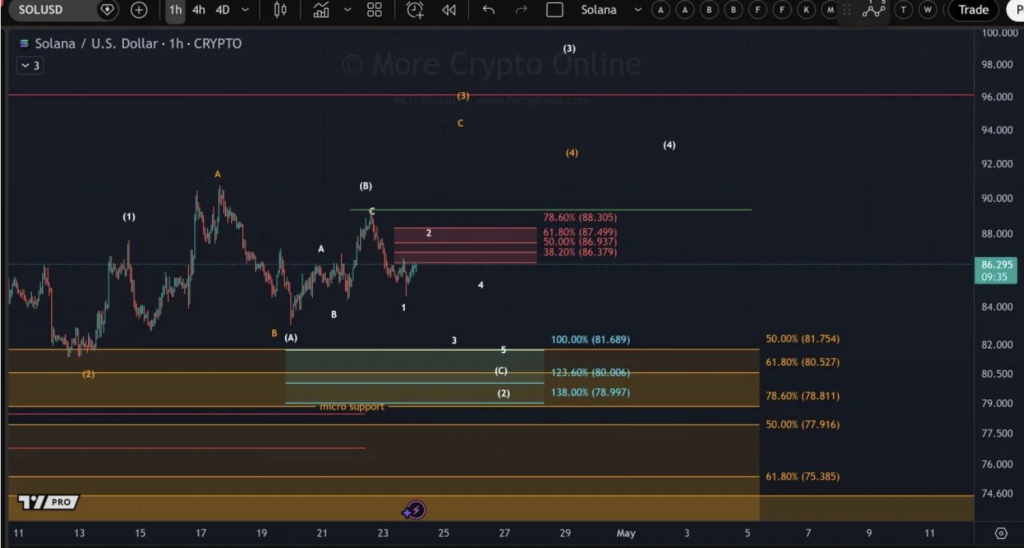
On the 1-hour chart, the recent move up is being labeled as a possible wave 2 bounce, which, in simple terms, suggests this isn’t a full trend reversal just yet. It’s more like a temporary lift inside a bigger downward structure, not exactly what bulls would want to see. The key resistance sits between $86.37 and $88.30, and that range is packed with Fibonacci levels, which tends to make it a tough barrier to break cleanly.
If price gets rejected there, sellers could step back in pretty quickly, pushing SOL back down toward lower levels. But if, and it’s still a big if, price manages to break above $88.30 with conviction, then the bearish setup starts to weaken. In that case, a move toward $89 or even $90 becomes more likely, though that area also carries its own resistance from previous highs.
Downside Levels Still Loom in the Background
Even with the current bounce attempt, downside targets haven’t gone anywhere. The chart highlights levels like $81.69, $80.00, and $78.99 as potential areas where price could head next if selling pressure returns. There’s also a broader support zone sitting between roughly $78.80 and $81.75, which might act as a temporary floor if things slide.
So the situation feels a bit split, short-term upside is possible, but the structure hasn’t flipped bullish yet. Until SOL pushes firmly above that resistance cluster, the risk of another leg down is still very much on the table.
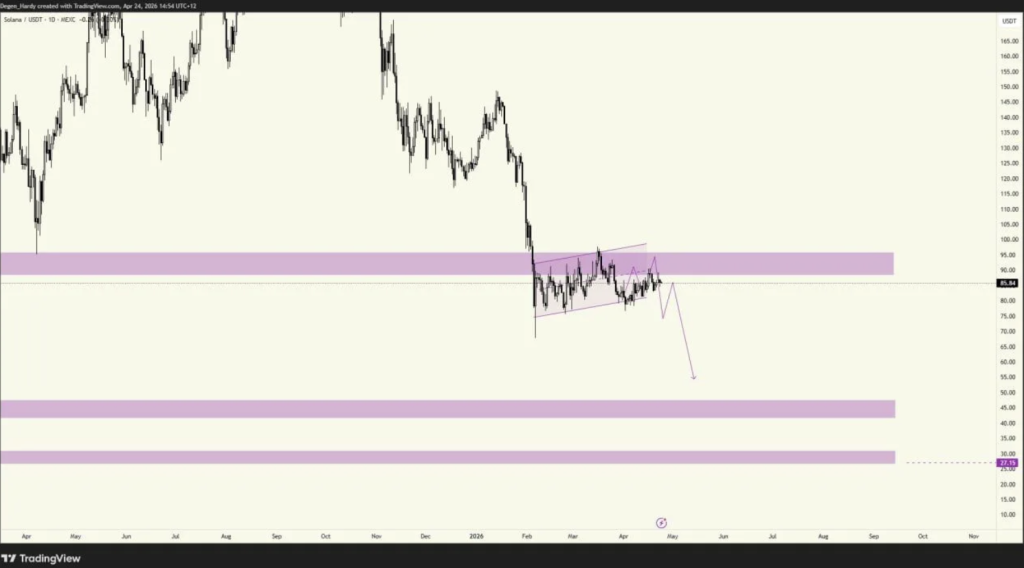
Bigger Picture Shows Weakness Below Key Resistance
Zooming out to the daily chart, the tone doesn’t change all that much. SOL is trading just under a major resistance band between $90 and $96, and it hasn’t really managed to reclaim that area with strength since its earlier drop. Instead, price has been moving sideways for a while now, almost drifting, which often signals indecision rather than strength.
There’s also a scenario being mapped out where SOL makes a small bounce from current levels, only to roll over again. In that case, the next major support zone sits much lower, around $40 to $47, which is quite a drop, honestly. There’s even mention of deeper support near $27, though that’s more of a long-shot scenario for now.
A Market Waiting for Confirmation
Overall, the structure still leans bearish in the short term, even if price is trying to stabilize. For things to really shift, SOL would need a strong daily reclaim above the $90 to $96 zone, not just a quick spike, but something sustained. Until that happens, the current range feels more like a pause than a reversal.
It’s one of those setups where the market is kind of waiting, watching, maybe even hesitating a bit. A breakout could change everything, but until then, the risk still tilts slightly to the downside, even if it doesn’t feel dramatic yet.
Disclaimer: BlockNews provides independent reporting on crypto, blockchain, and digital finance. All content is for informational purposes only and does not constitute financial advice. Readers should do their own research before making investment decisions. Some articles may use AI tools to assist in drafting, but every piece is reviewed and edited by our editorial team of experienced crypto writers and analysts before publication.


 English (US) ·