
 1 hour ago
19
1 hour ago
19
Key Highlights
- SOL currently trades between $63 and $65 following a bounce from critical $60 support
- Technical analysis reveals a TD Sequential buy signal suggesting potential upside to $77
- The Relative Strength Index plunged to 28, indicating extreme oversold conditions, though MACD suggests seller dominance persists
- Solana gains institutional validation as Mastercard incorporates the network into its “Agent Pay” artificial intelligence payment infrastructure
- Critical price thresholds: reclaim $70–$76 range to validate bullish momentum, defend $60.52 to prevent further decline
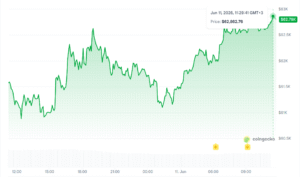
Solana (SOL) is currently consolidating in the $63–$65 range following an aggressive downturn that pushed the cryptocurrency to the critical $60 threshold. While buyers managed to stage a modest rebound exceeding 5%, the overall market structure continues to exhibit weakness.
As of this analysis, SOL is changing hands near $64.96 with daily trading volume reaching $2.67 billion against a market capitalization of $37.65 billion.
Market sentiment deteriorated significantly, with the Fear & Greed Index plummeting to an extreme fear level of 10 amid the recent liquidation cascade. Bitcoin’s dominance maintains strength at 57%, indicating that investors are adopting risk-off positioning and avoiding altcoin exposure including SOL.
The token is currently trading 11% beneath its 20-day exponential moving average and over 17% below its 50-day exponential moving average. The 200-day EMA remains distant at $105. All primary moving averages display bearish alignment.
Daily RSI metrics dropped to 28.42, entering deeply oversold conditions. Current price action is developing immediately above the lower Bollinger Band support at $60.52, a technical zone that has historically triggered short-term bounce activity.
Market commentator Don (@DonWedge) posed a pertinent question to his audience: “Do you think the bottom for $SOL is in already?” — reflecting the widespread uncertainty gripping traders at this juncture.
do you think the bottom for $SOL is in already? pic.twitter.com/Bp1ry0xYSm
— Don  (@DonWedge) June 10, 2026
Chart Patterns Suggest Potential Trend Reversal
Technical analyst Ali Charts identified a TD Sequential buy signal forming on Solana’s price chart. This momentum indicator is designed to detect potential exhaustion in downward pressure. While not a guaranteed reversal pattern, it indicates that momentum dynamics may be transitioning.
I’m seeing a new TD Sequential buy signal on Solana $SOL.
If it plays out, a move to the $77 resistance cluster could be next. https://t.co/SU52UyvHWJ pic.twitter.com/ROKs2mItYh
— Ali Charts (@alicharts) June 9, 2026
Should this setup materialize into upward price action, SOL could target the $77 resistance area, representing a significant supply zone for the asset. However, this scenario requires bulls to first capture the $70–$76 range convincingly.
The MACD indicator displays a gradual transition away from pronounced bearish momentum toward a potential bullish convergence. The histogram reflects improving conditions, though market participants remain cautious as buying conviction has yet to solidify.
Examining the hourly timeframe, SOL is range-bound between $65.71 and $68.04. Immediate resistance emerges at $67.62. The hourly 200 EMA positioned at $69.51 represents the threshold bulls must recapture to establish a credible technical foundation for continued recovery.
Mastercard Integrates Solana Into Autonomous Payment Infrastructure
Mastercard unveiled “Agent Pay for Machines,” an innovative system enabling artificial intelligence agents to execute payments independently through card networks and stablecoin settlements. Solana has been incorporated as a core component of this infrastructure.
The framework merges conventional financial rails with distributed ledger technology to facilitate instantaneous, autonomous machine-to-machine value transfer without human intermediation.
Solana’s high throughput capabilities and minimal transaction fees position it as an optimal settlement layer for these automated payment applications. This integration represents meaningful real-world utility expansion for the Solana ecosystem beyond speculative trading dynamics.
Persistent ETF outflows continue to weigh on SOL’s price trajectory. Until capital inflows reverse direction, downside vulnerability remains present approaching the $60 support boundary.
The post Solana (SOL) Eyes Recovery as TD Sequential Triggers Buy Signal and Mastercard Adopts Network appeared first on Blockonomi.


 English (US) ·