
 1 hour ago
22
1 hour ago
22
Key Takeaways
- Solana spot ETFs in the United States logged $1.58 million in net inflows on August 18, pushing total cumulative inflows to $1.16 billion.
- SOL peaked at $86 on Wednesday before retreating marginally to approximately $84.81.
- Market observers are focusing on $100 as a critical threshold, with a sustained move above it potentially confirming a bottom formation.
- Crypto analyst Ali Charts has outlined extended price objectives of $295 and $400.
- Trader Michaël van de Poppe maintains that SOL is positioned for a substantial upward move.
Solana reached the $86 mark on Wednesday before experiencing a minor pullback, currently changing hands around $84.81. ETF investment continues to strengthen while market watchers maintain focus on the $100 benchmark.
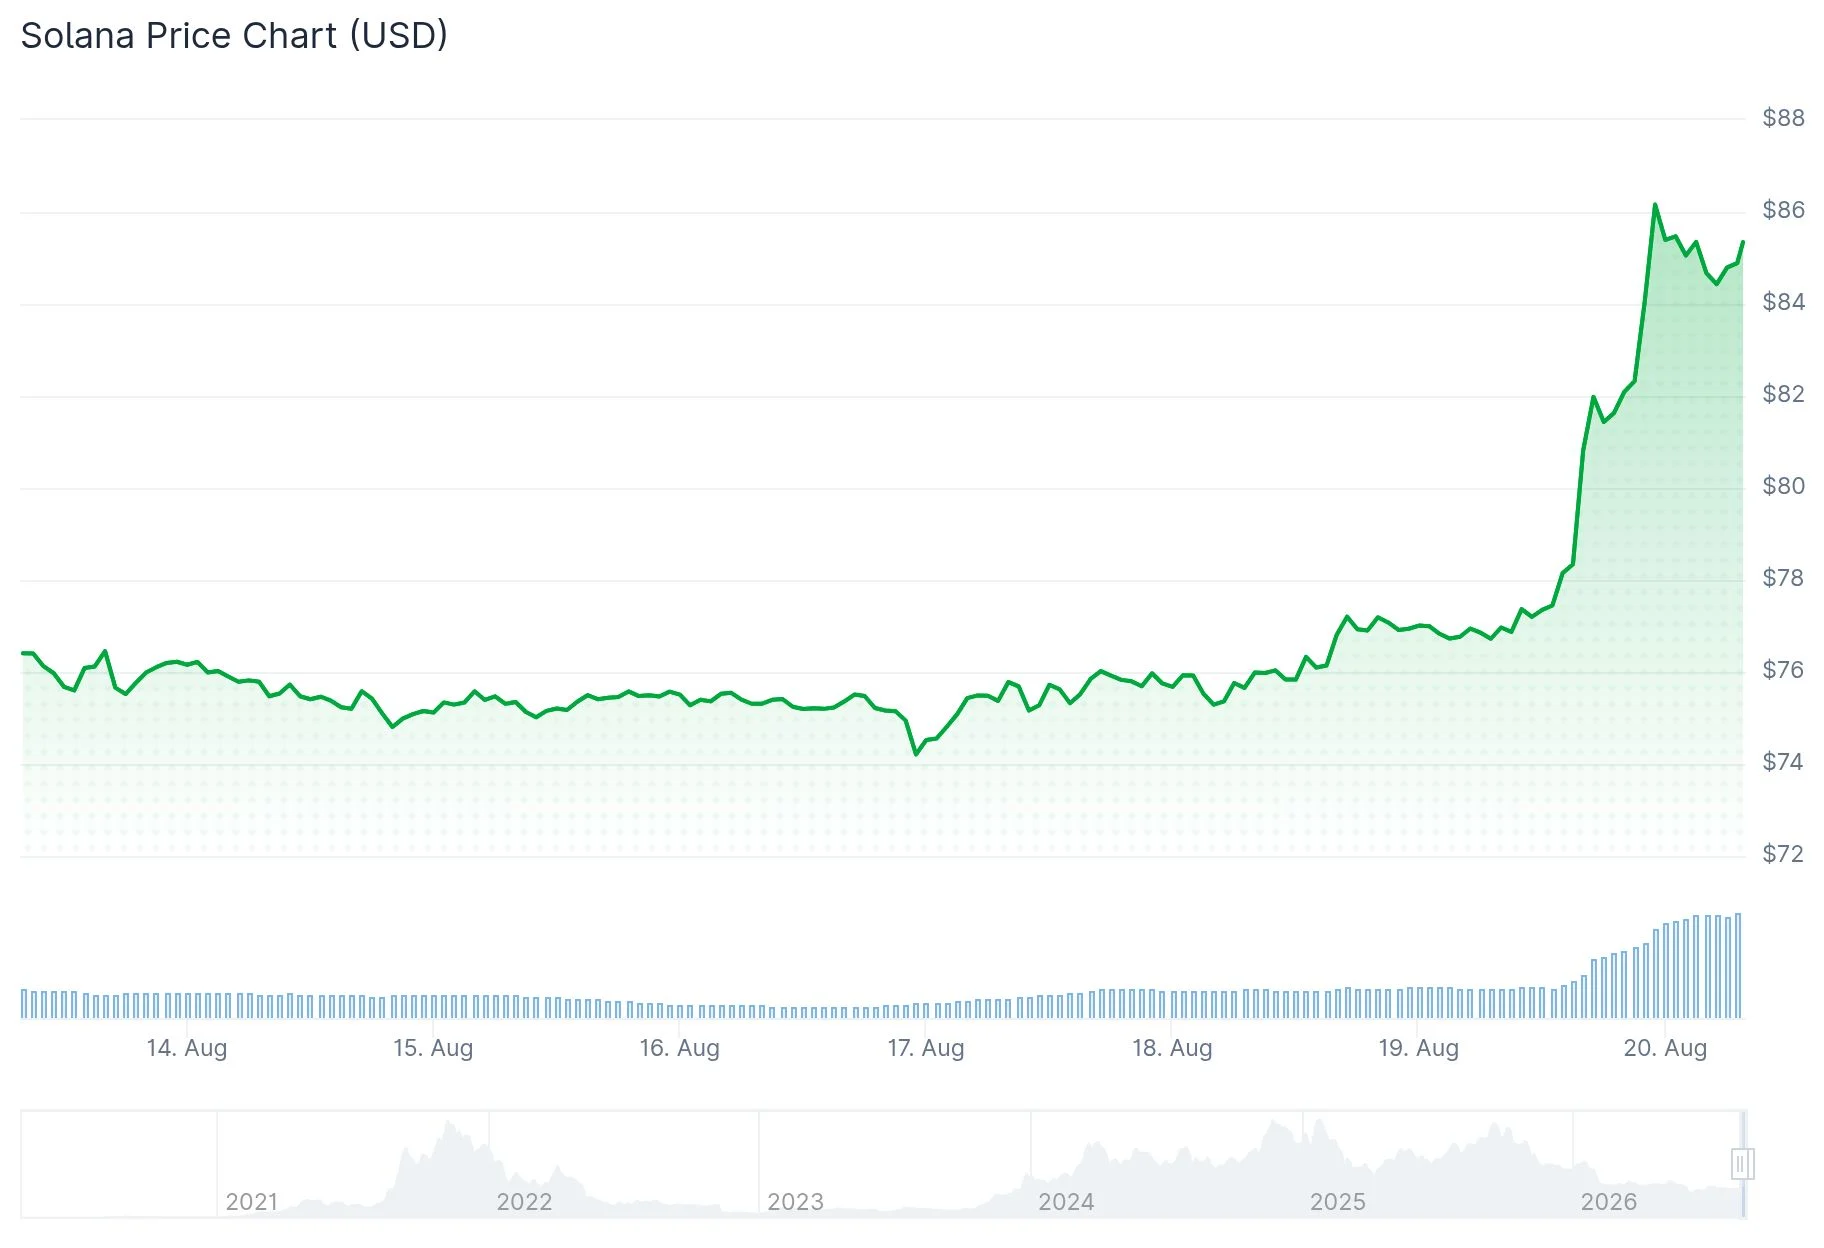 Solana (SOL) Price
Spot Solana exchange-traded funds in the US attracted $1.58 million on August 18, based on figures from SoSoValue. This addition brings the aggregate net inflows since launch to $1.16 billion.
Combined net assets across all Solana ETF offerings reached $923.57 million, while daily trading volume for that session totaled $30.13 million.
Bitwise was responsible for the entire $1.58 million single-day inflow on August 18. The remaining funds on the market did not register any new net contributions during that trading day.
Previous inflow sessions included $8.83 million on August 10 and $1.43 million on August 11. A minor outflow of approximately $859,450 occurred on August 6, demonstrating that capital movement has not been exclusively positive.
$100 Emerges as Critical Resistance Target
Cryptocurrency analyst Ali Charts identifies $100 as the primary level to monitor for SOL. A definitive break above this threshold would strengthen his conviction that the market has already established its bottom.
Instead of attempting to pinpoint an exact bottom, Ali Charts has been steadily building his SOL position through dollar-cost averaging, focusing on a price range from $40 to $70.
Wednesday’s surge to $86 places SOL above his accumulation zone, although the asset remains beneath the $100 mark that Ali Charts views as a significant confirmation signal.
Ali Charts has also identified extended price targets at $295 and $400, representing potential gains of approximately 288% and 430% from his baseline price. He frames these projections as components of a long-horizon approach that incorporates staking rewards.
Regarding staking returns, he referenced an approximate gross yield of 5.7%. For a position of 1,000 SOL, this would generate around 57 SOL annually before accounting for a 7% validator fee, resulting in roughly 53 SOL retained.
Technical Indicators Support Bullish Outlook
Trader Michaël van de Poppe shared on X that $SOL continues to be primed for a significant upward breakout, echoing the optimistic sentiment prevalent among several market participants.
SOL is maintaining position above both its 50-day exponential moving average at $76.30 and its 100-day EMA at $78.41. The relative strength index registers near 72, entering overbought conditions, while the MACD displays a bullish signal configuration.
The immediate resistance zone lies at the 200-day EMA of $88.82, positioned near the 78.6% Fibonacci retracement level at $90.21.
Wednesday’s advance to $86 brought Solana within striking distance of this resistance area. A successful break above $88.82 would clear the pathway toward the $98.41 swing high and the psychologically significant $100 level.
For downside protection, support is established at the 50% retracement mark of $79.27 and the 100-day EMA at $78.41.
The $1.16 billion cumulative Solana ETF inflow figure, Wednesday’s $86 peak, and the present trading price of $84.81 represent the critical data points market participants are monitoring closely.
The post Solana (SOL) Surges to $86 as ETF Inflows Top $1.16 Billion — Can It Breach $100? appeared first on Blockonomi.



 English (US) ·