
 3 months ago
69
3 months ago
69

Spotify Stock (SPOT) is surging after Investor Day, closing at 519.86 and pushing above its daily Bollinger upper band. Momentum is firm, yet a decisive test waits at 534–542, where the 200-day EMA sits.
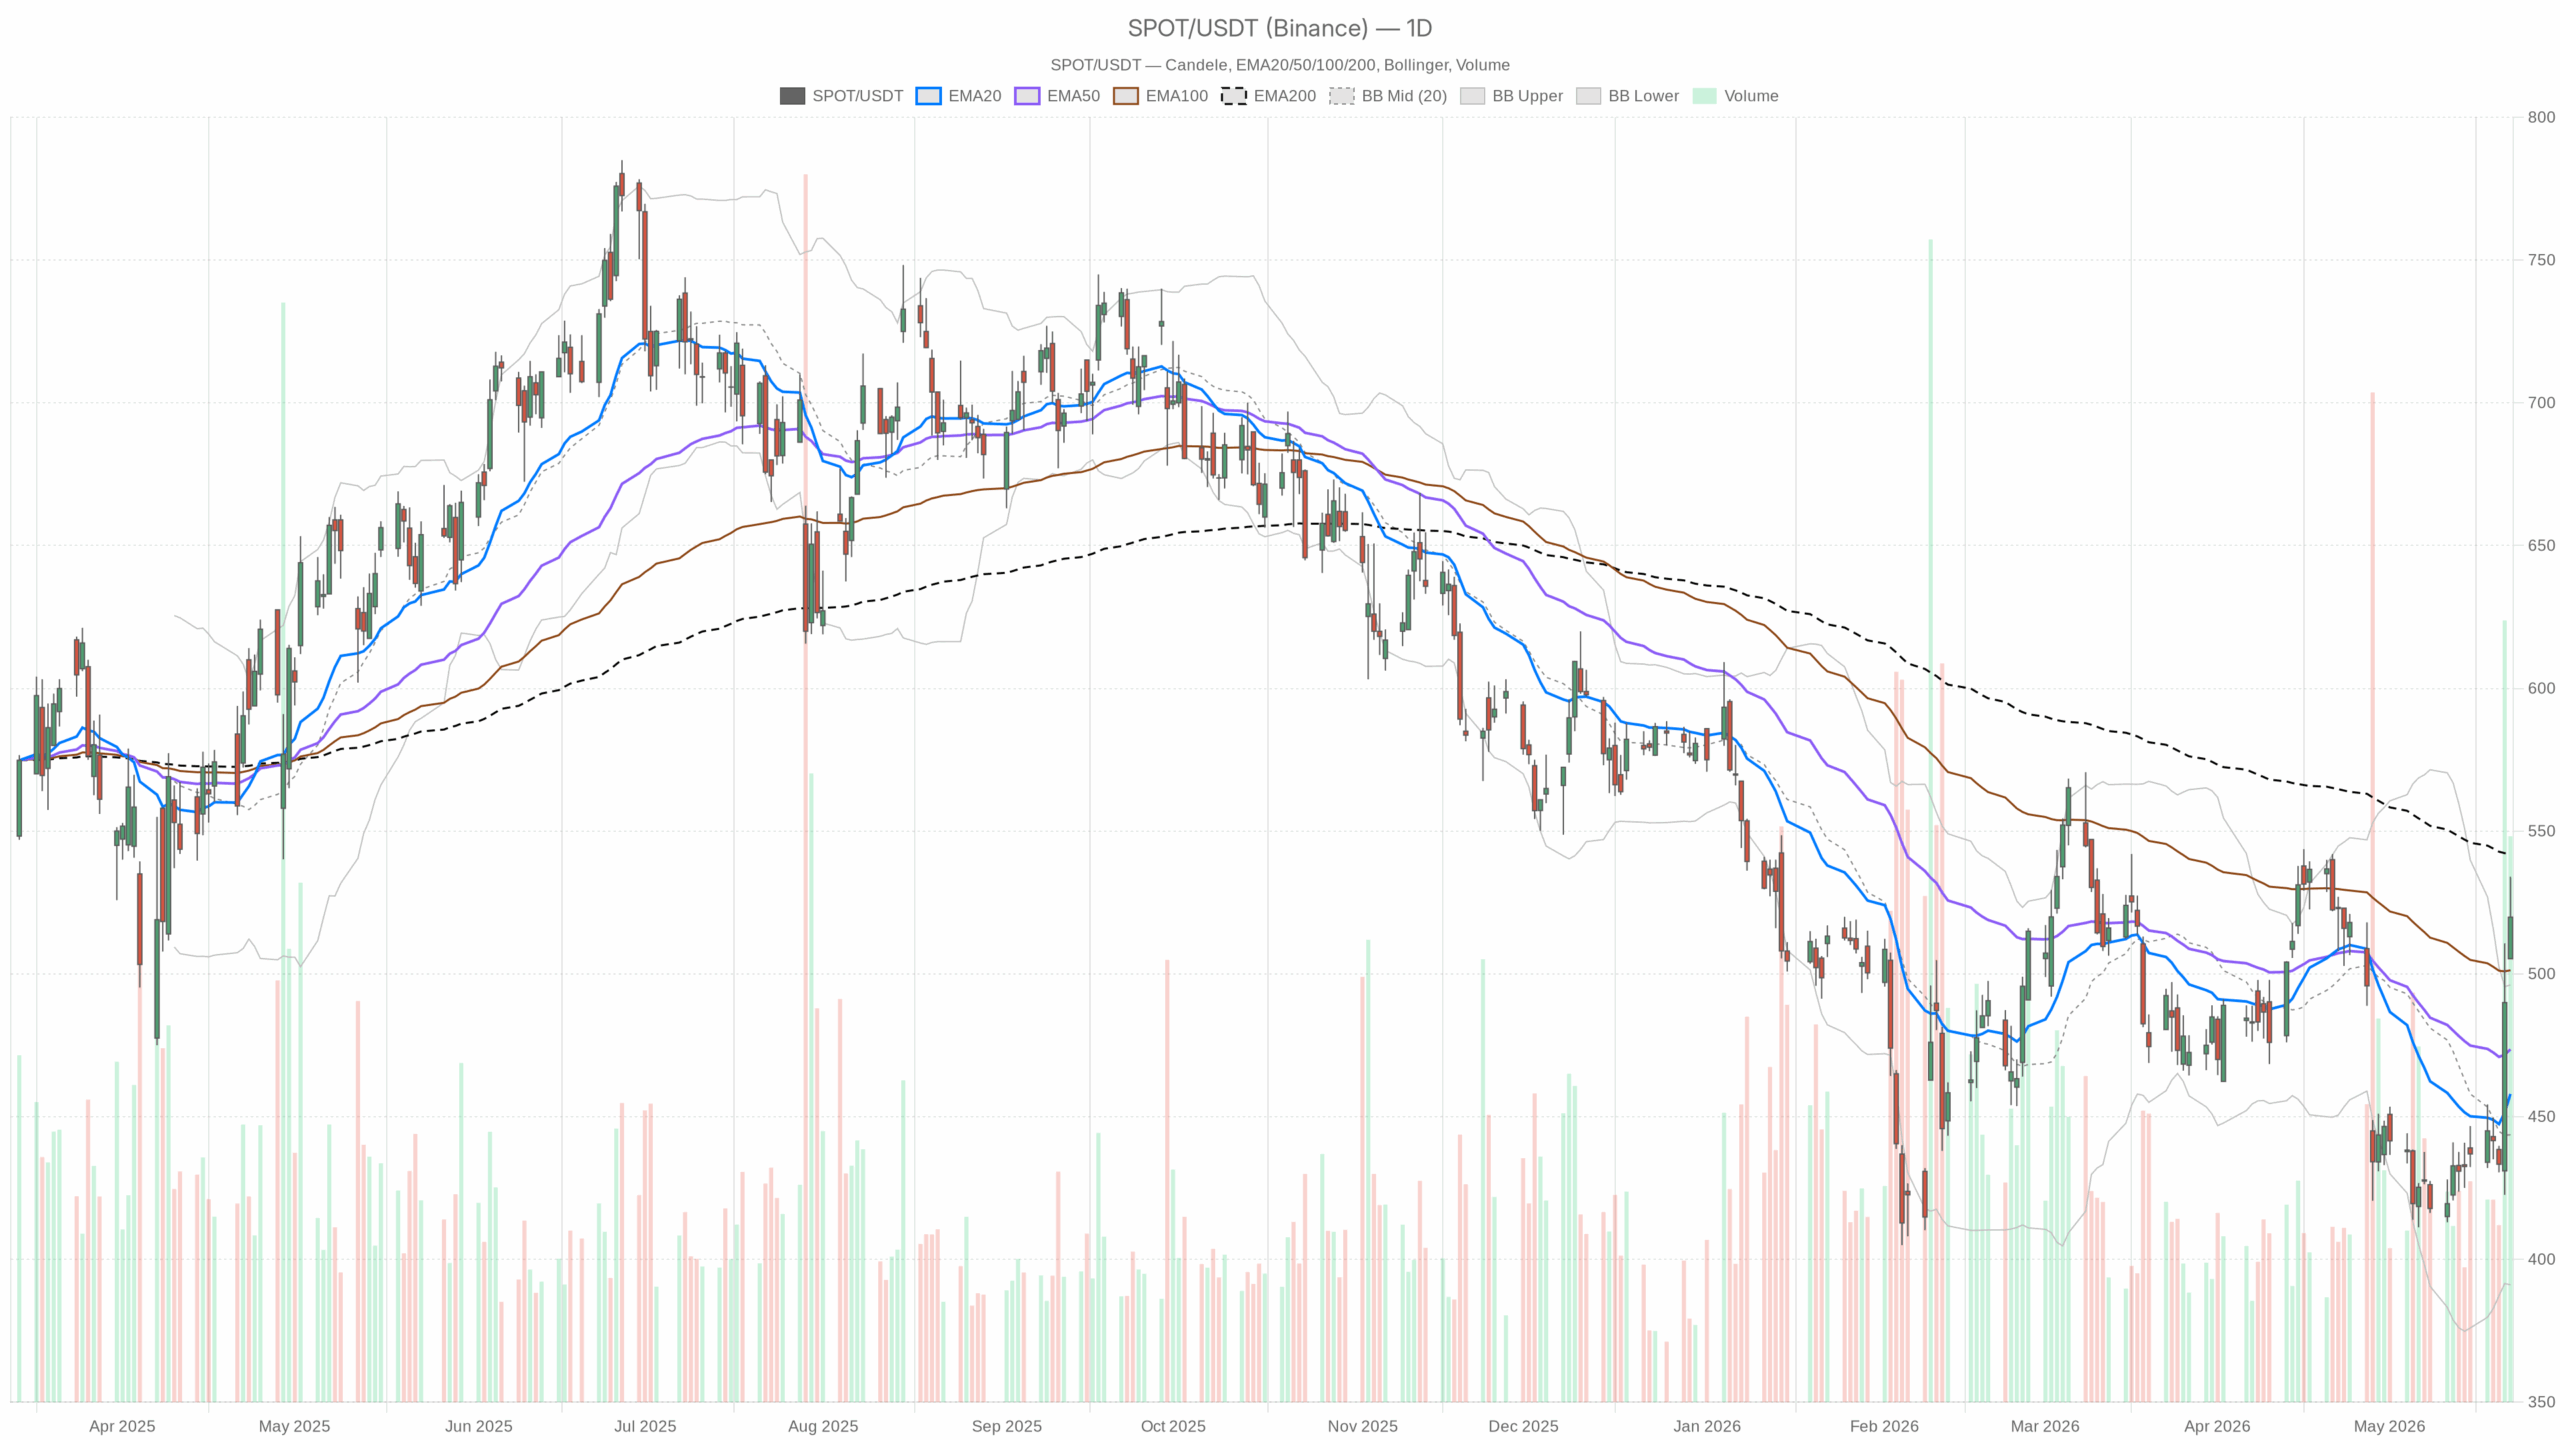 SPOT — daily chart with candlesticks, EMA20/EMA50 and volume.
Daily Technical Setup for Spotify Stock
Price trades well above the 20-day EMA 457.95 and the 50-day EMA 473.56. Therefore, the intermediate uptrend remains intact. However, it still sits below the 200-day EMA 542.04, keeping longer-term resistance overhead.
The daily RSI is 67.35 — hot but not extreme. Momentum is strong with a risk of a pause. The MACD line at -2.77 is crossing well above its signal at -12.58, with a positive histogram of +9.81. Upside momentum is inflecting, but the longer trend has not fully flipped. Bollinger Bands place the upper band at 496.15, with price above it. That reflects a powerful breakout that can either trend or mean‑revert quickly. Daily ATR sits at 23.18, indicating wider ranges.
The daily pivot is 519.72, near the close. R1 stands at 534.14 and S1 at 505.44. Therefore, 534 is the next meaningful test, while 505 marks first support on weakness.
Intraday View: 1‑Hour Chart Backs Bulls
The regime is flagged bullish, with price above the 20/50/200 EMAs 493.75/467.57/461.90. Intraday alignment favors buyers. However, the 1H RSI at 70.16 is stretched, raising the risk of a pullback. The 1H MACD remains positive. The line at 21.77 sits above the signal at 19.25, and the histogram is +2.52.
The hourly Bollinger mid is 484.50 with wide bands, signaling volatility expansion. The 1H pivot is 518.18, with R1 at 521.44 and S1 at 516.34. Holding above 518 keeps bulls in control. Meanwhile, 521–522 is the first intraday breakout band.
15‑Minute Context: Cooling Into Consolidation
The 15‑minute regime is neutral, with price hovering around the EMA20 519.77. RSI sits at 54.37, pointing to consolidation rather than exhaustion. The MACD histogram is -2.69, while the line at 3.13 is below its signal at 5.82. Short‑term momentum has eased.
The 15‑minute Bollinger mid at 524.52 caps price for now, with the lower band at 514.97. A tight consolidation zone is forming. The 15‑minute pivot is 518.42, with R1 at 521.20 and S1 at 516.81. Therefore, a push through 521 could refire momentum. A slip under 516–517 invites a deeper intraday dip.
Fundamental Backdrop Supports Sentiment
News flow backs the move in Spotify Stock. Investor Day eased margin concerns and highlighted monetization paths, including AI initiatives and a UMG partnership. Meanwhile, Jefferies raised its SPOT price target to 600, and UBS pointed to clearer long‑term targets. Sentiment therefore carries a fundamental tailwind.
Spotify Stock Scenarios: Bullish Path
On the daily timeframe, the bullish scenario has the edge. Sustained trade above 518–521, followed by a break through daily R1 534.14, would likely set up a test of the 200‑day EMA 542.04. Clearing 542 would turn the broader trend decisively higher. A firm daily RSI holding in the high 60s and a still‑rising MACD histogram would support continuation. Riding or closing above the Bollinger upper band remains constructive, as long as pullbacks hold prior highs.
Bearish Rebuttal: What Negates the Breakout
Failure to hold 518 intraday, followed by breaks below 516 and then the daily S1 505.44, would signal a failed breakout. From there, mean‑reversion risk grows. A daily close back inside the Bollinger envelope below roughly 496 would confirm exhaustion. The next deeper level is the 50‑day EMA 473.56. In addition, a roll‑over of the 1H MACD and a cooling daily histogram would weaken the bull case.
Timeframe Tension and Risk Framing for Spotify Stock
There is clear timeframe tension. The daily and 1H charts are bullish, while the 15‑minute view is neutral with softer momentum. That often resolves in favor of the higher timeframe. However, near‑term overbought readings argue for two‑way trade first.
Overall, positioning favors a constructive bias into 534–542, but the move is late and volatile. The daily ATR 23.18 counsels respect for tape velocity. Meanwhile, the 518–521 band offers a clean near‑term pivot for risk framing. Until price accepts above 542, bulls have momentum but not the final say. Below 505, the breakout narrative falters and downside volatility likely expands.




 English (US) ·