
 1 month ago
46
1 month ago
46

Spotify Technology S.A. stock staged a violent intraday reversal on August 4, 2026, closing at 503.31 after sinking to 462.62. The move followed Q2 earnings showing 777 million users — up 12% — but a Q3 outlook on active users and operating income that missed estimates.
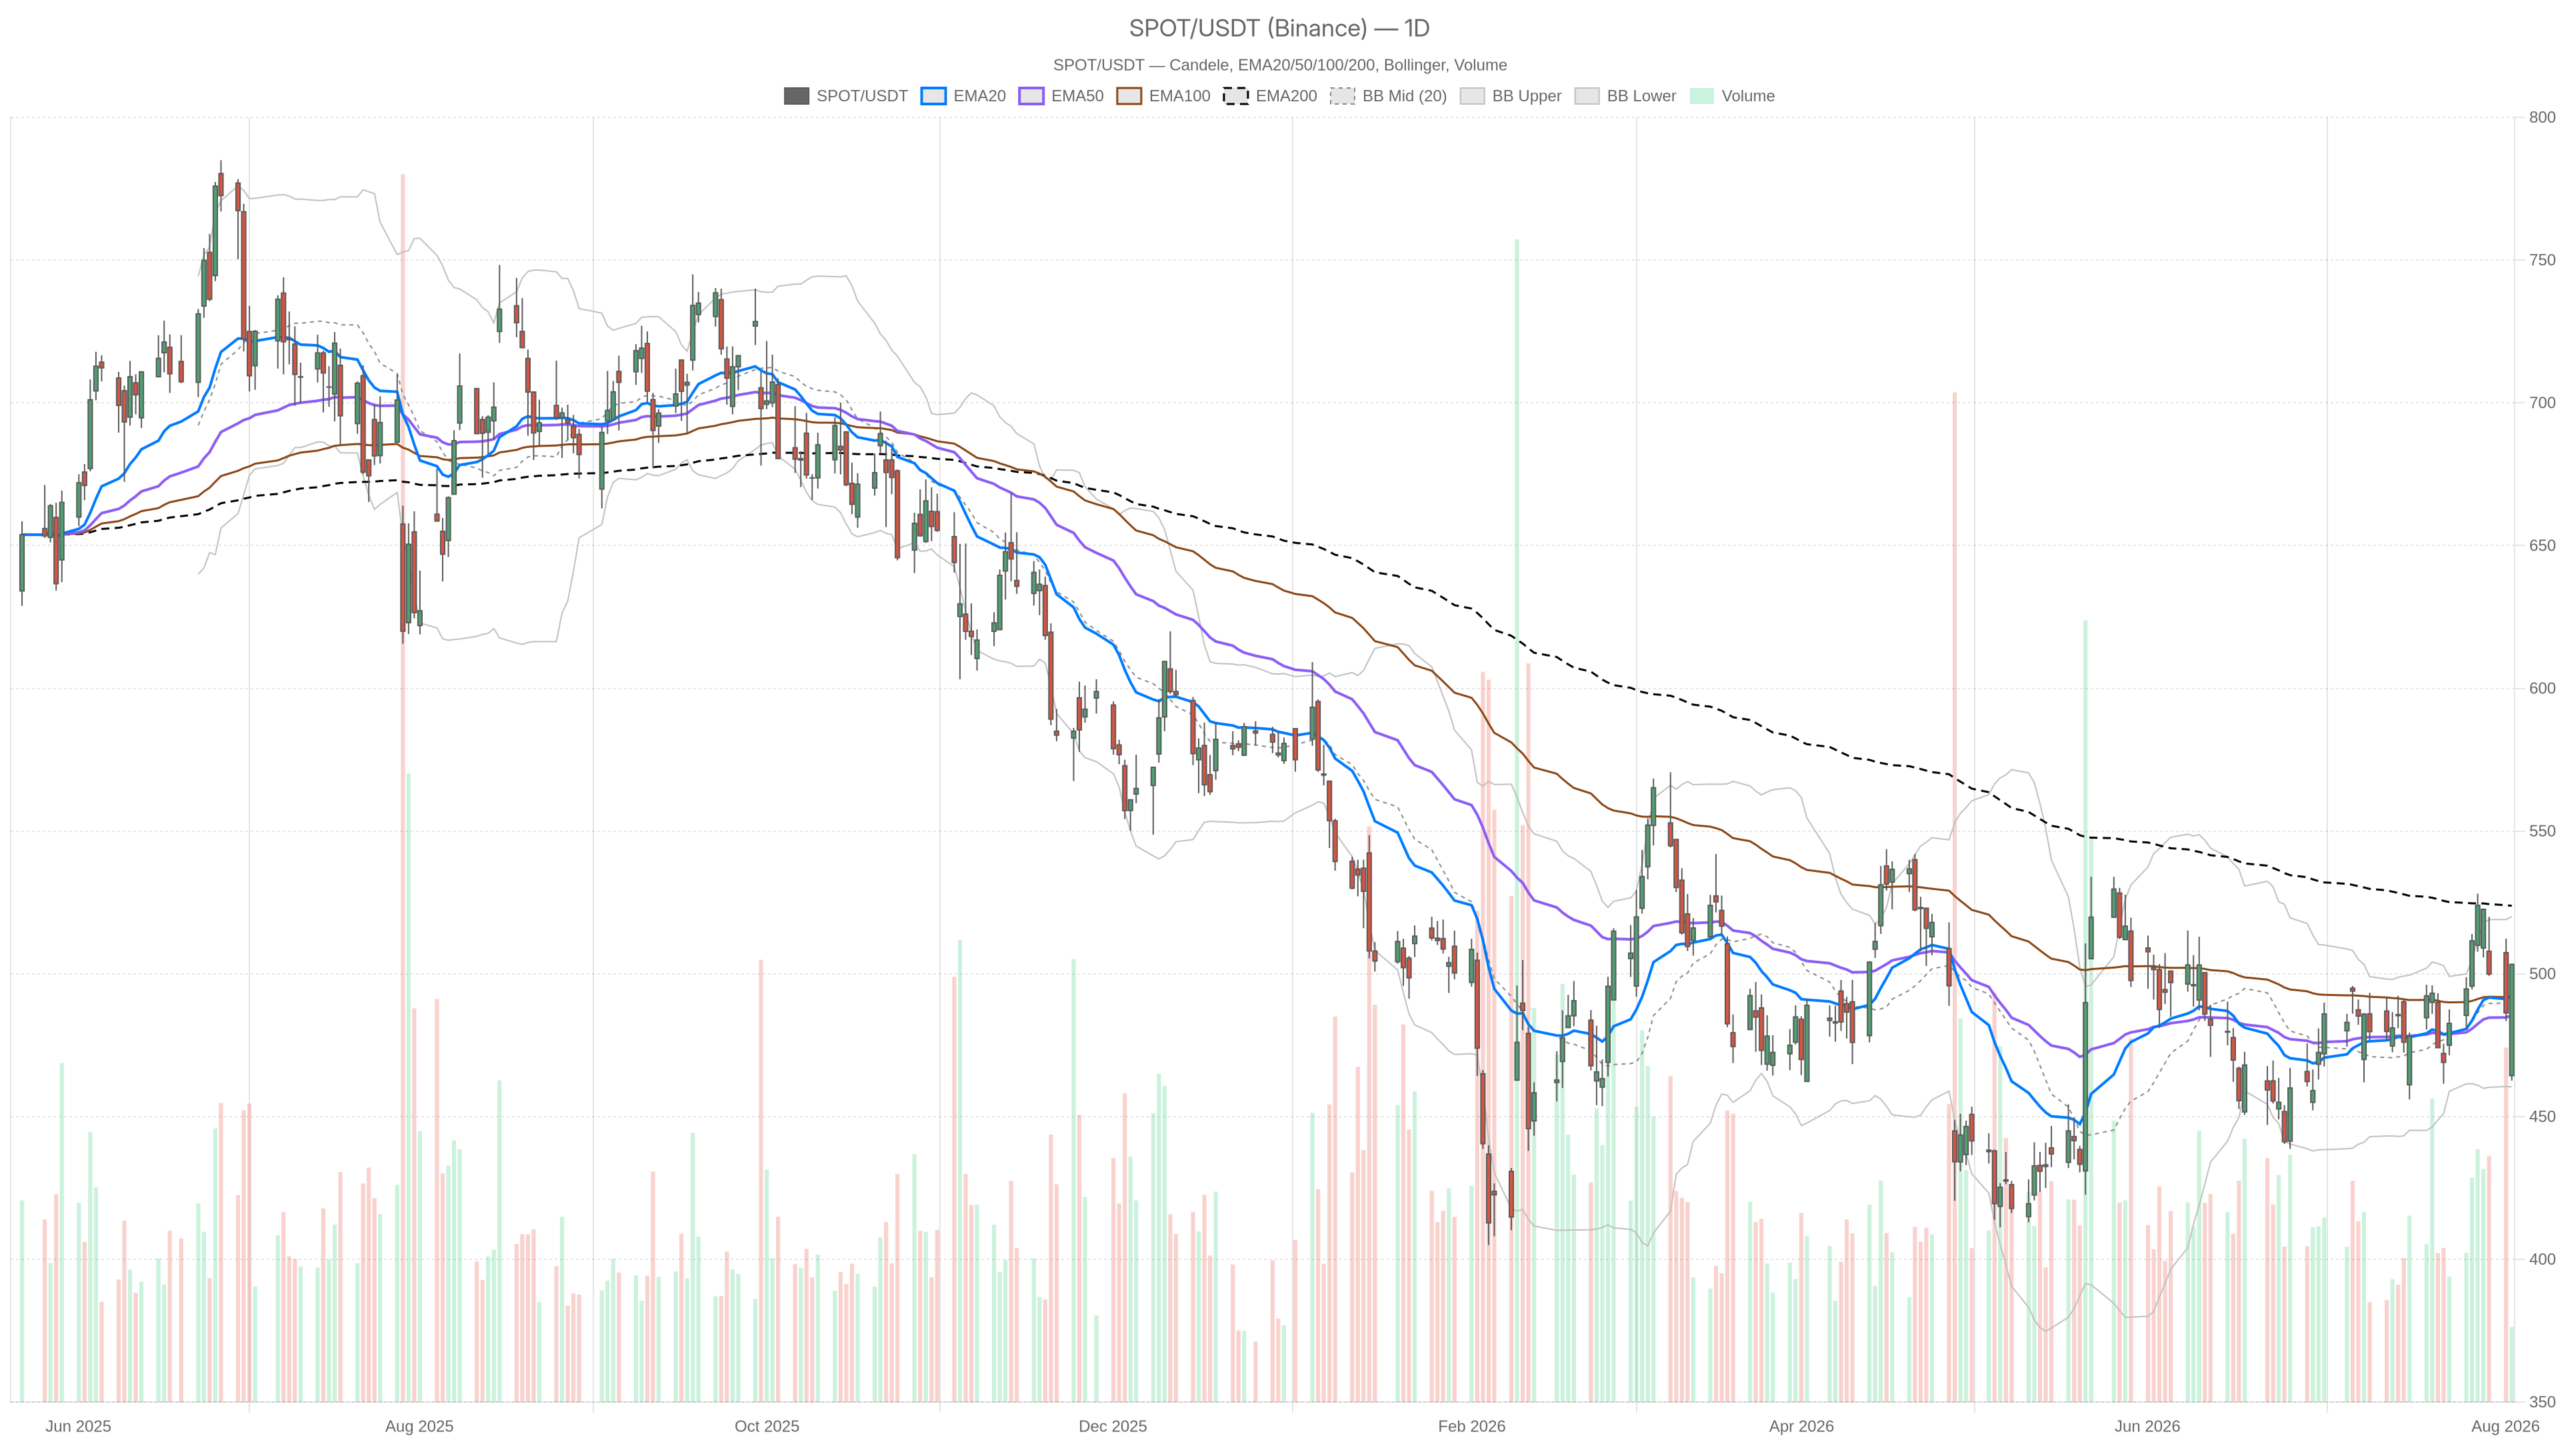 SPOT — daily chart with candlesticks, EMA20/EMA50 and volume.
Key takeaways
- Spotify Technology S.A. stock closed at 503.31 on August 4, 2026, after reversing from an intraday low of 462.62.
- Total users reached 777 million, a 12% year-over-year increase, but Q3 guidance on active users and operating income missed estimates.
- The daily chart shows a constructive reversal above the EMA20 and EMA50, but price remains below the EMA200 at 523.85.
- Hourly momentum has turned negative, creating a divergence from the daily bullish signal.
- Elevated daily ATR at 20.78 confirms that volatility, not trend, currently defines the setup.
The core tension in this setup is simple: the daily chart shows aggressive buying after a sharp drop. However, the underlying fundamental narrative — a weaker outlook on users and profit, plus rising AI-related cost pressure on margins — remains unresolved. That conflict between price action and guidance is exactly what technical readers need to weigh going forward.
Daily Chart: Spotify Technology S.A. Stock Fights Back From the Lows
The daily chart shows Spotify Technology S.A. stock recovering from its earnings-driven selloff, closing above short-term moving averages but still below the 200-day EMA.
On the daily timeframe, the regime is technically classified as neutral. The indicators back that read. Price closed at 503.31. It sits above both the EMA20 at 492.34 and the EMA50 at 485.47. This signals the short-term trend has turned constructive after the drop. However, the close remains well below the EMA200 at 523.85. That gap matters. The broader structure is still capped by a longer-term average that has not yet been reclaimed.
Meanwhile, the daily MACD line at 7.14 sits above its signal line at 5.93, with a positive histogram of 1.2. That is a constructive momentum signal, consistent with the size of the intraday reversal. The RSI14 at 55.07 sits in neutral territory, leaning slightly bullish but far from overbought. The Bollinger setup adds context too. The mid-band sits at 490.26. The upper band is at 520.06 and the lower band at 460.46. Price closed comfortably inside the bands, near the upper half. This suggests the rebound has room before it becomes technically stretched.
Meanwhile, volatility is elevated. The ATR14 reading of 20.78 confirms this was an unusually wide-range session, typical of an earnings surprise. On the pivot framework, price closed above the daily pivot point of 489.85. It is now pressing toward R1 at 517.08. S1 sits well below at 476.08. In short, the daily tape shows a market that got hit hard on guidance. Then it absorbed the selling and pushed back toward the upper part of its recent range.
Hourly Momentum Complicates the Rebound
The hourly chart shows the rebound has stalled, with momentum turning negative even as the daily structure remains constructive.
The latest hourly close of 499.29 sits just below the EMA20 at 499.95 and the EMA50 at 500.16. It still holds above the EMA200 at 489.74. That alignment shows the intraday rally has stalled just under short-term resistance. Yet it stays above the longer hourly average.
More importantly, hourly momentum has turned negative. The MACD line at -4.22 sits below its signal at -2.92, with a histogram of -1.3. That is a clear divergence from the daily MACD, which remains bullish. In other words, the daily chart is still constructive. But the hourly chart shows the buying push has already lost steam into the most recent bar. RSI14 on the hourly, at 48.22, confirms this cooling. It sits right at the neutral midpoint, neither bullish nor bearish.
Meanwhile, the hourly Bollinger bands reinforce the idea of a pause rather than a breakdown. Price at 499.29 sits below the mid-band of 503.26. The band stretches from 481.69 to 524.84. On the pivot grid, price is trading between the hourly pivot at 498.53 and R1 at 503.47. That is a tight, undecided zone. Therefore, the hourly timeframe is best read as a consolidation phase. It follows the sharp daily reversal, not yet confirming continued strength.
15-Minute Execution: Testing the Upper Boundary
The 15-minute chart shows aggressive short-term buying pushing Spotify Technology S.A. stock to the upper boundary of its range, right at a decision point.
Zooming into the 15-minute chart, the most recent candle closed at 503.31, matching the daily close, with a high of 503.62. This is execution-level context, but it does show short-term buyers are active right at the point of decision. The 15-minute EMA structure is fully bullish. Price sits above the EMA20 at 493.98, the EMA50 at 497.91, and the EMA200 at 499.61.
RSI14 on this timeframe reads 63.74 — firm without being extreme. The MACD line has just crossed above its signal line, at 0.01 versus -2.12, producing a histogram of 2.14. That crossover is fresh and suggests renewed short-term buying pressure. Notably, price has pushed above the 15-minute upper Bollinger band of 500.48. This reflects an aggressive, momentum-driven push rather than a slow grind. On the 15-minute pivot grid, price sits between the pivot at 501.97 and R1 at 504.96. The immediate test is happening right now at this resistance shelf.
Bullish Scenario: Confirmation Above Resistance
The bullish case for Spotify Technology S.A. stock requires a confirmed break above daily R1 at 517.08 and a move toward the EMA200 near 523.85.
If price clears those levels, that would confirm the earnings-day selloff was overdone. Support for this scenario comes from the underlying user growth story. Spotify now has 777 million total users, up 12%. This gives bulls a fundamental anchor even after the disappointing near-term guidance. A daily MACD that stays positive, alongside RSI holding above the neutral 50 line, would add technical weight to that thesis.
However, for this scenario to gain real traction, the hourly chart would need to flip its momentum back to positive. Right now, the negative hourly MACD is the main obstacle standing between the daily reversal and a genuine trend change.
Bearish Scenario: Guidance Miss Reopens Downside Risk
The bearish case hinges on the Q3 guidance miss and margin pressure from AI investments, which could reassert downside control.
In contrast, the weaker Q3 outlook on active users and operating income gives sellers a clear narrative. Reports that AI investments are weighing on margins add further weight. If Spotify Technology S.A. stock loses the daily EMA20 at 492.34 and the pivot at 489.85, the intraday bounce would look like a relief rally. That rally would sit within a still-fragile structure.
Meanwhile, a break below the daily S1 at 476.08 would invalidate the bullish case. It would reopen the path back toward the session low of 462.62. Given that one Seeking Alpha piece flagged AI-related platform risk and label dependence ahead of earnings, this bearish narrative already had traction before the numbers were even released. In contrast, the strength of Tuesday’s reversal shows the market is not fully convinced either direction yet.
Closing Take: Volatility Defines the Setup
Overall, Spotify Technology S.A. stock is caught between a strong daily reversal and unresolved fundamental concerns. The daily chart shows resilience, the hourly chart shows fading momentum, and the 15-minute chart shows an aggressive short-term push into resistance. That is a genuinely mixed signal set, not a clean trend. At the same time, the elevated ATR reading of 20.78 on the daily chart confirms that volatility itself is the dominant feature of this setup right now.
Therefore, positioning around this level requires patience. The next few sessions should clarify whether the reversal has real follow-through. Price behavior around the daily pivot and EMA20 will be key. It will show whether the weaker Q3 guidance ultimately reasserts control. Until that resolution happens, uncertainty remains the defining characteristic of this chart.
FAQ
What caused Spotify Technology S.A. stock to drop intraday on August 4, 2026?
Spotify reported Q2 2026 earnings showing 777 million total users, up 12% year-over-year. However, its Q3 forecast on active users and operating income missed estimates, triggering an initial selloff to 462.62 before the sharp reversal.
What is the key resistance level for Spotify Technology S.A. stock?
The key resistance is the daily R1 at 517.08, followed by the EMA200 at 523.85. A close above both would confirm the earnings-day reversal has follow-through.
What is the main risk for Spotify Technology S.A. stock after the Q2 report?
The main risk is that the weaker Q3 guidance on active users and operating income, combined with rising AI-related cost pressure on margins, could reassert downside control if the stock breaks below the daily EMA20 at 492.34.
How many total users does Spotify have?
Spotify reported 777 million total users as of Q2 2026, representing a 12% increase year-over-year.
Disclaimer: This article is for informational purposes only and does not constitute financial advice, an investment recommendation, or a solicitation to buy or sell any financial instrument or cryptocurrency. The analysis provided is not indicative of future results. Investing in crypto assets and financial markets carries a high risk of capital loss. Always do your own research (DYOR) and consult a qualified financial advisor before making any decision.
Article produced with the assistance of artificial intelligence and reviewed by the editorial team.






 English (US) ·